
/NQ (Nasdaq 100 futures) is currently back-testing dual trendlines from below where a reaction is likely with a near-term pullback target the minor uptrend line below. Should /NQ reverse soon, the minor uptrend line below would likely come into play as support although a solid break below that level would be bearish.
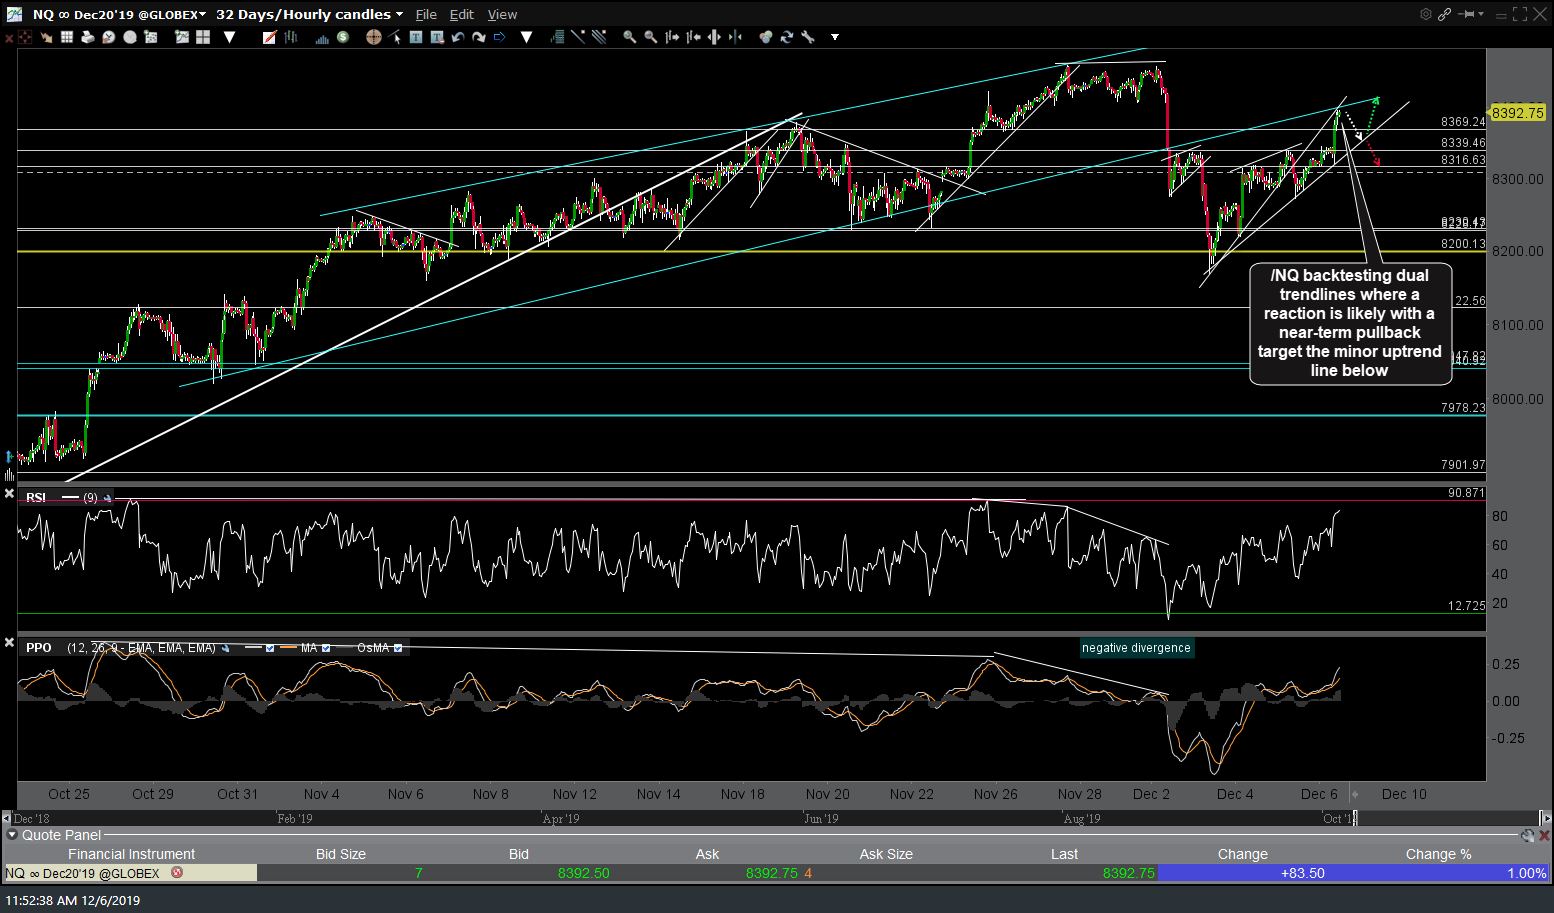
NQ 60m 2 Dec 6th
/ES (S&P 500) is also back-testing a comparable trendline from below with a minor uptrend line below a likely pullback target as well, should the stock indexes reverse soon.
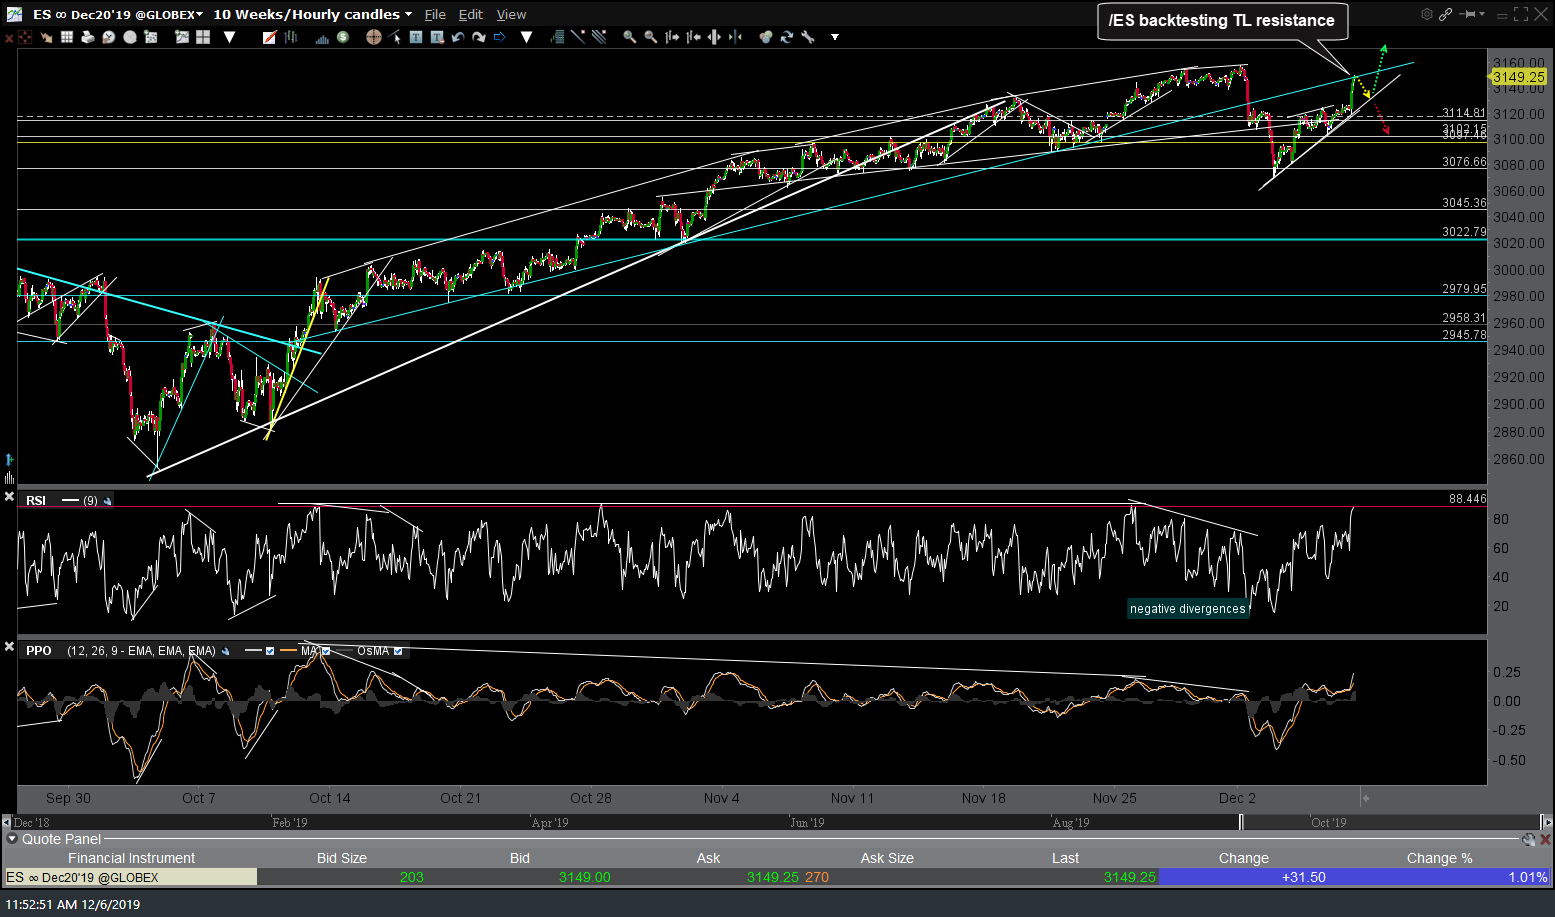
ES 60m Dec 6th
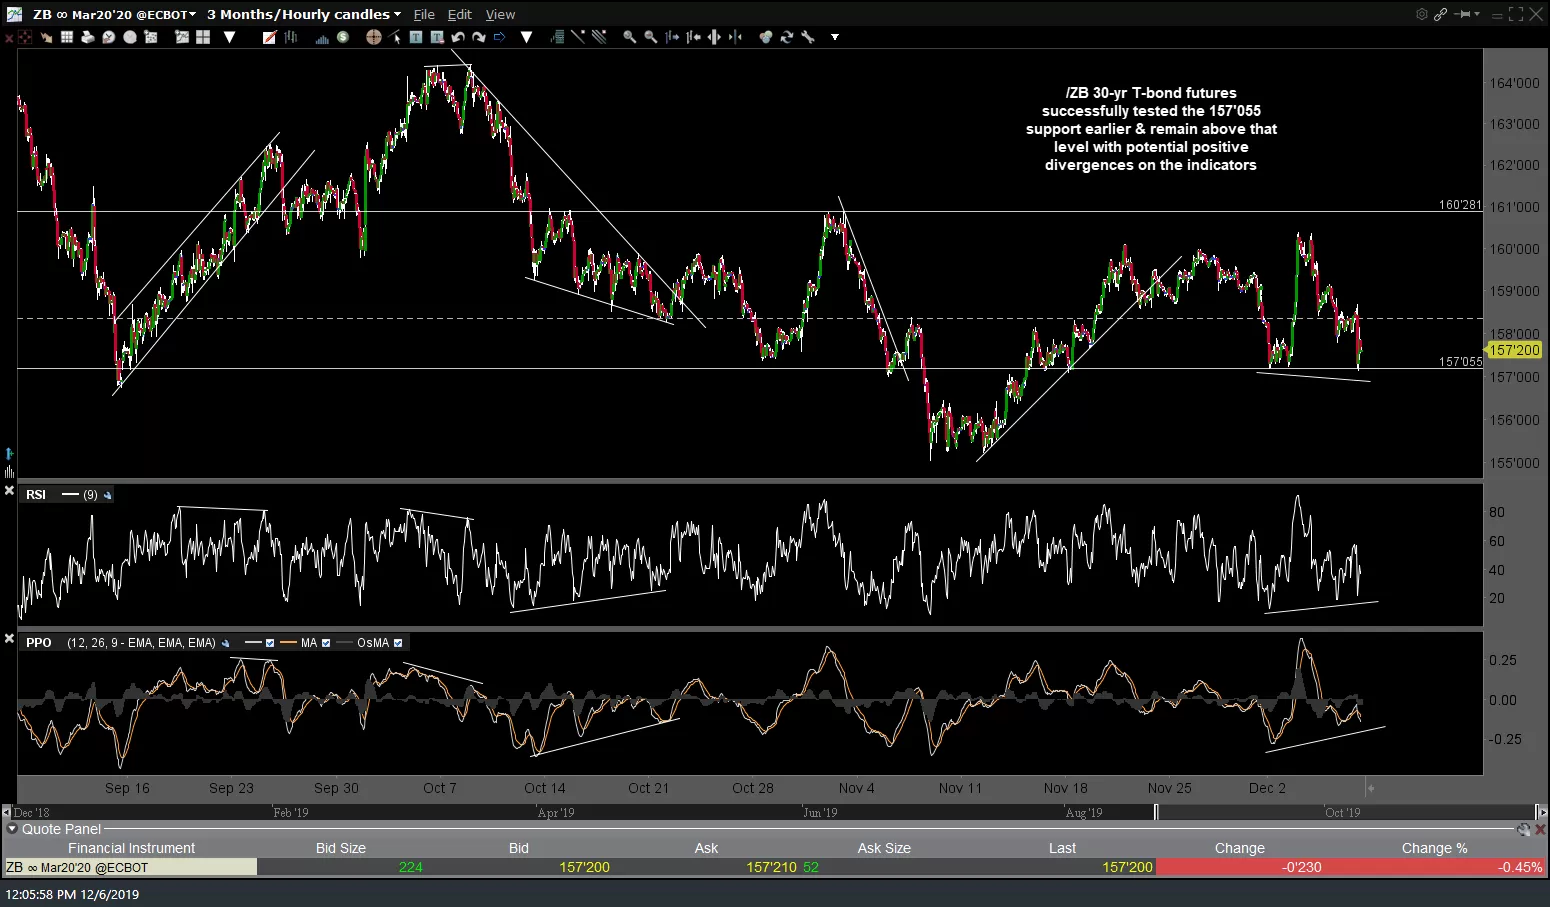
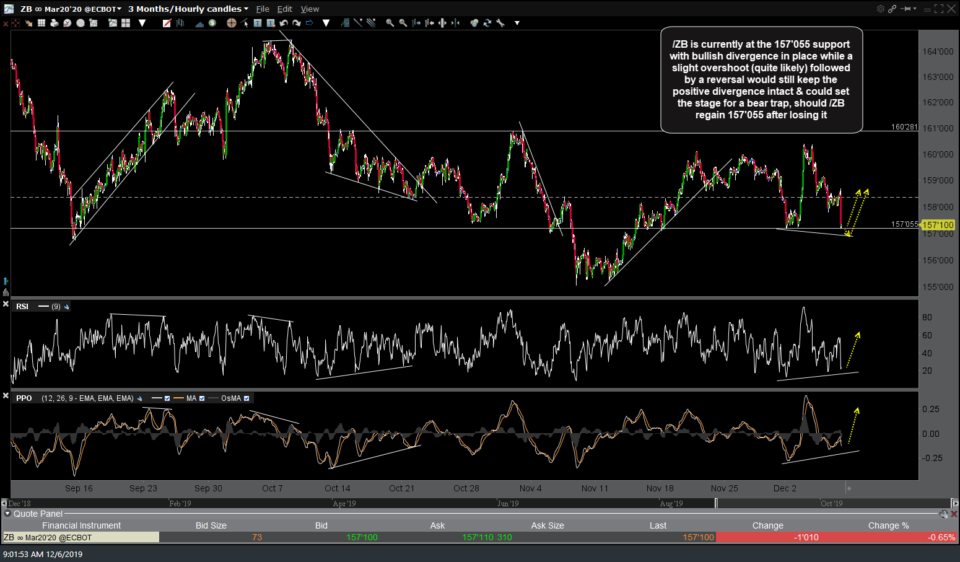
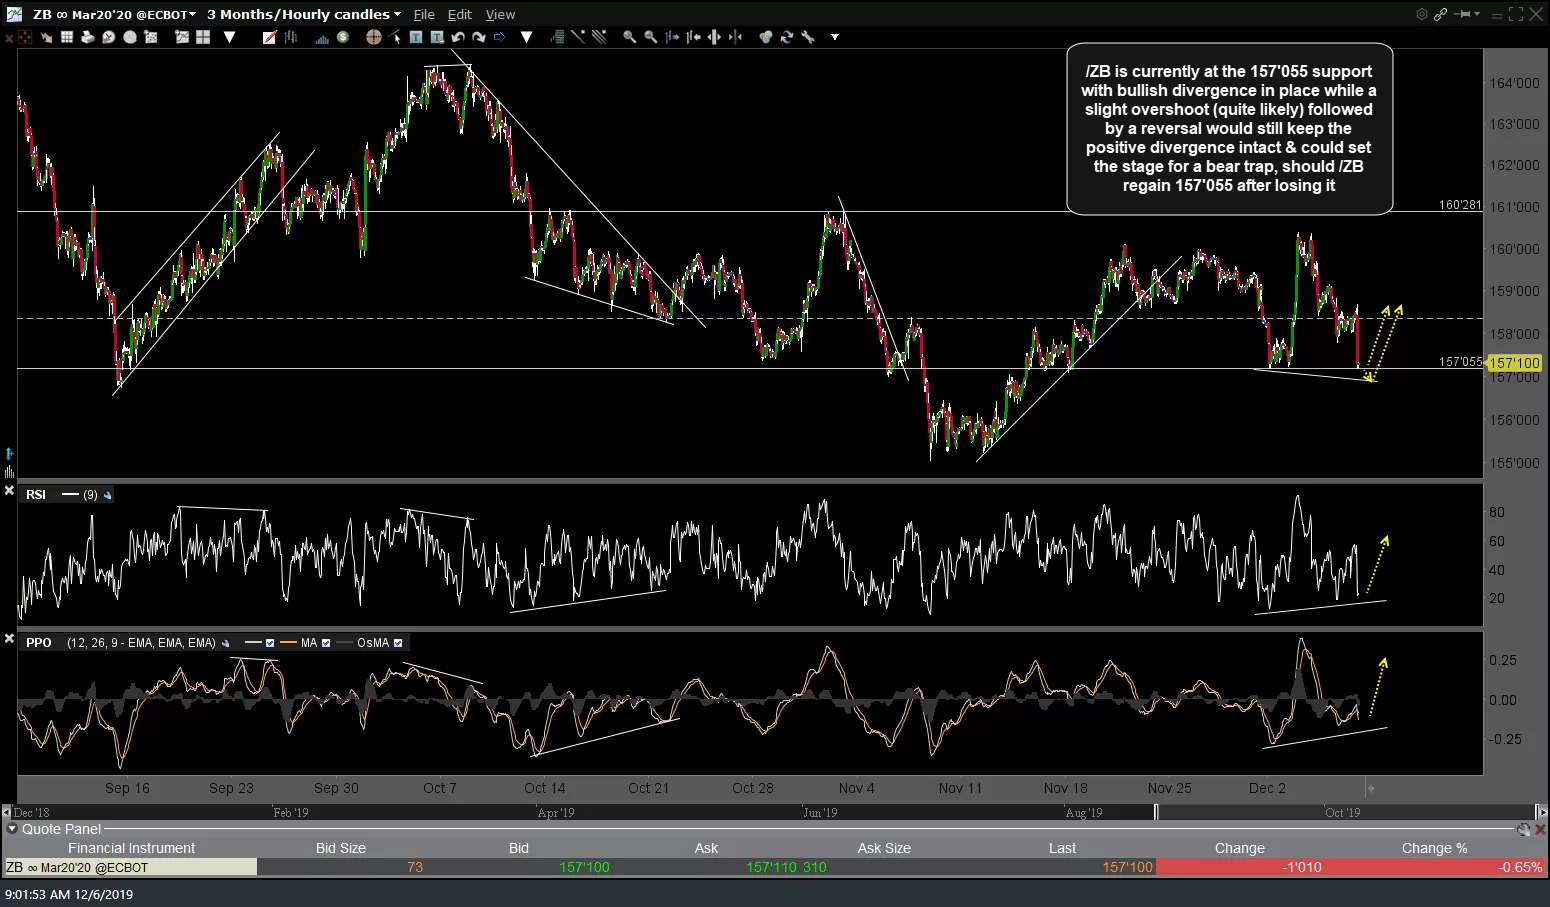
At the same time the risk-on equity markets are at resistance, the risk-off assets, gold & US Treasury bonds, are both trading just above support after successfully testing & so far holding those levels today. /ZB 30-yr T-bond futures successfully tested the 157’055 support earlier & remain above that level with potential positive divergences on the indicators. The first chart below was the 60-minute chart that I posted in the trading room earlier when /ZB had fallen to that level followed by the updated chart showing Treasuries so far reversing off that level. Note: Multiple charts posted together in a gallery format as below will not appear on the subscriber email notifications but may be viewed on the site by clicking on the title of the post within the email.
-
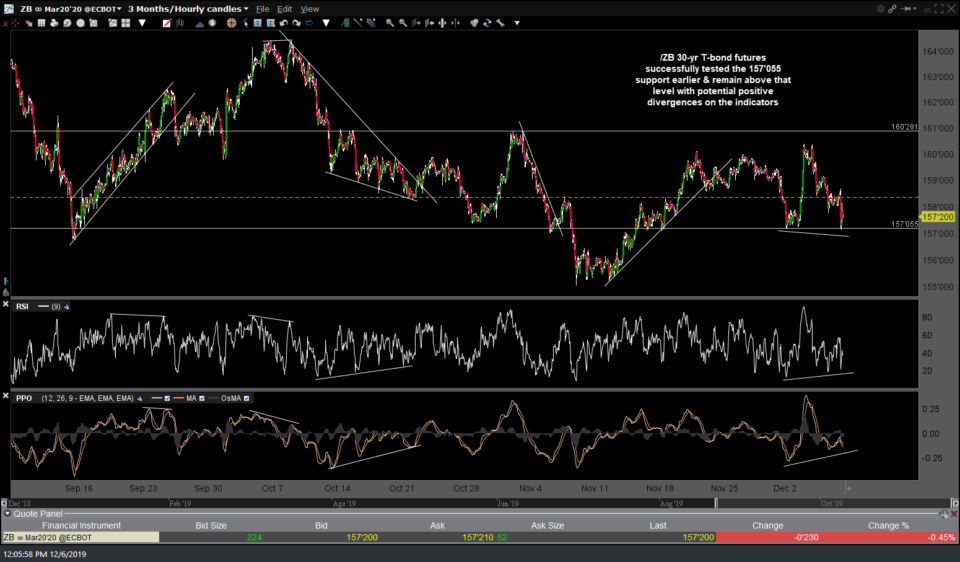
- ZB 60m 2 Dec 6th
-
- ZB 60m Dec 6th
Although /GC gold fell sharply along with Treasuries immediately following the Jobless Claims report, unlike the stock market which continued to build on its pre-market gains, gold & T-bonds held those support levels & actually regained some of the earlier losses. Also, note that rallies have typically followed such extreme oversold readings in /GC.

GC 60m Dec 6th