
As a follow-up to the charts posted before the market opened yesterday, /NQ (Nasdaq 100 futures) is still trading below the small wedge (minor TL) + larger TL off the early Oct lows with breaks below each of the support levels below opening the door to a potentially larger pullback.
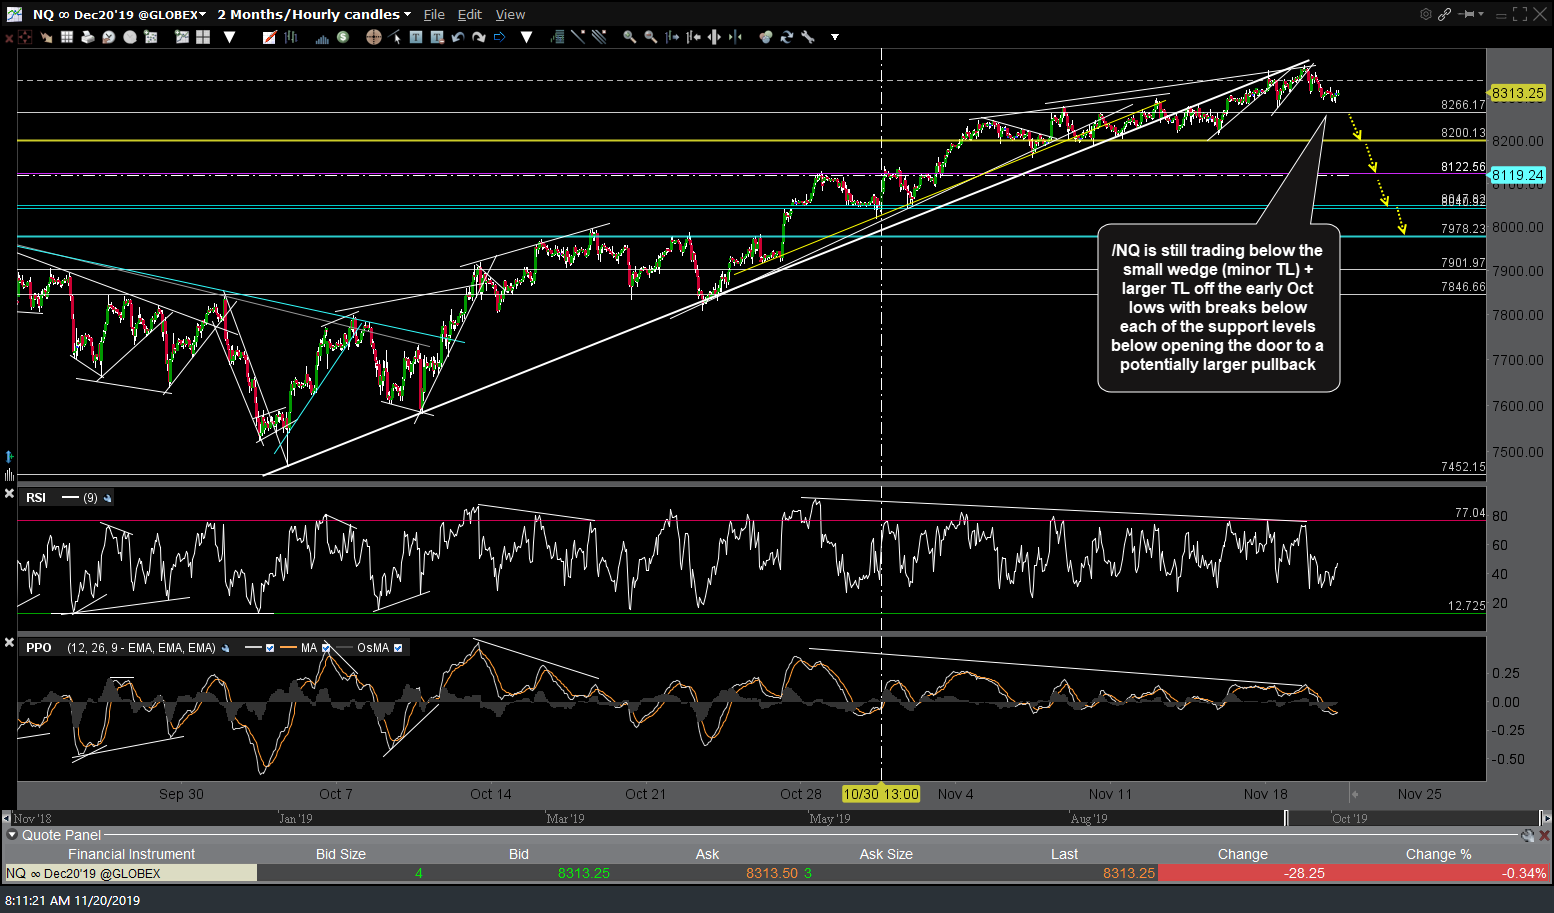
NQ 60m Nov 20th
/ES (S&P 500) has pulled back to the 3102 support with the interesting uptrend lines somewhat below likely to trigger more downside if taken out.

ES 60m Nov 20th
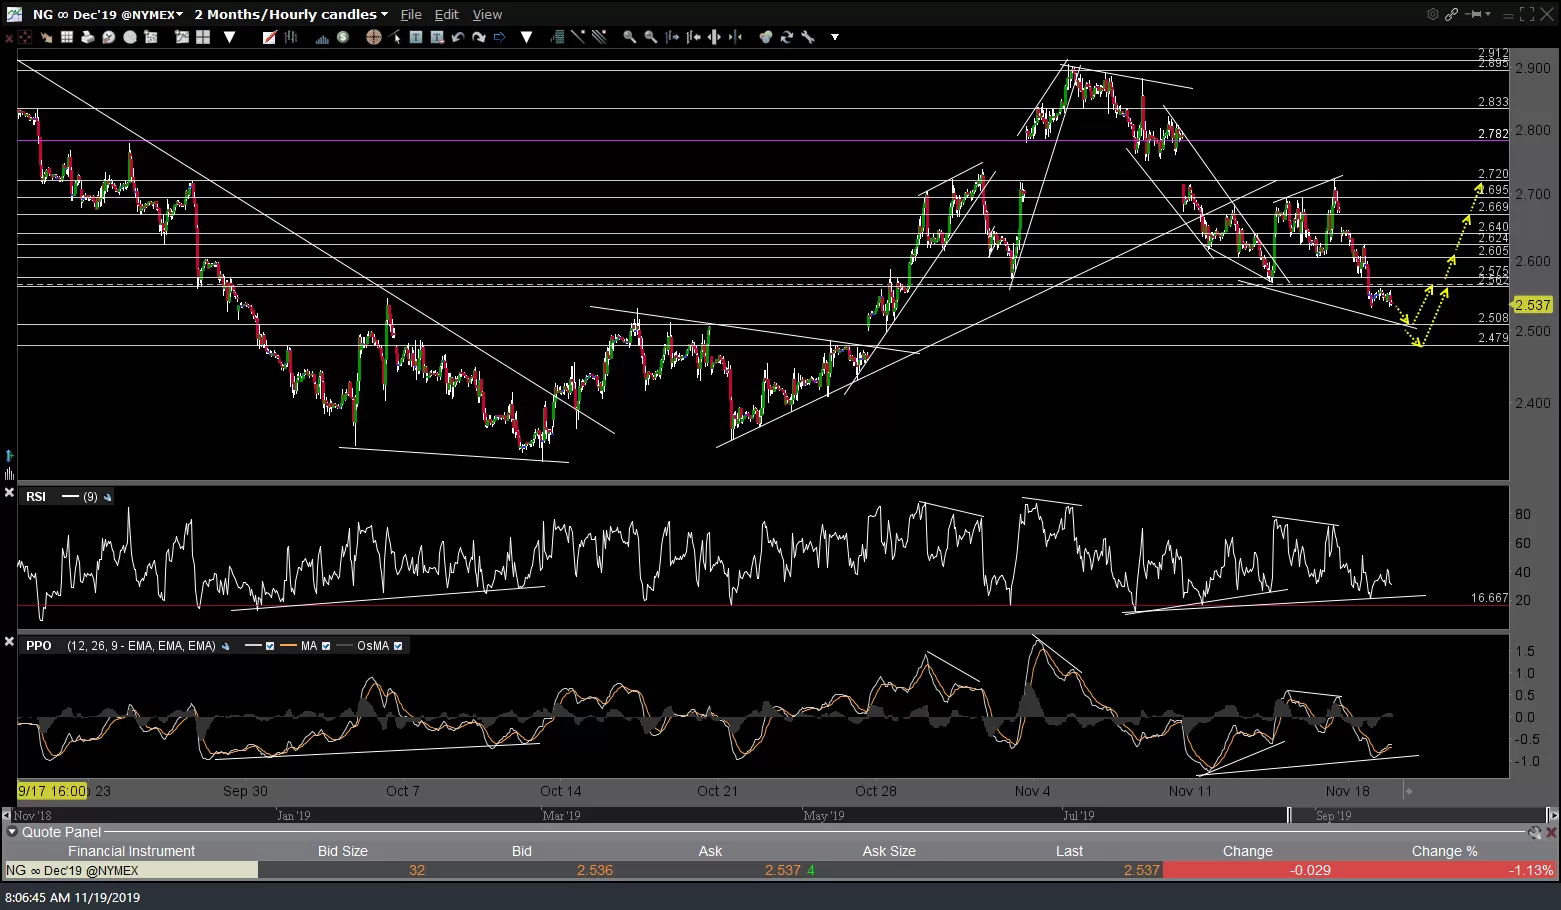
/NG (natural gas) reversed off the 2.50ish support with the bullish divergences confirmed while trading at the first target/resistance zone now. Yesterday’s & today’s updated 60-minute charts below.
-
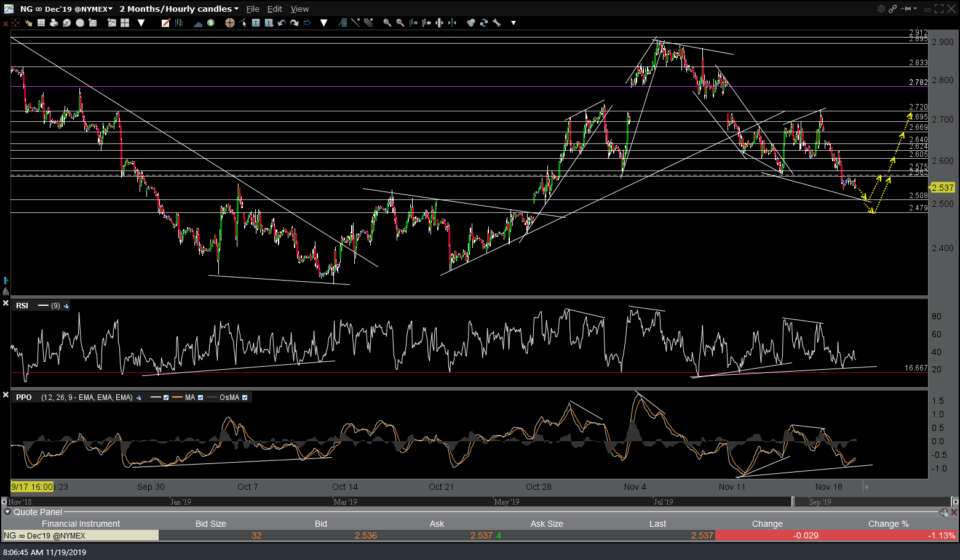
- /NG 60m Nov 19th
-
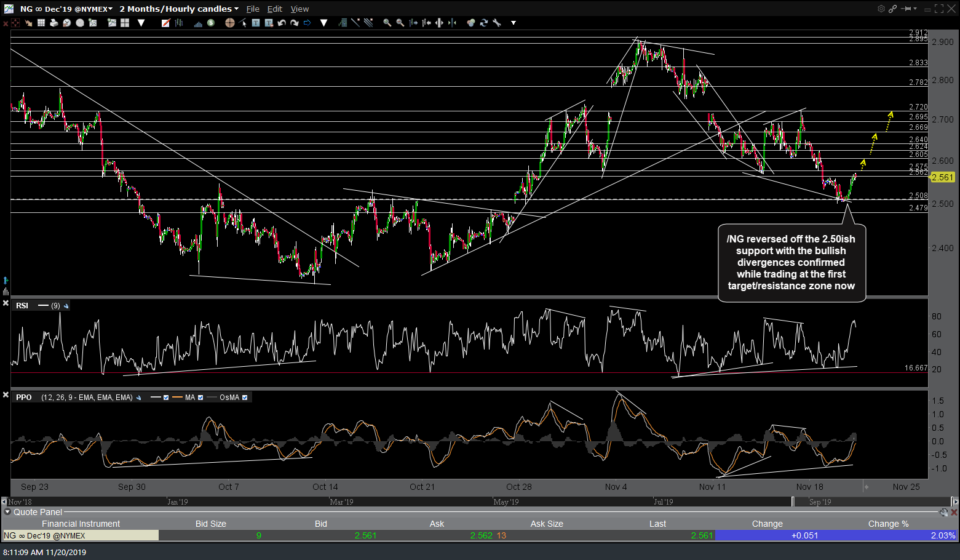
- NG 60m Nov 20th
