
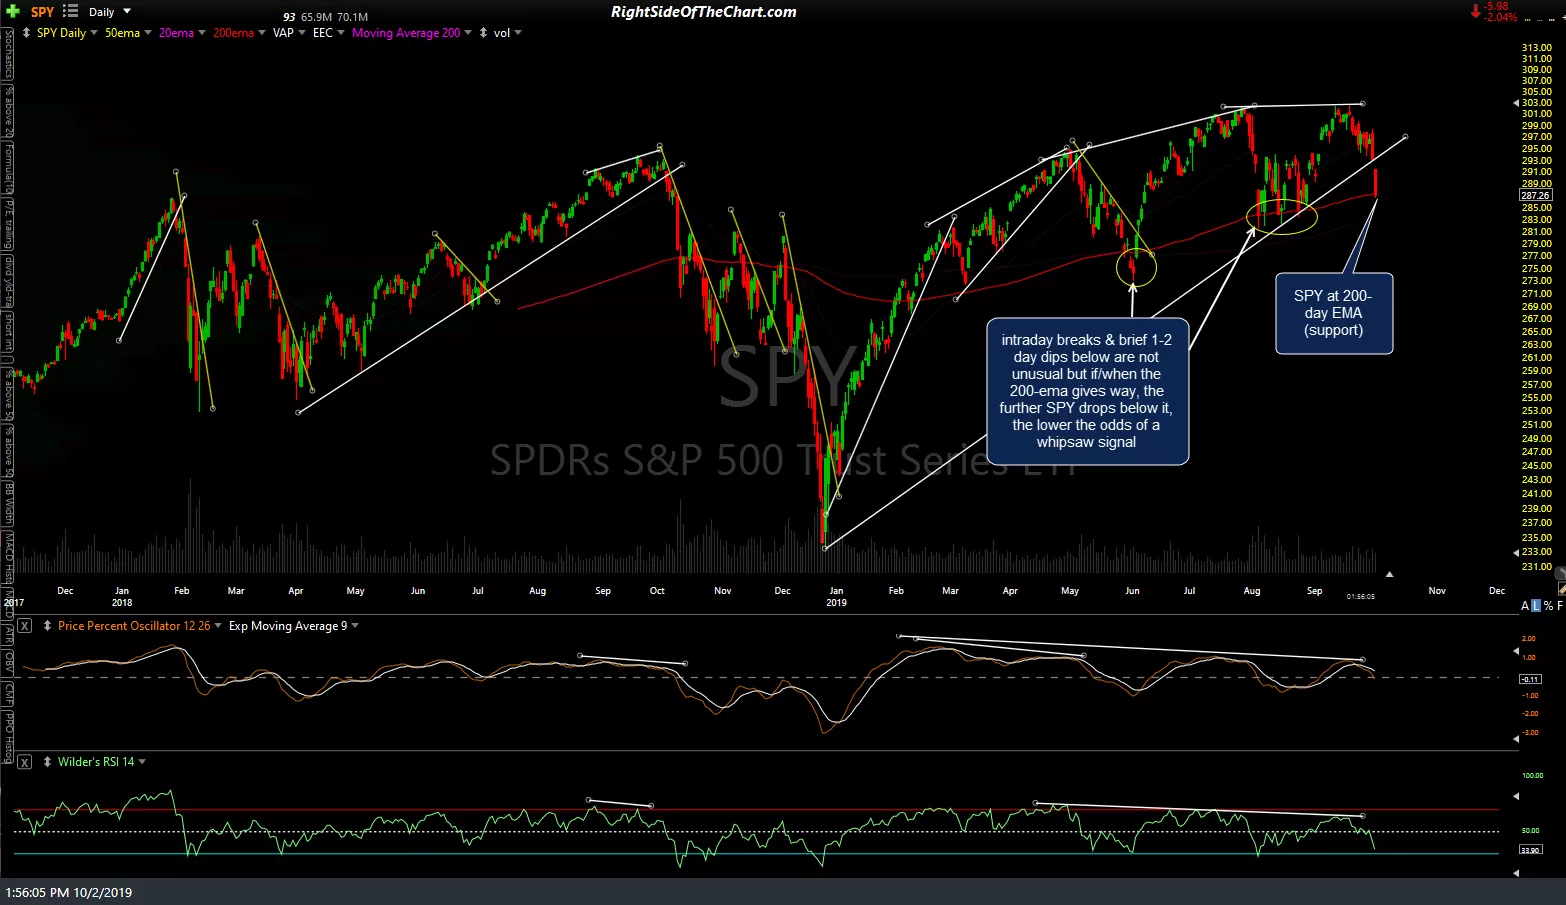
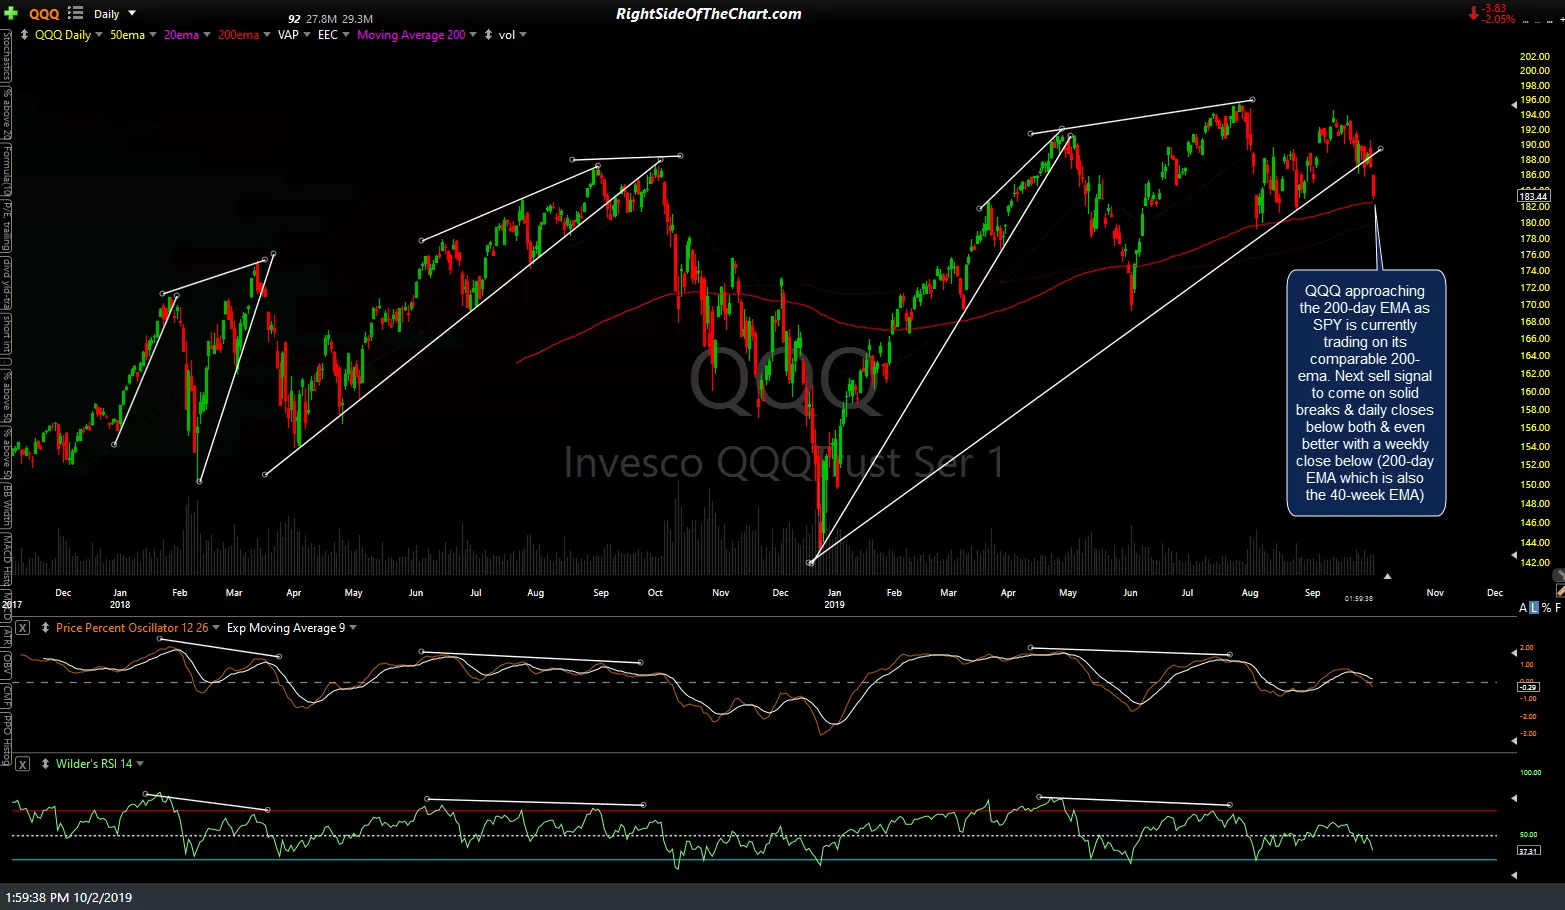
SPY has fallen to the 200-day EMA (support) with QQQ trading just a hair above its 200-day EMA, a key level watched by many traders that often contains pullbacks during bullish trends & triggers more powerful selloffs when taken out during corrections. While intraday breaks, as well as brief 1-2 day dips below, are not unusual, if/when the 200-ema clearly gives way, the further SPY & QQQ drops below those levels, the lower the odds of a whipsaw (false breakdown) signal. As such, this is a key battleground for bulls & bears. SPY & QQQ daily charts below.
-
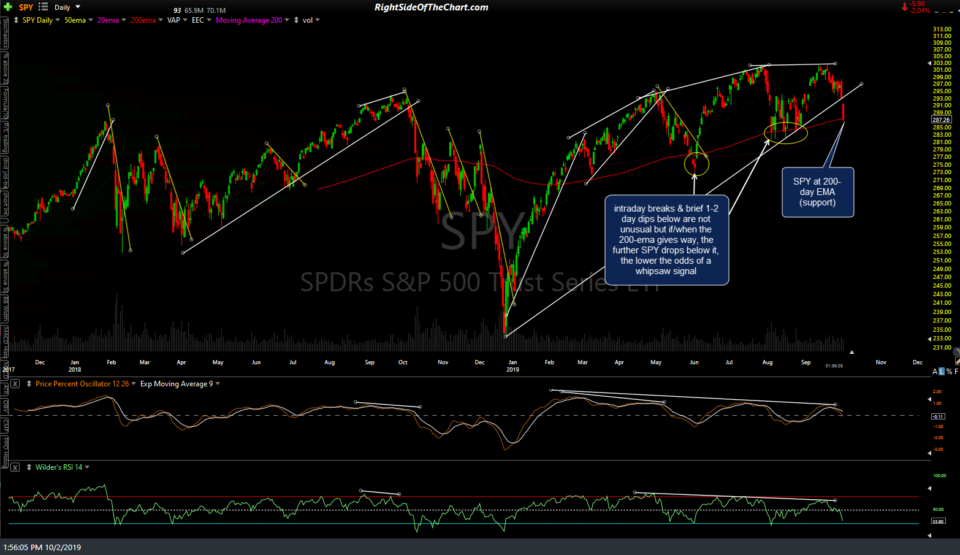
- SPY daily Oct 2nd
-
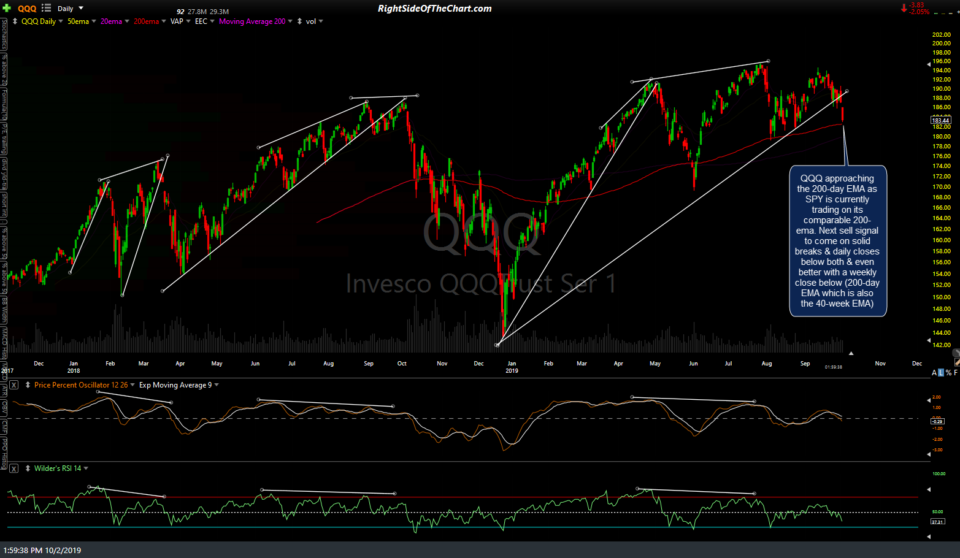
- QQQ daily Oct 2nd
Another takeaway from this would be the fact that adding to shorts with SPY & QQQ on or very near their 200-day EMA is not very objective as trading 101 say that you either buy drops to support, cover shorts at drops to support or wait for support to be broken before initiating or adding to shorts. At the same time SPY hit the 200-day EMA, I has posted (about an hour ago) that it has also fallen to the uptrend line generated off of the bottom of the August trading range on the 60-minute chart below, stating that at least a minor bounce was likely.

SPY 60m Oct 2nd
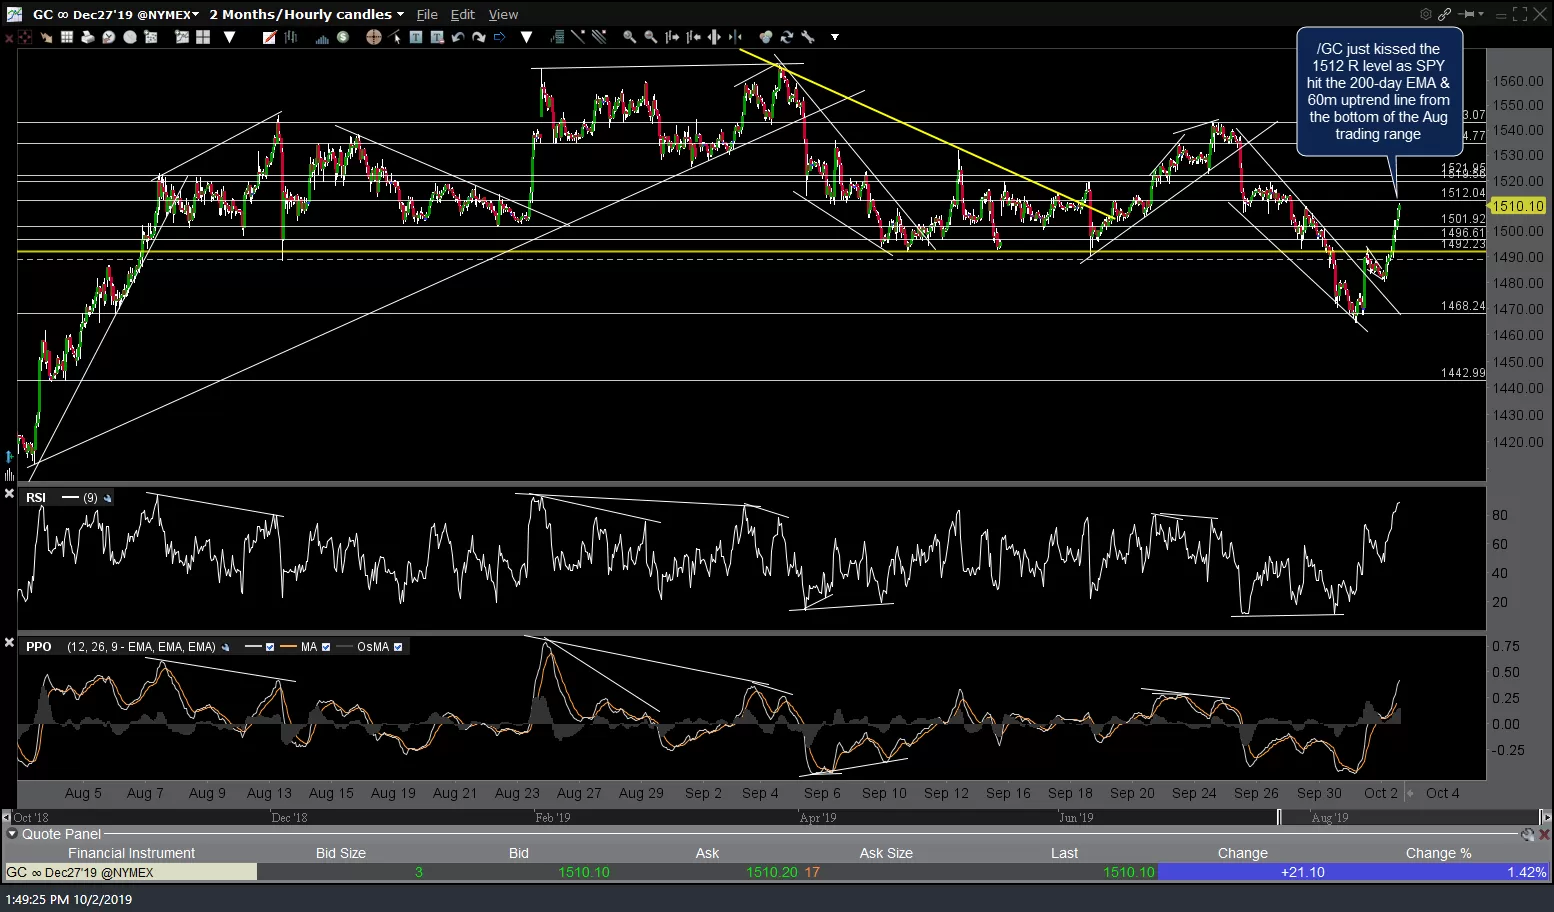
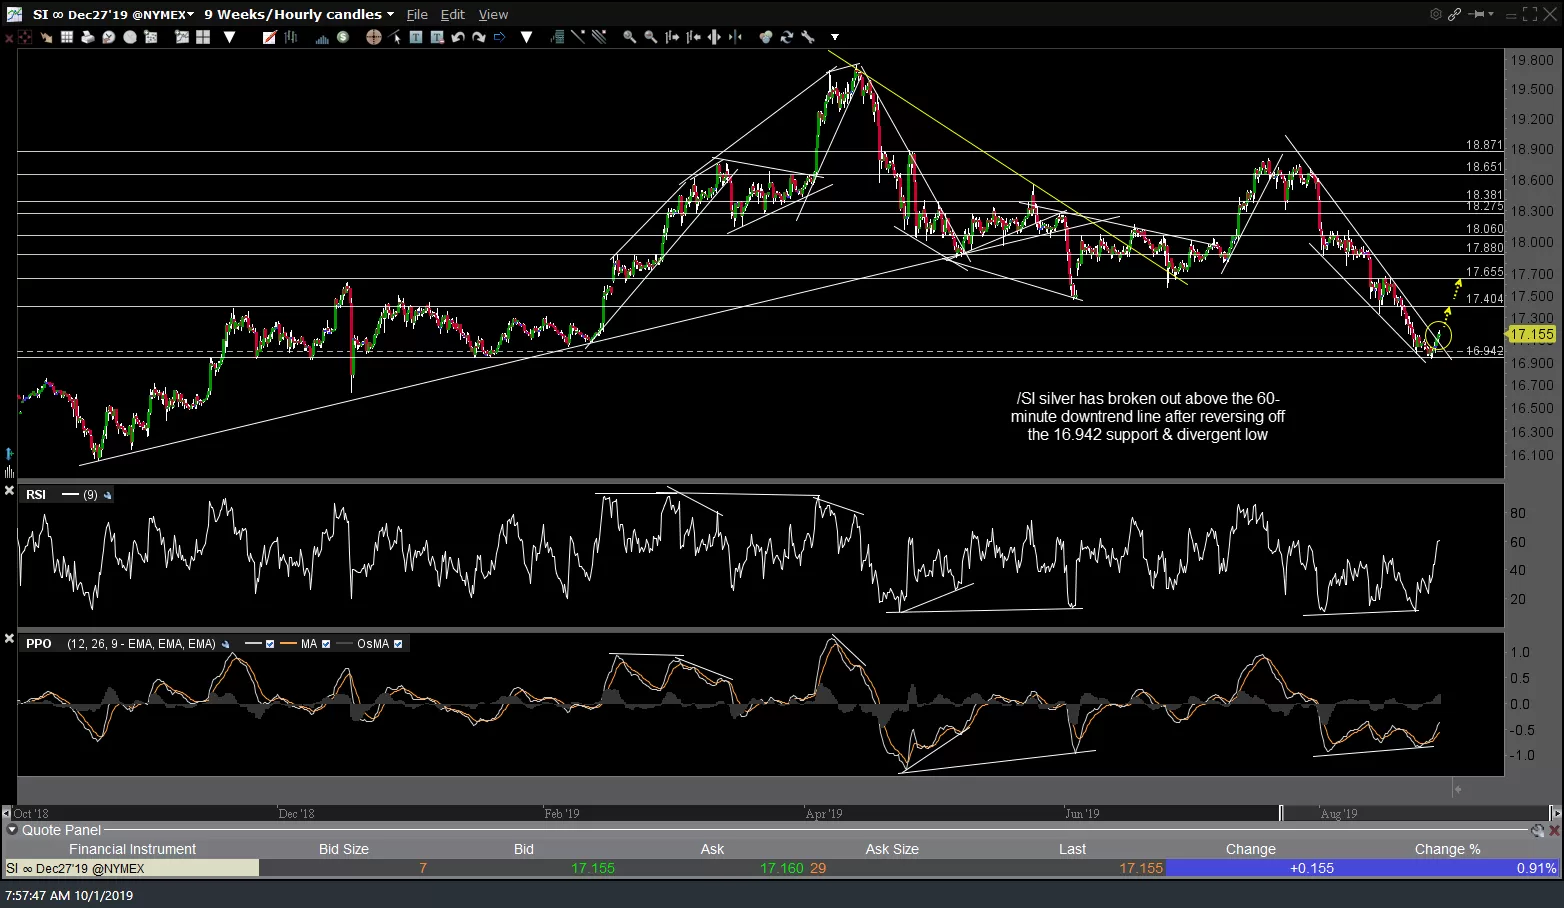
At the same time we have the indexes falling to those important 200-day EMA supports, we also have /GC gold rallying into the 1512resistance level as well as /SI hitting & crossing slightly above the 17.655 resistance level, which was highlighted as the 2nd price target early yesterday after reversing off the 16.942 support & while breaking out above the 60-minute downtrend line (2nd chart below).
-
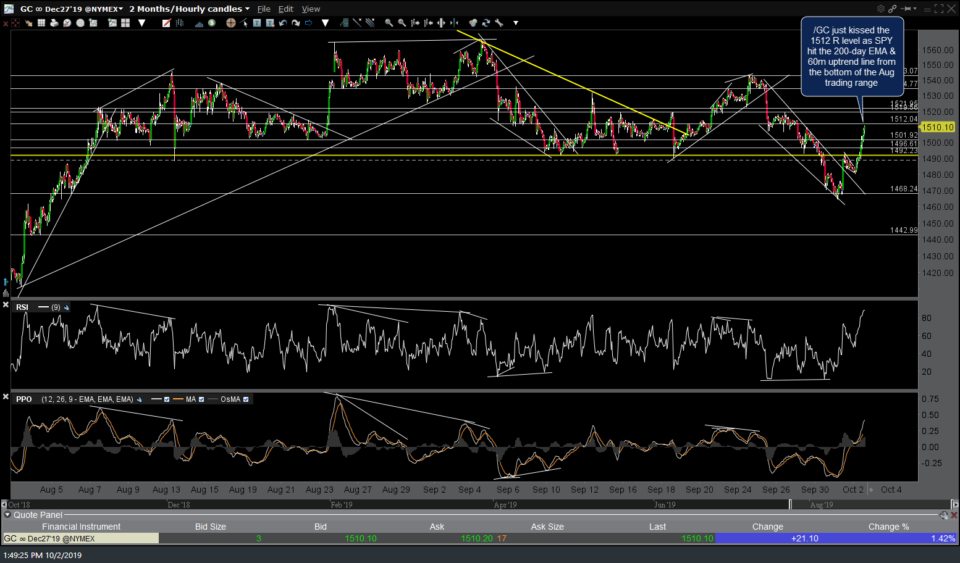
- GC 60m Oct 2nd
-

- SI 60m Oct 1st
-
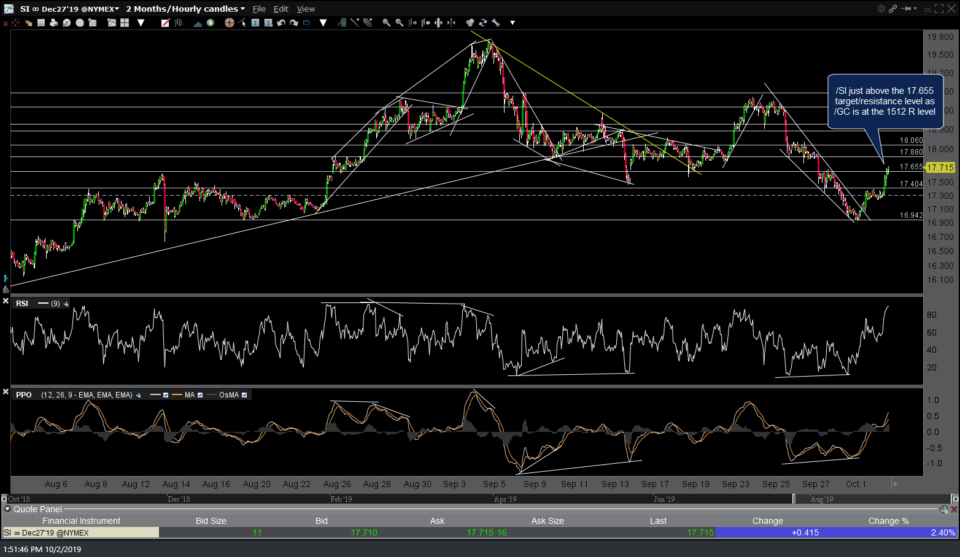
- SI 60m Oct 2nd

Bottom line: The odds for a bounce in the stock market & pullback in the precious metals are substantially elevated at this time so one might opt to either tighten stops on index shorts & gold/silver longs or book profits & wait for the next objective entry such as a bounce back to resistance or impulsive break below today’s lows on SPY & QQQ and/or pullbacks to support in gold & silver (ideally aligned the charts/levels on the stock indexes with those of the precious metals).