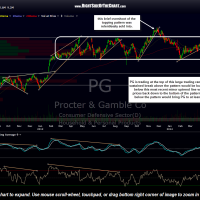
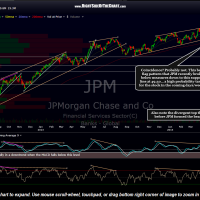
I often like to publish a technical overview of the top components of an index or sector that may be setting up for a nice move as analyzing the charts of the most heavily weighted components will often give you a heads up on where the index or sector may be heading. Normally I will use a video format as it allows me to discuss all the nuances of the chart as well covering charts of the same stocks on multiple time frames. Today I’ve decided to simply post one chart of each of the top 10 largest components of the S&P 500 index.
Although my primary focus has been on the Nasdaq 100 lately, I have been intrigued by the resiliency of the less tech-heavy S&P 500 and like most traders, I have been trying to discern if the $SPX will soon begin to play catch-up to the $NDX on the downside or vice versa. As I always strive to keep my analysis as straightforward and unambiguous as possible, I will state that my expectation at this time is that the $SPX is poised to start playing catch-up to the $NDX & $COMPQ by moving lower. Below are the charts of the top 10 components of the S&P 500 listed in descending order by their current weighting in the index. Although I can’t discuss all of the details of each stock on a single time frame static chart, I’ve tried to highlight the most salient technical developments of each of these market leading companies. Click on the first chart to expand & then click anywhere on the right-hand side of the chart to advance to the next chart.
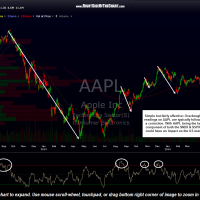
- AAPL daily May 8th
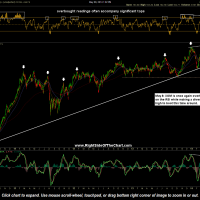
- XOM daily May 8th
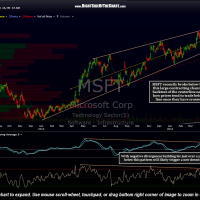
- MSFT daily May 8th
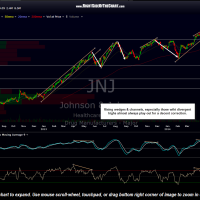
- JNJ daily Mau 8th
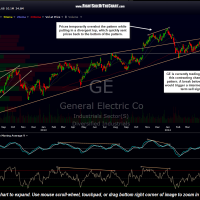
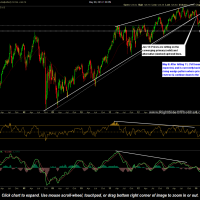
- GE daily May 8th
- CVX weekly May 8th
- WFC daily May 8th
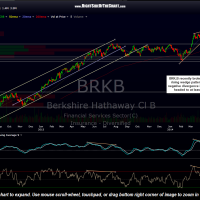
- BRK.B daily May 8th
- PG daily May 8th
- JPM daily May 8th


