
Looking like at least a near-term blow-off top in gold with a correction back to the uptrend line likely following the next sell signal with GLD (gold ETF) trading slightly above long-term resistance on what will likely prove to be a momentum-fueled overshoot.
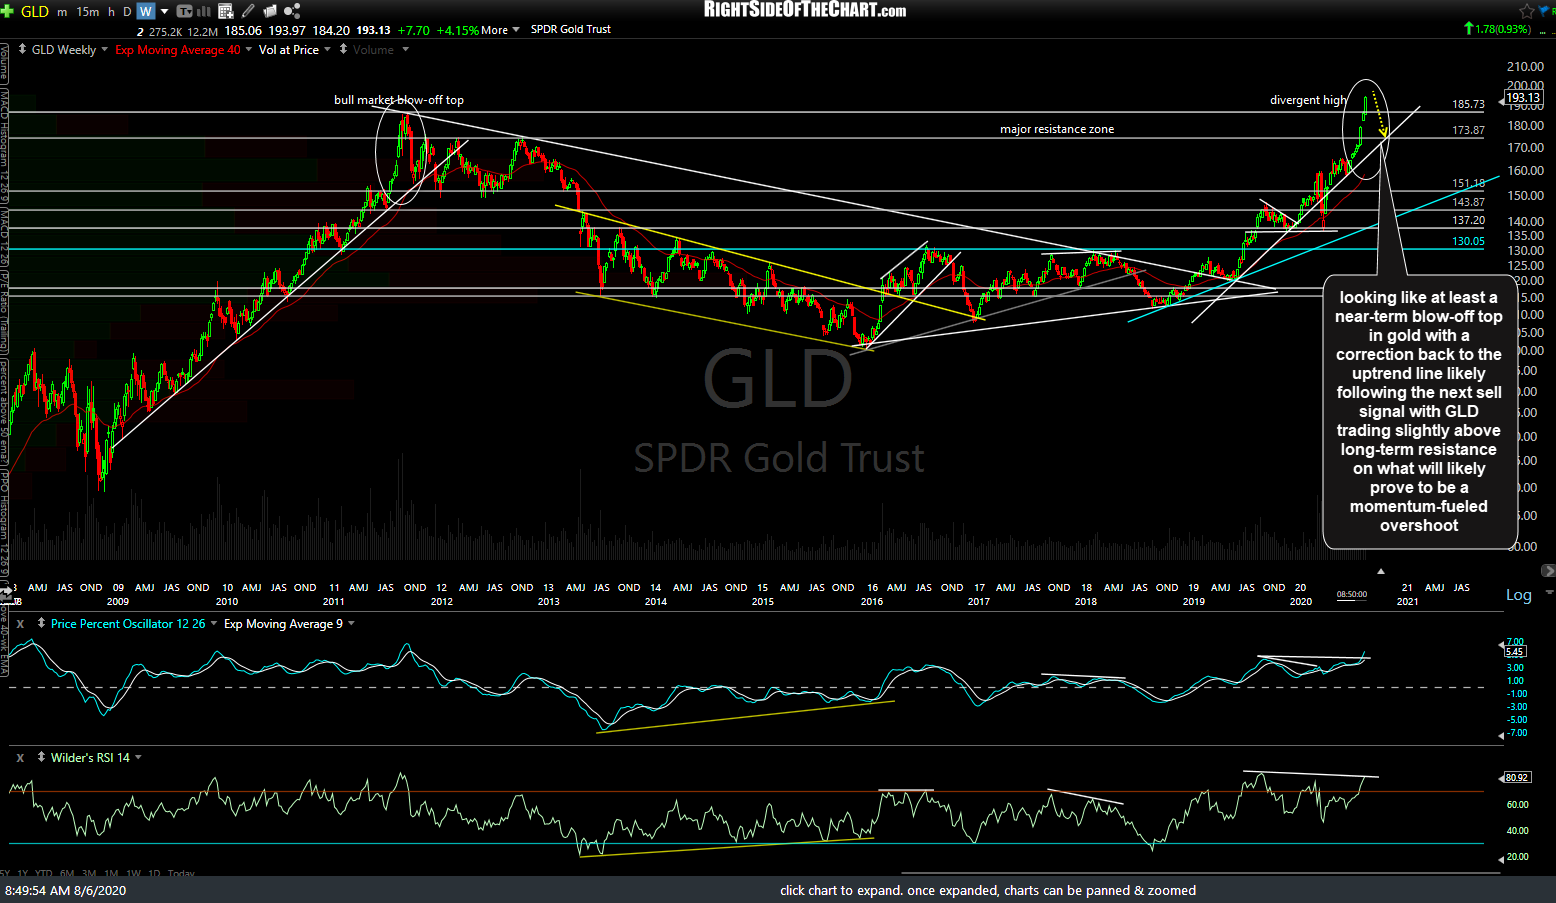
GLD weekly Aug 6th
A sell signal on gold could come in various ways, including but not limited to a break below these uptrend lines and/or the 1997 support on this 60-minute chart of /GC (gold futures).
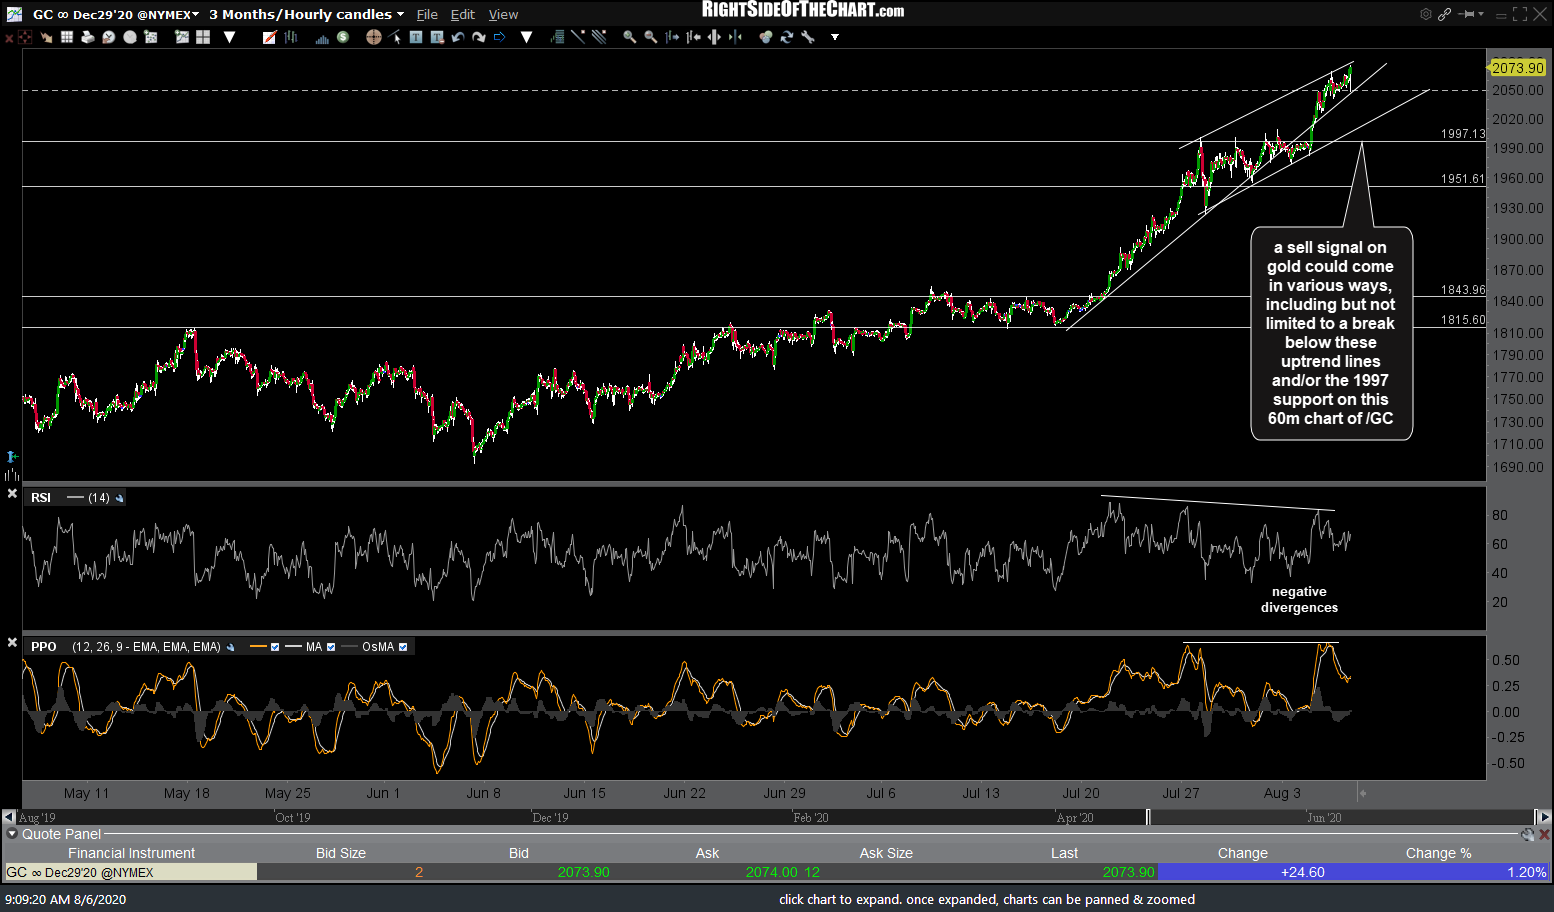
GC 60m Aug 6th
SLV (silver ETF) has rallied into long-term resistance while at rarely seen nose-bleed overbought levels on the weekly RSI.
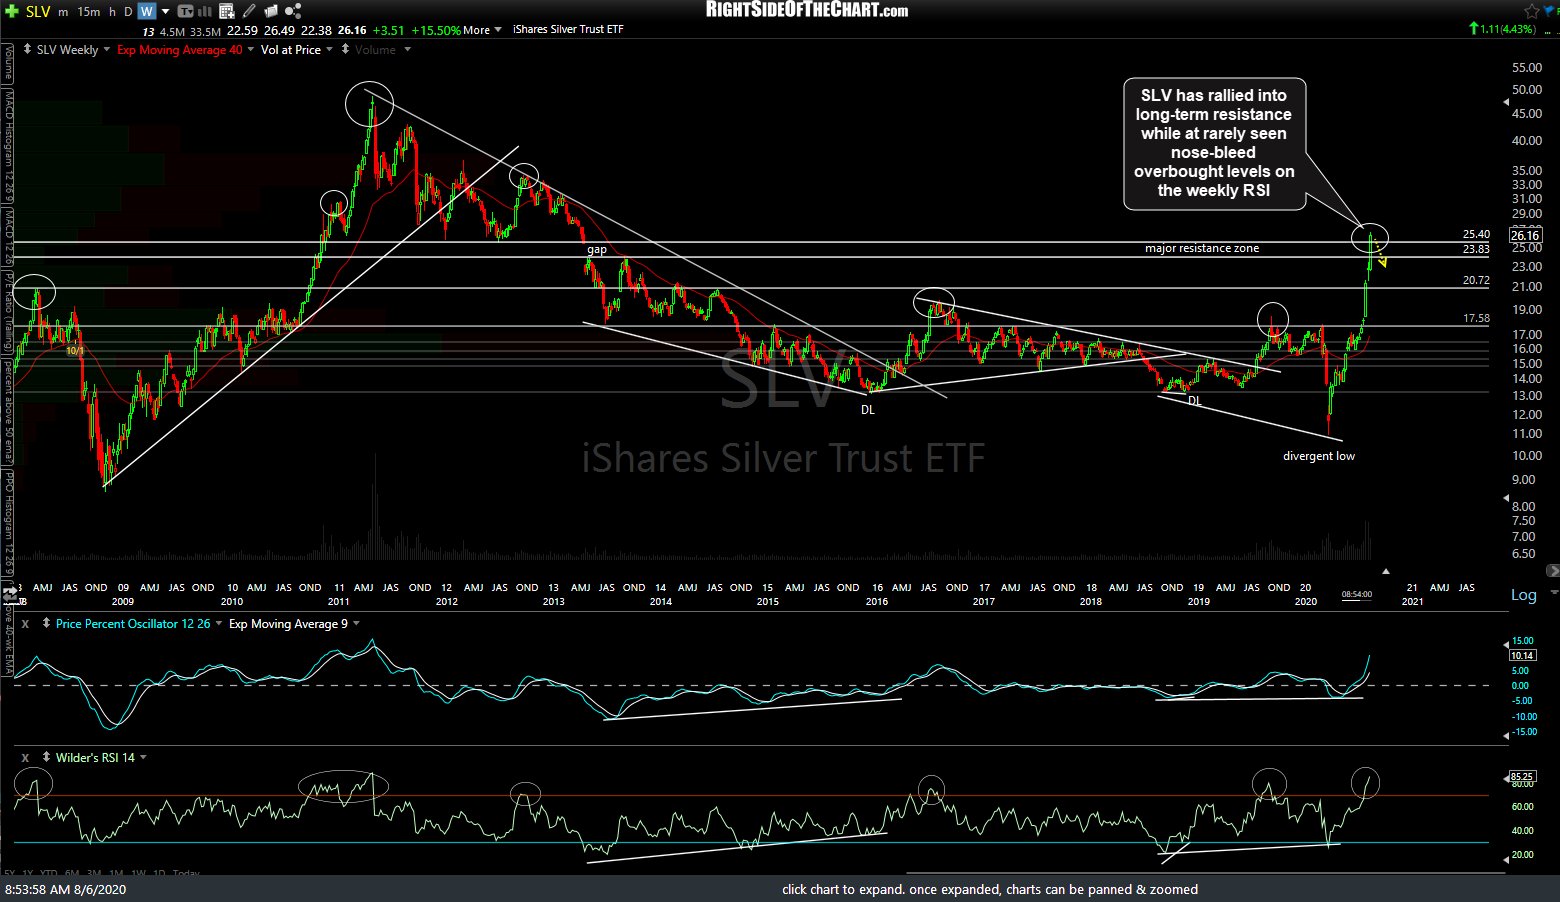
SLV weekly Aug 6th
While this initial tag of the 26 long-term resistance level on /SI provided an objective entry for a short trade that was good for a very quick 15% drop/profit last week, the same divergences that were in place at that high have only grown much larger on this marginal new high, setting the stage for an even larger drop with a sell signal to come on a break below the current uptrend line. 60-minute chart of /SI, silver futures, below.
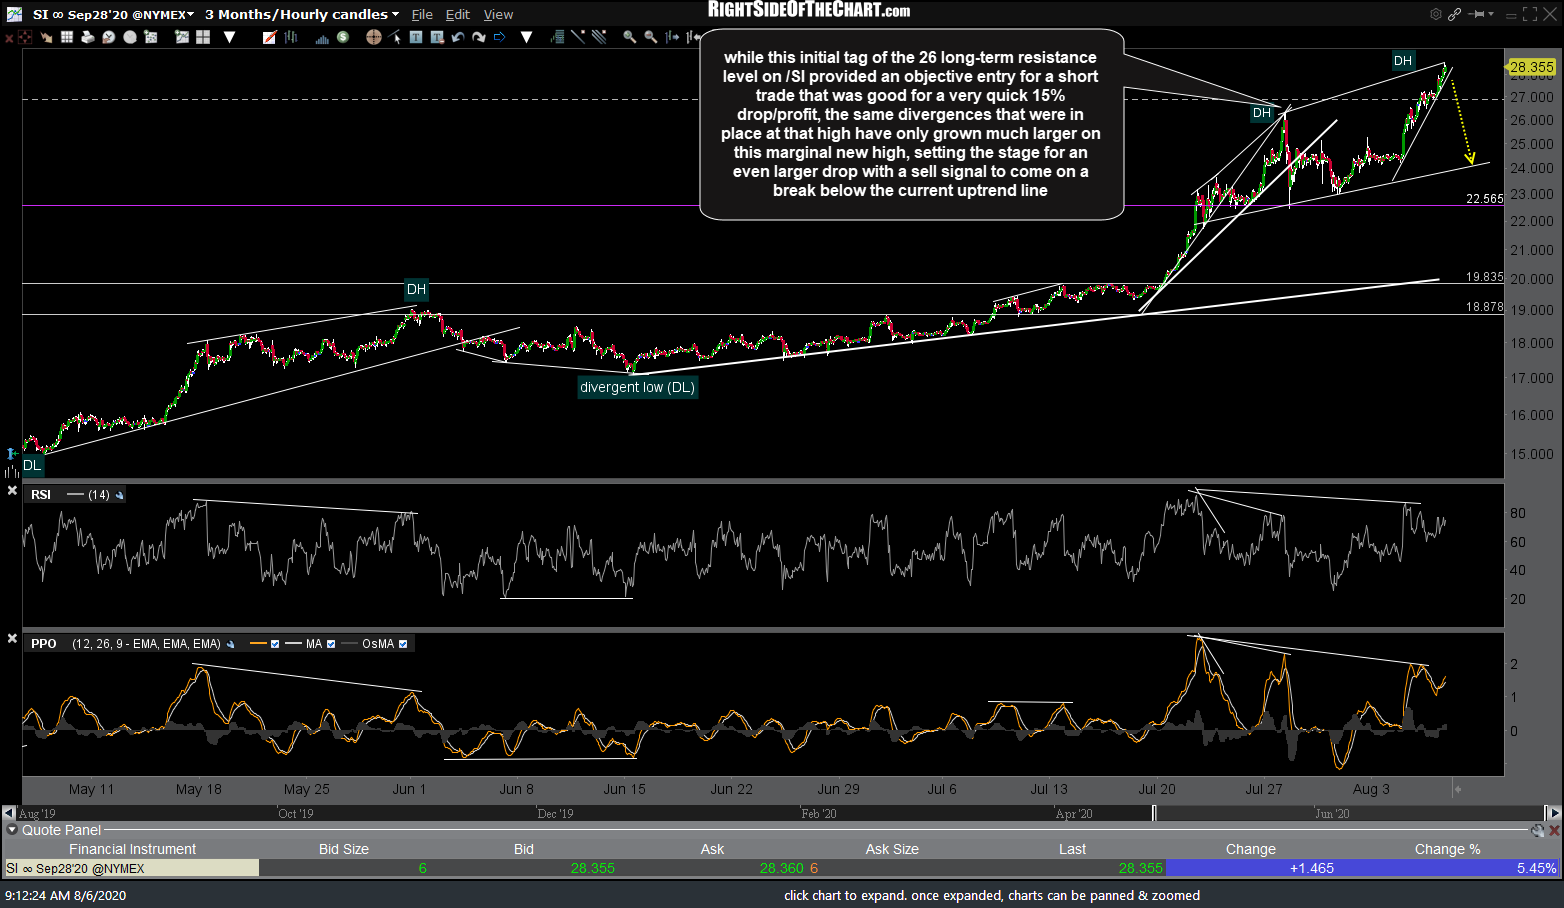
SI 60m Aug 6th
The impact of the US Dollar on the price of gold can be seen clearly when overlaying EUR/USD with GLD.

GLD vs EUR-USD weekly Aug 6th
EUR/USD has rallied into this long-term downtrend line (resistance) where a reaction is likely before a lasting breakout.
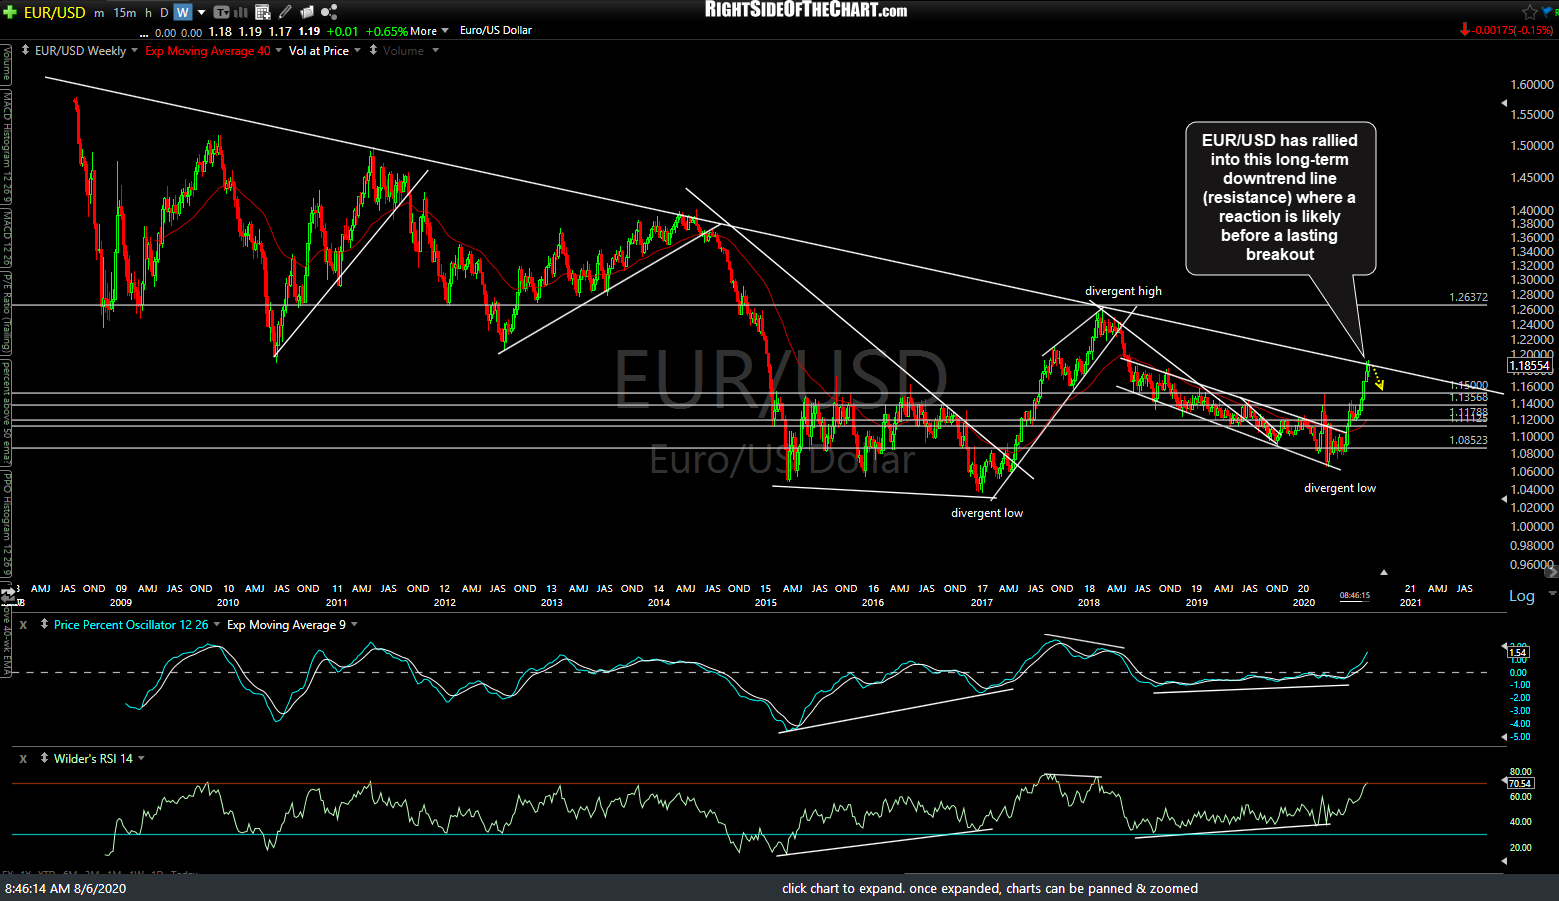
EUR-USD weekly Aug 6th
I remain longer-term bearish on the US Dollar/bullish on the Euro while near-term bullish on the Dollar, as the odds for an oversold bounce/rally off support. The charts below are long-term (20+ yr) weekly charts of $USD (US Dollar Index), with the previously posted charts from June 2nd & July 21st, calling for a move down to this level (now hit) with a reaction followed by another leg down to the 88.60ish level.
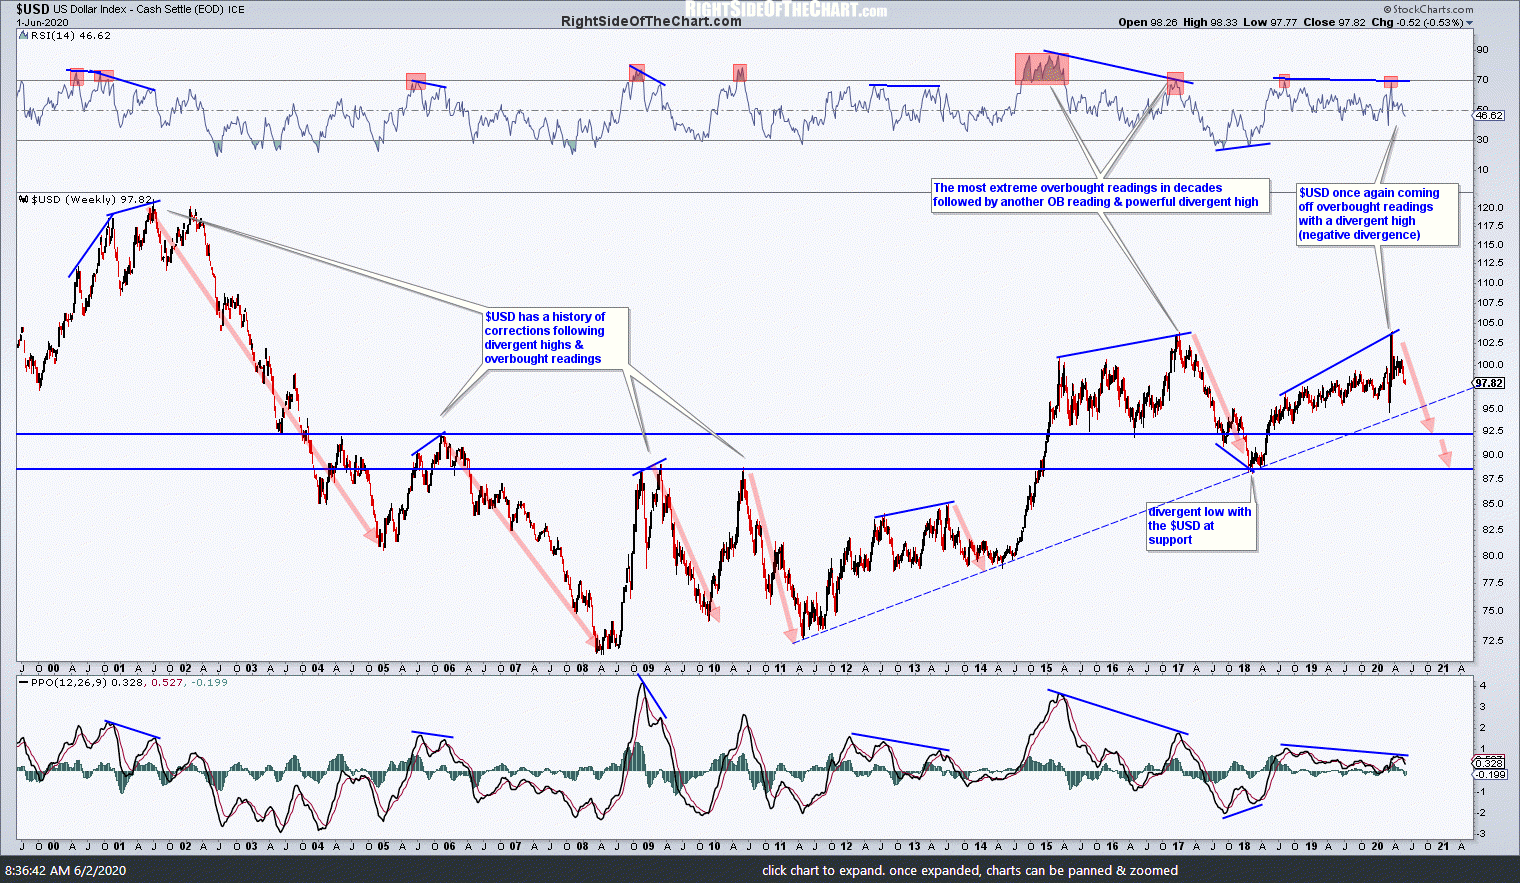
USD weekly June 2nd
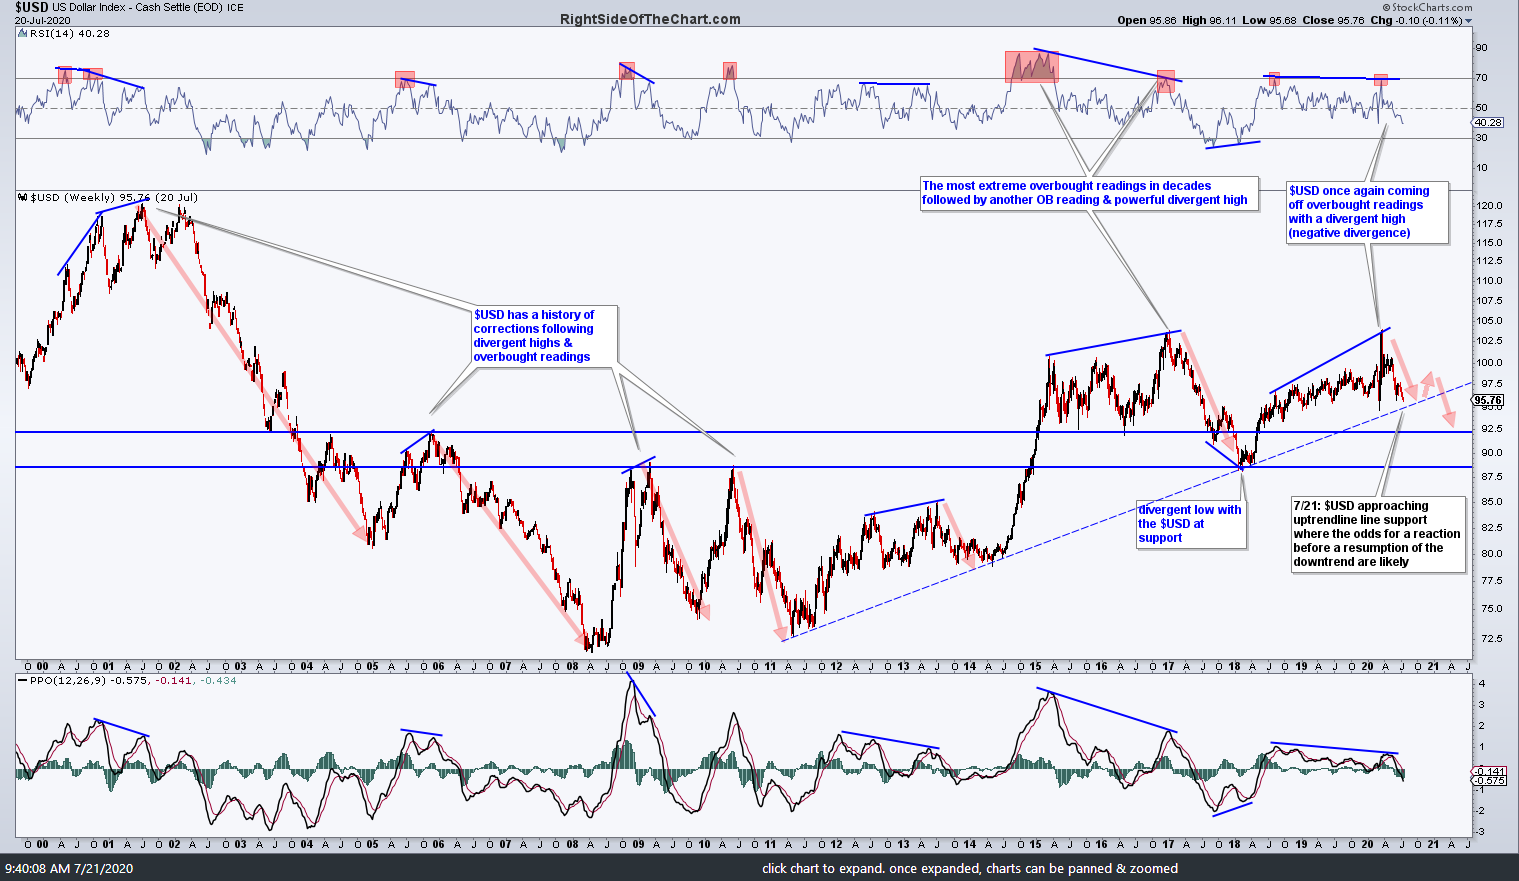
$USD weekly July 21st
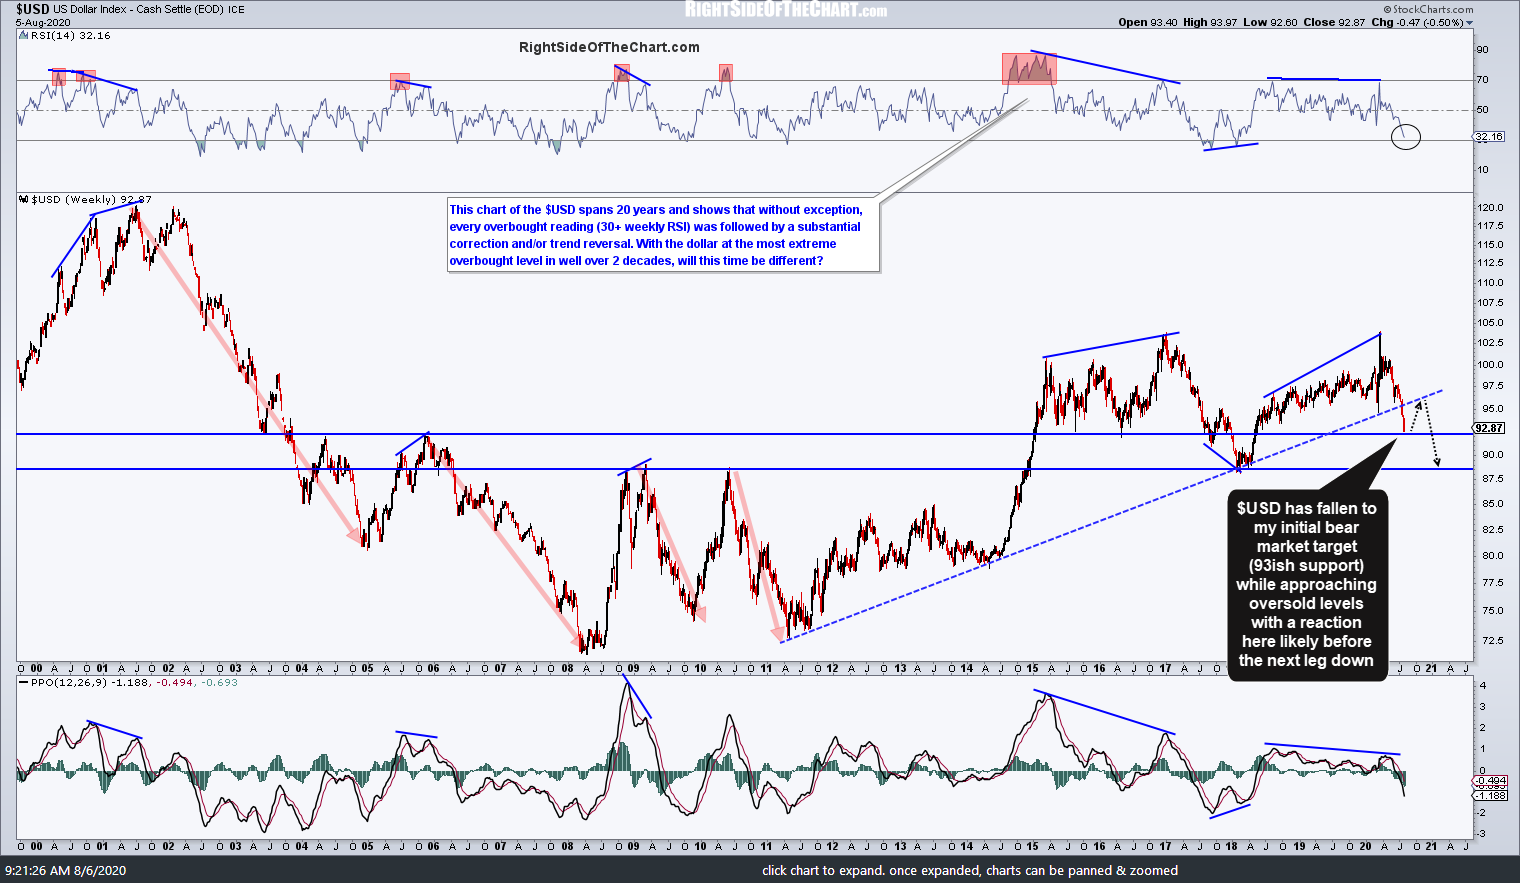
USD weekly Aug 6th