As an update to the recent SOXL (3x long semiconductor etf) short trade, I wanted to reiterate that the official stop remains any move above 31.00 and that it still appears to me that the semiconductor sector is poised for the next major leg down. The first chart below is the SMH (Market Vectors Semiconductor ETF) 10-year weekly. While this last minute end-of-week stick save to close (most likely) back above the primary uptrend line is certainly bullish on face value, my best guess is that it will prove to be a bull trap with prices immediately reversing & closing back below by the end of next week.
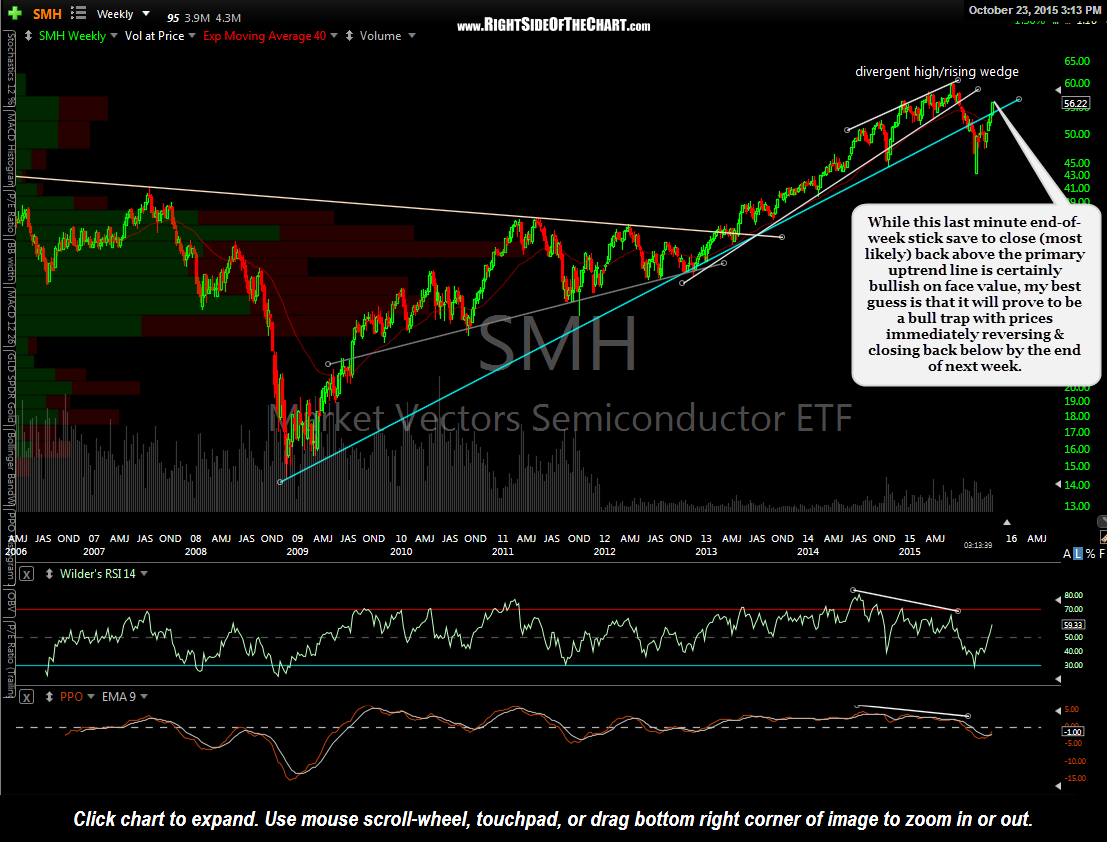
SMH weekly Oct 23rd
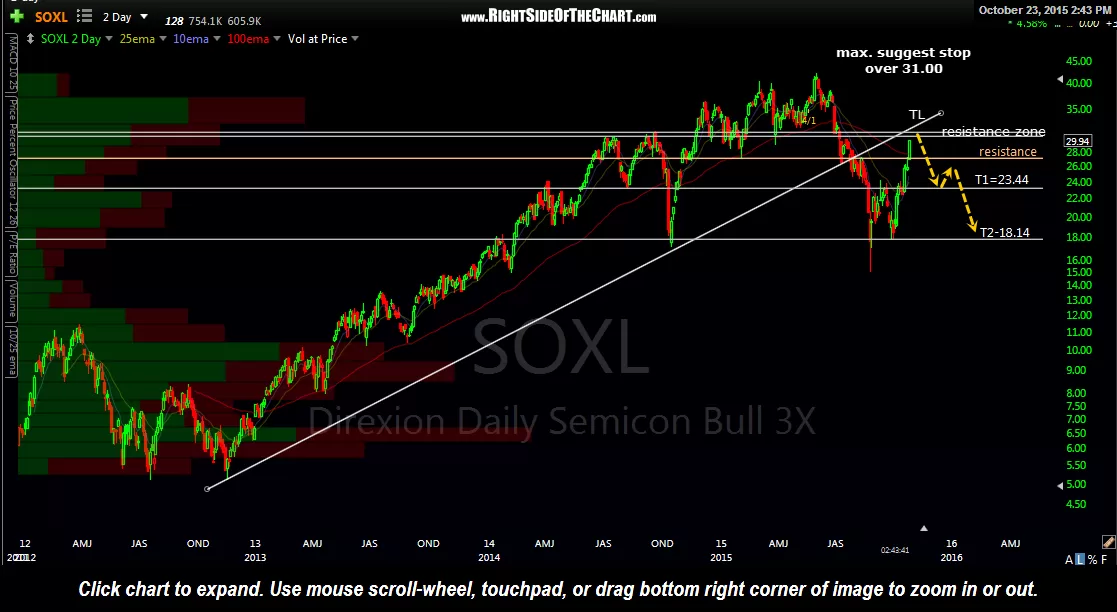
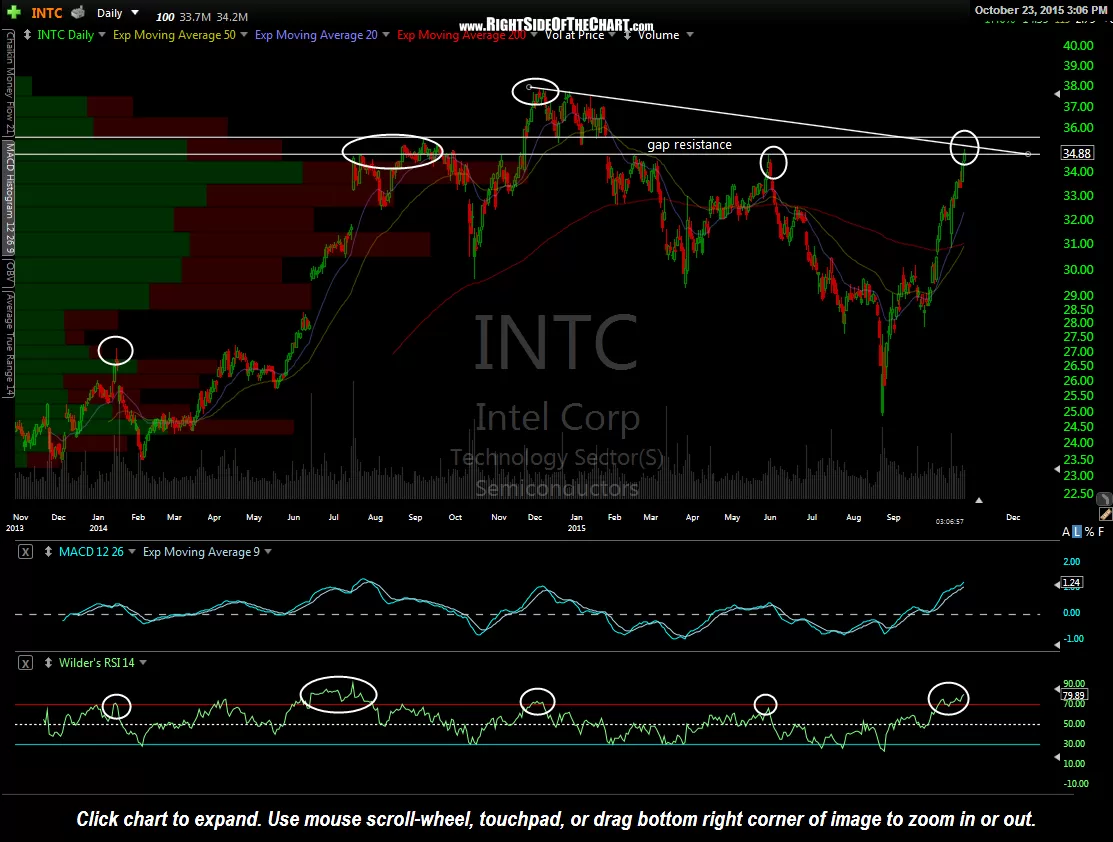
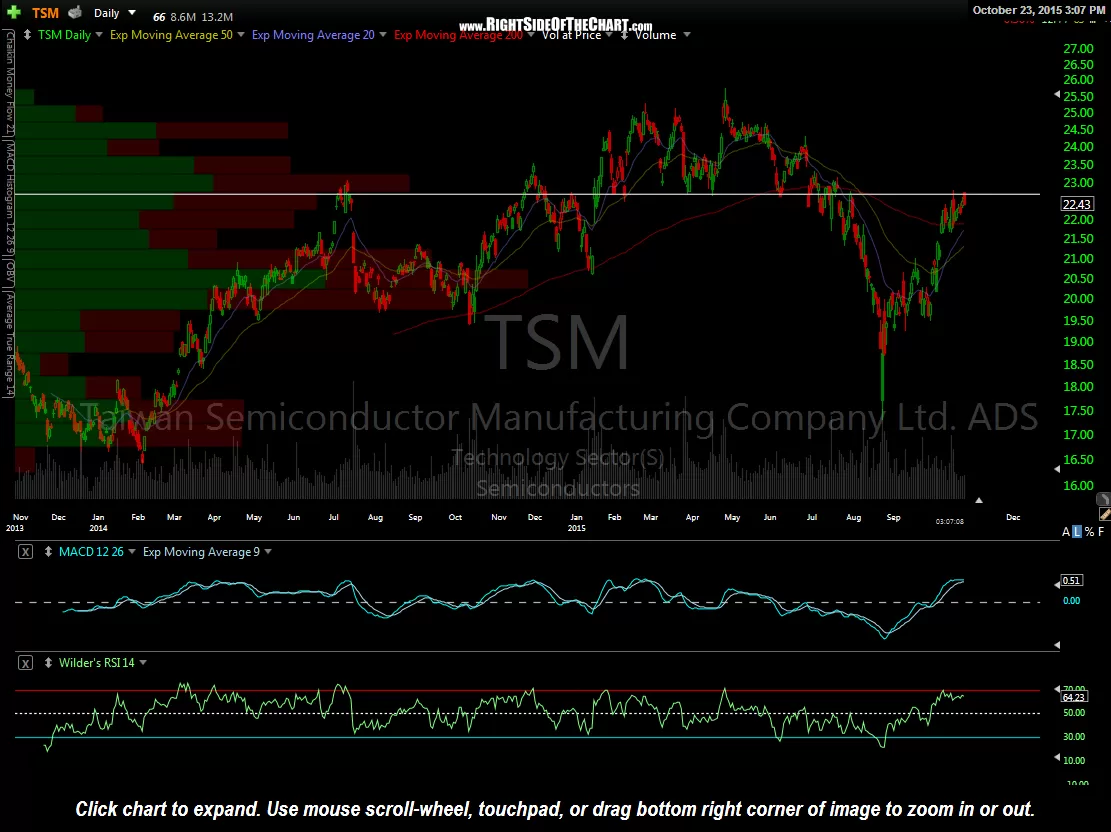
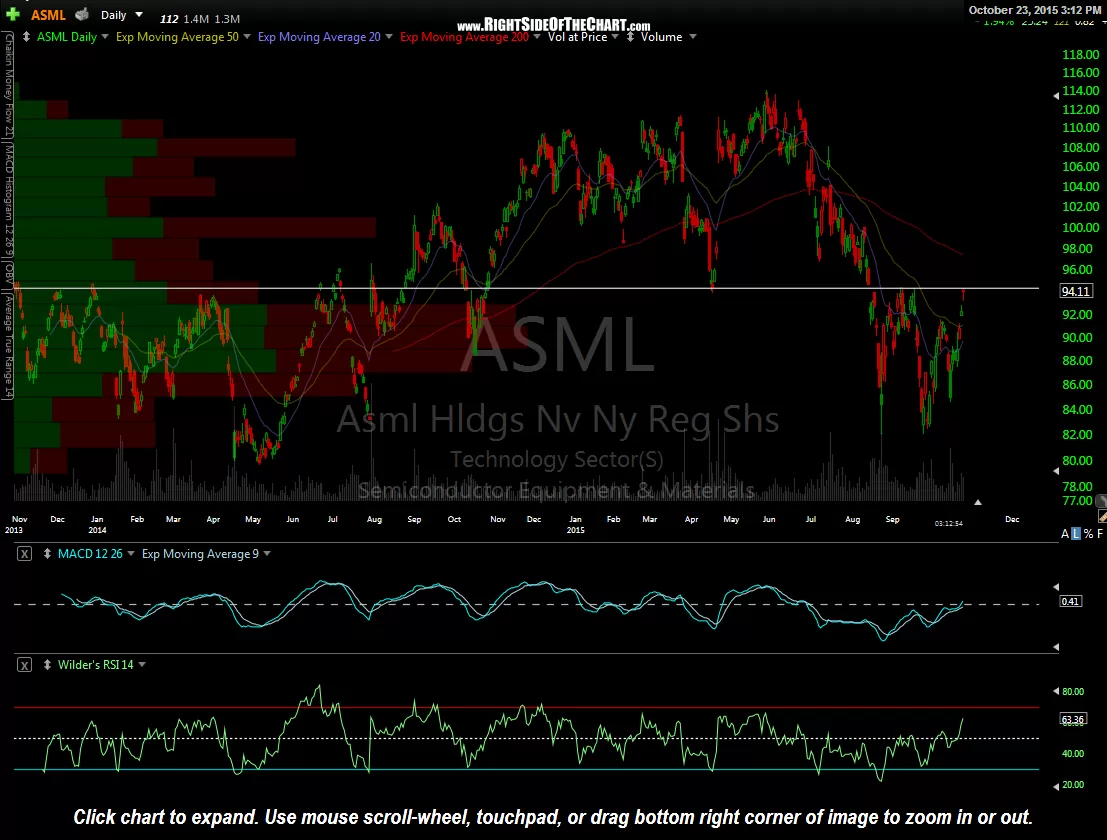
The following charts are the 4-year, 2-day period chart of SOXL, showing prices very close to backtest both a horizontal support zone as well as the primary uptrend line off the late 2012 lows (both key resistance levels), followed by the daily chart of the 6 largest (by market cap) components of SMH (i.e.- the largest semiconductor stocks), all of which are at or very near key resistance levels. Those stocks are listed in descending order by market cap with the industry leader, INTC, first.
-
- SOXL 2-day Oct 23rd
-
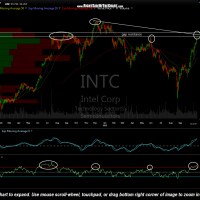
- INTC daily Aug 23rd
-
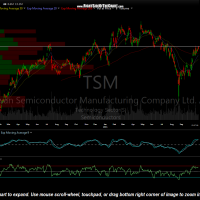
- TSM daily Oct 23rd
-

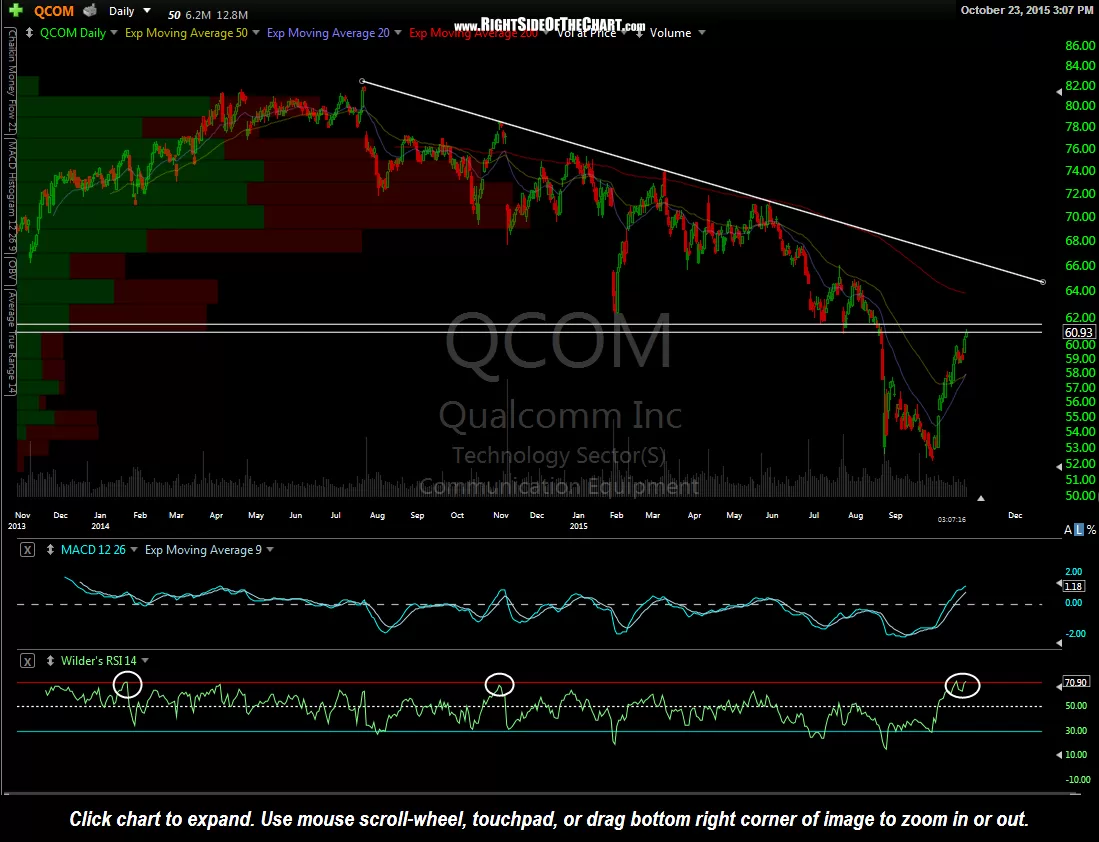
- QCOM daily Oct 23rd
-
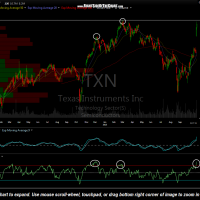
- TXN daily Oct 23rd
-
- ASML daily Oct23rd
-
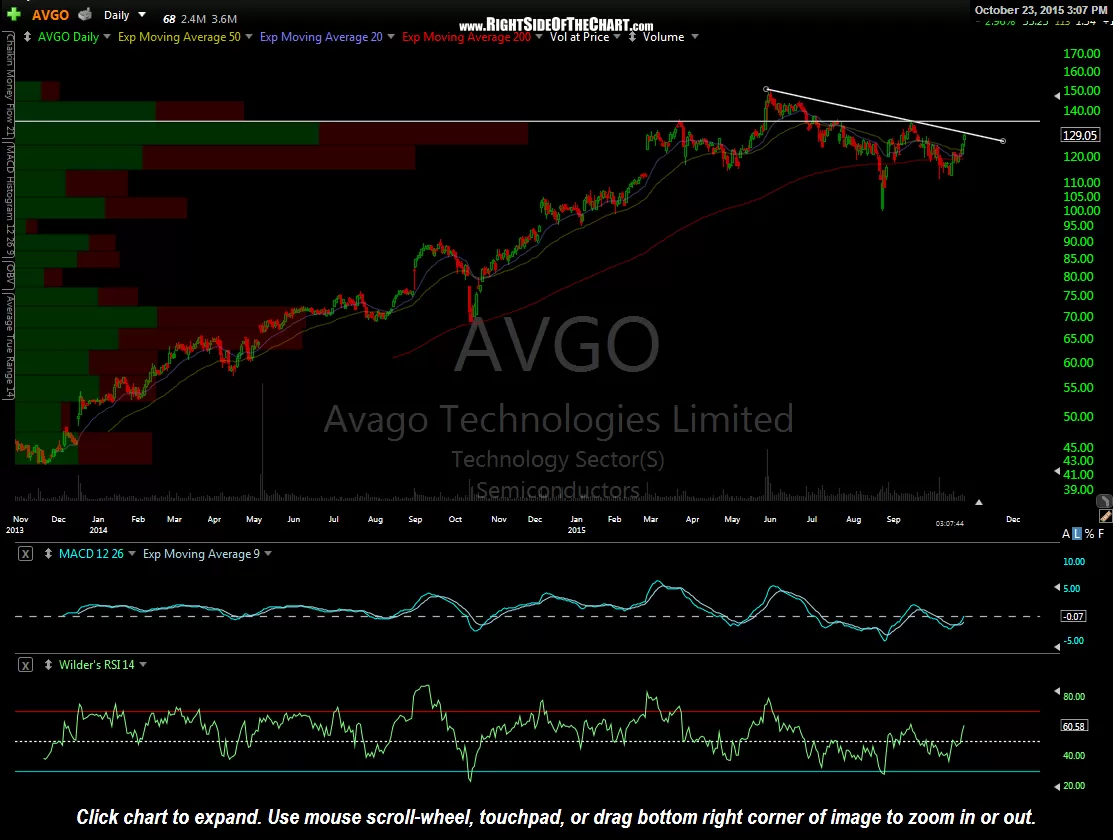
- AVGO daily Oct 23rd