
The following are 60-minute charts of QQQ & the “Magnificent 7” (top-heavy holdings of QQQ). A solid break below 404 should open the door for the next leg down to T2 on QQQ while any marginal new high soon would extend the existing negative divergences, thereby not changing the technical posture.
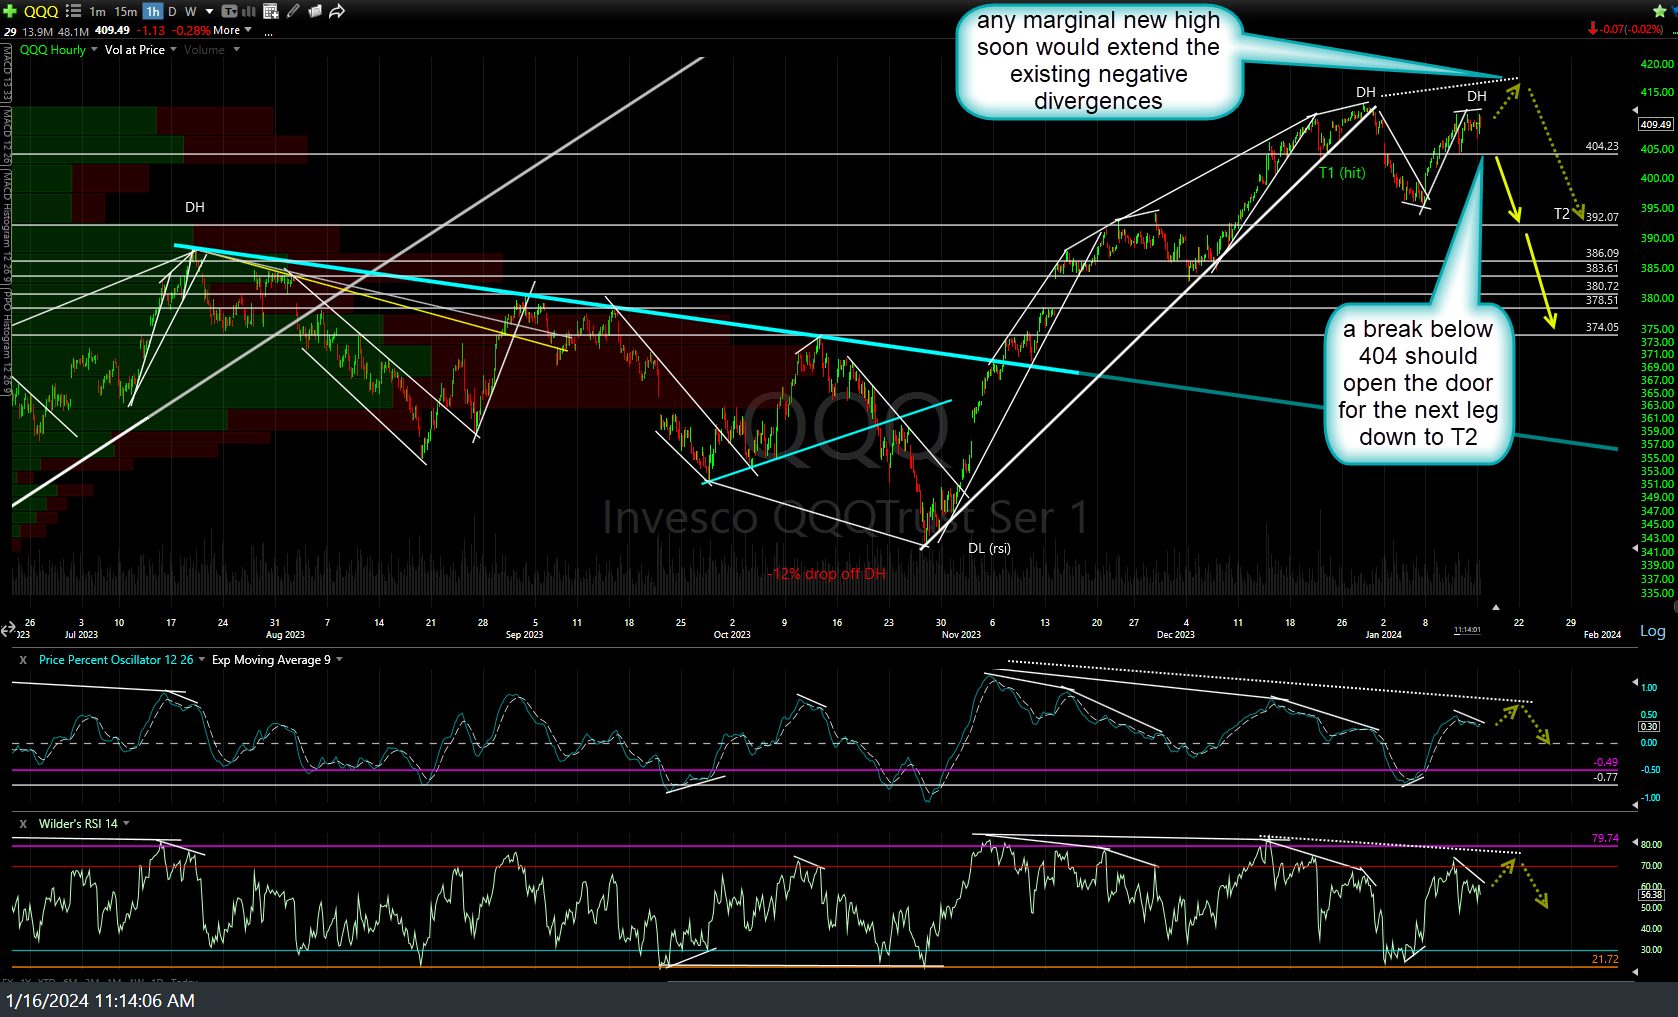
QQQ 60m Jan 16th
A break below the recent lows would offer an objective short on AAPL as would another push back up to T1 (which was already hit) and/or T2 from the recent long bounce trade.
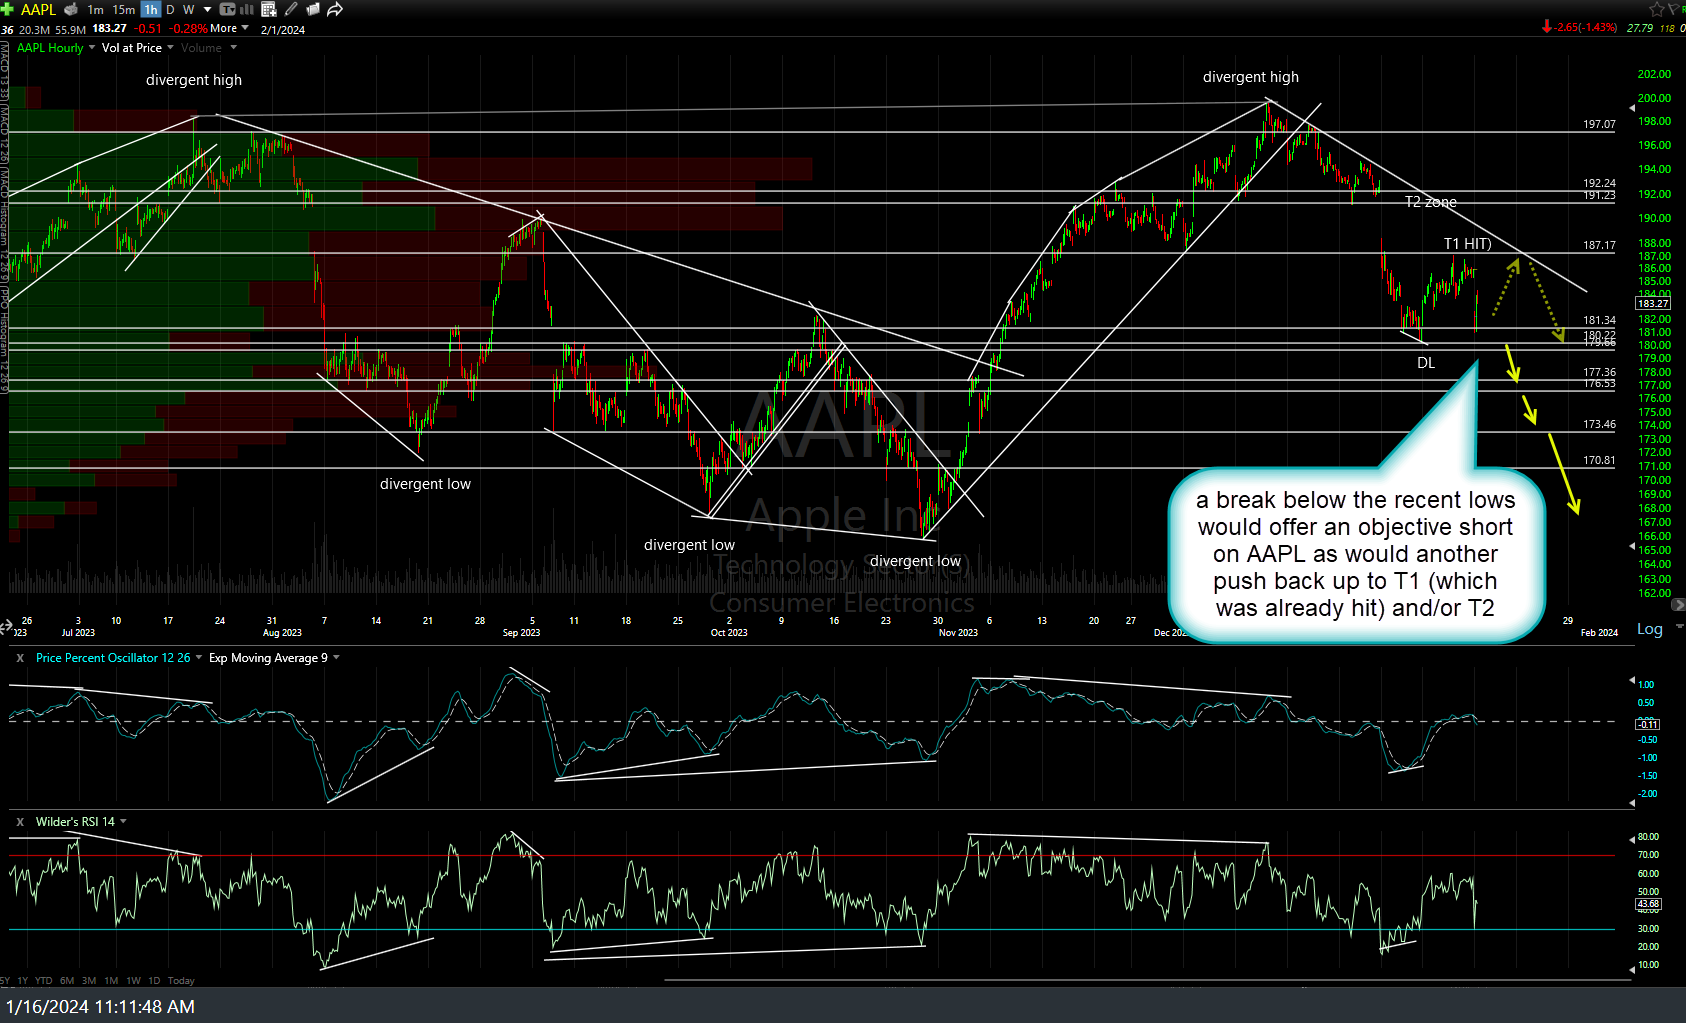
AAPL 60m Jan 16th
MSFT sell signal to come on a break below this minor uptrend line as well as 377, ideally with the current negative divergences still intact at the time.
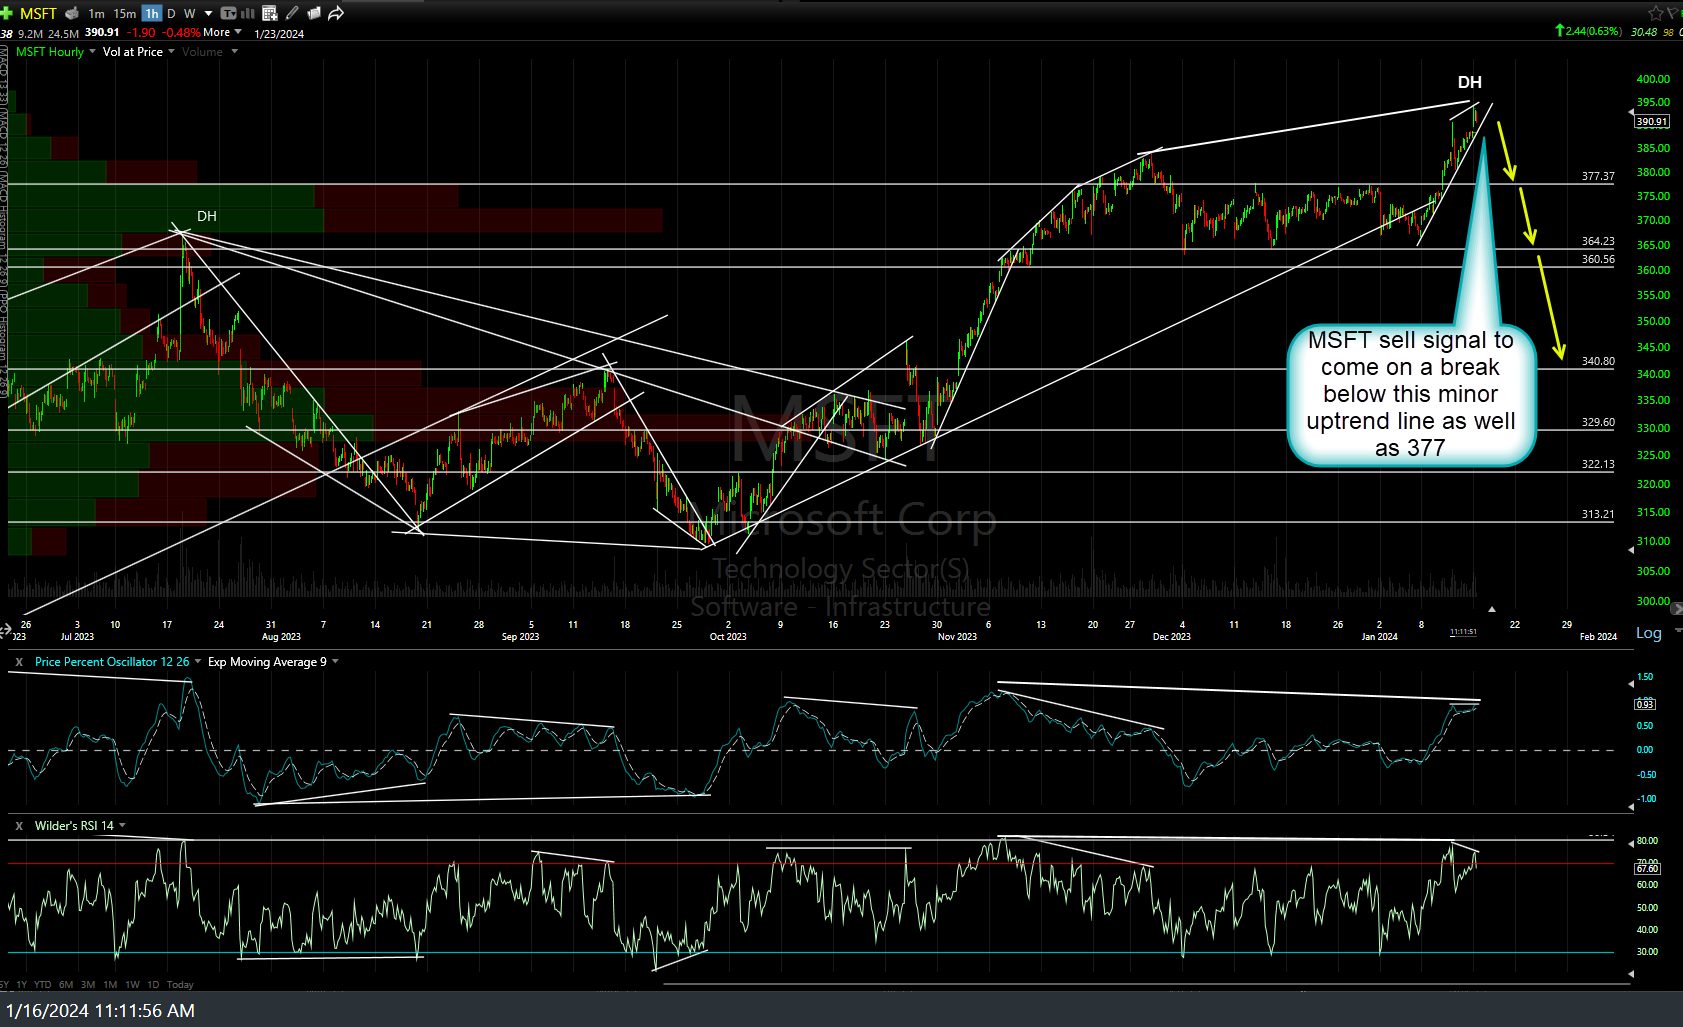
MSFT 60m Jan 16th
GOOGL will offer objective short entries on breaks below the 141.70ish & uptrend line supports, ideally with the existing negative divergences still intact.
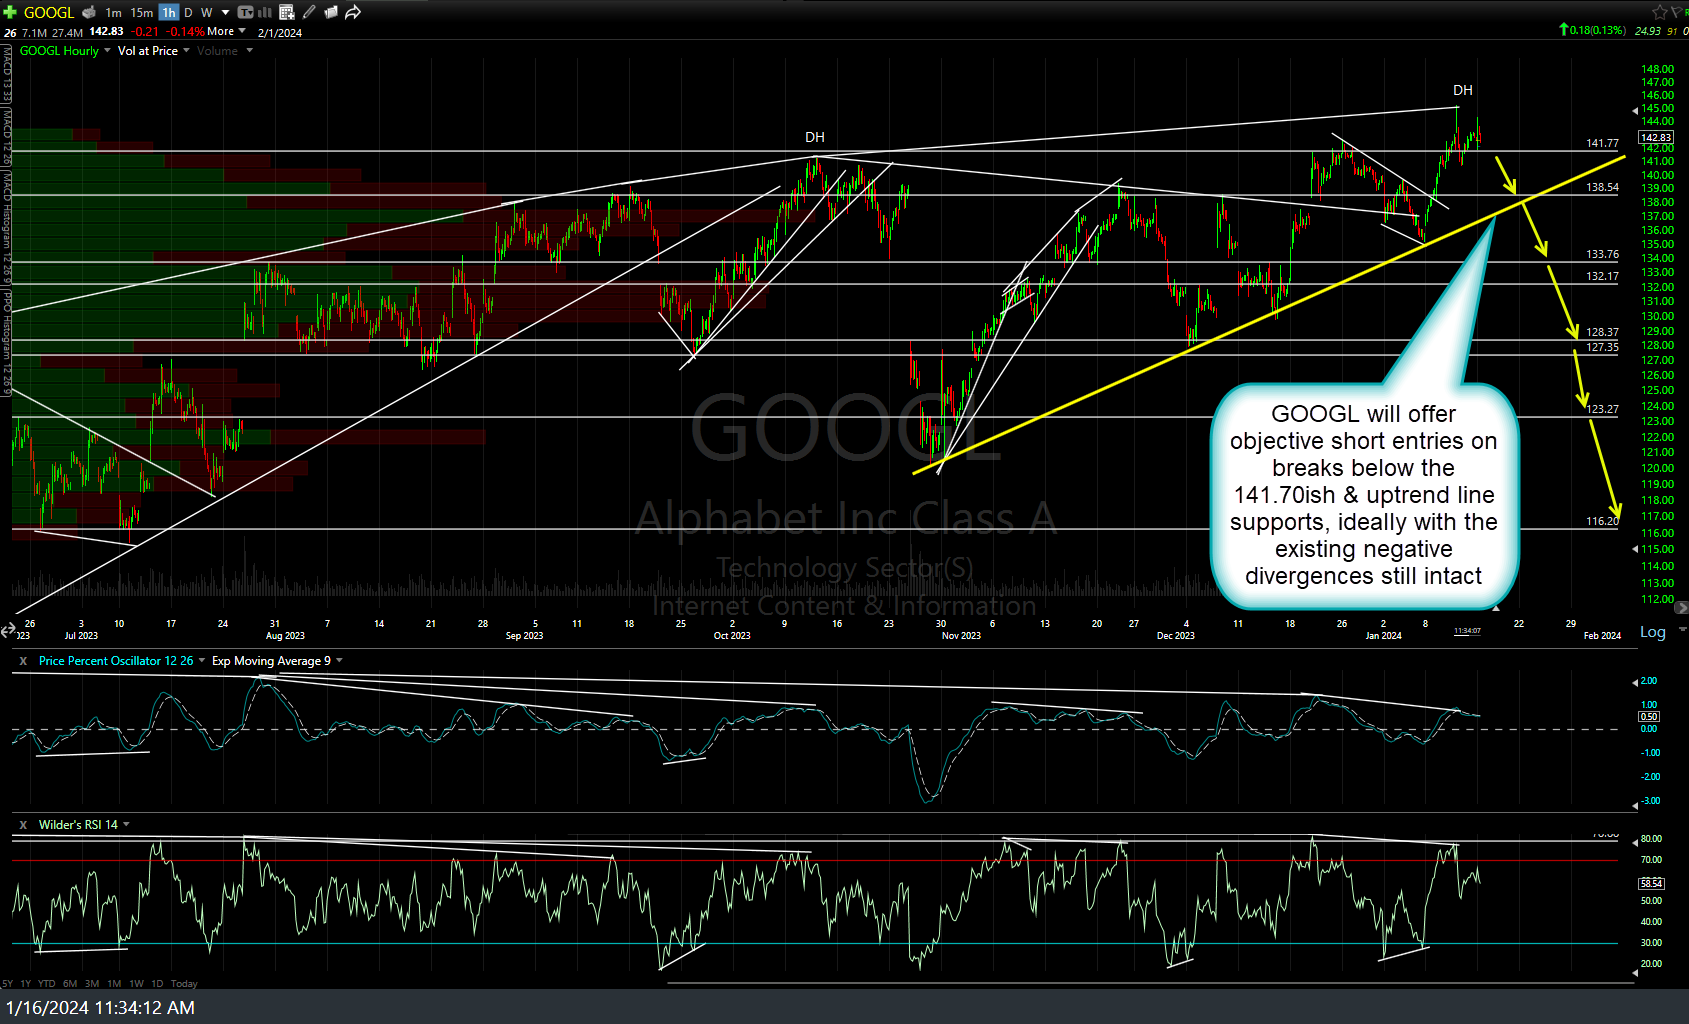
GOOGL 60m Jan 16th
The next sell signal(s) on AMZN to come on breaks below 152.75 & 149.
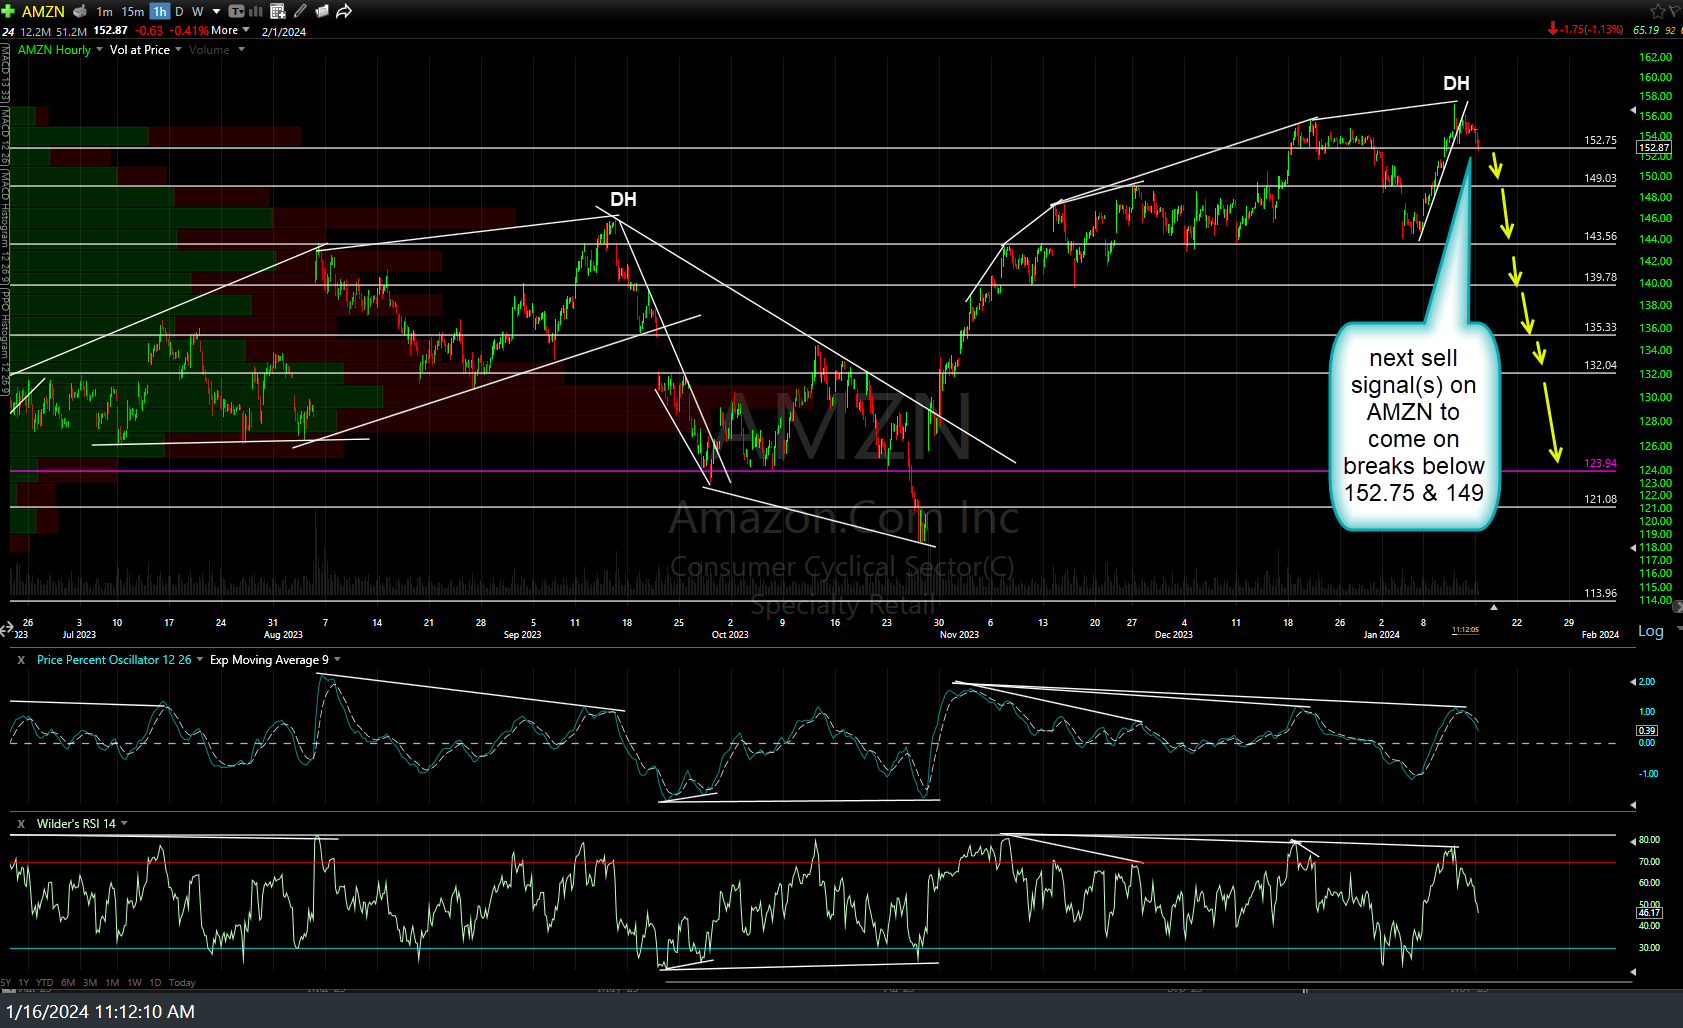
AMZN 60m Jan 16th
The first sell signal on NVDA would come on a solid break below this steep rising wedge pattern & potential buying climax (best viewed on daily chart).
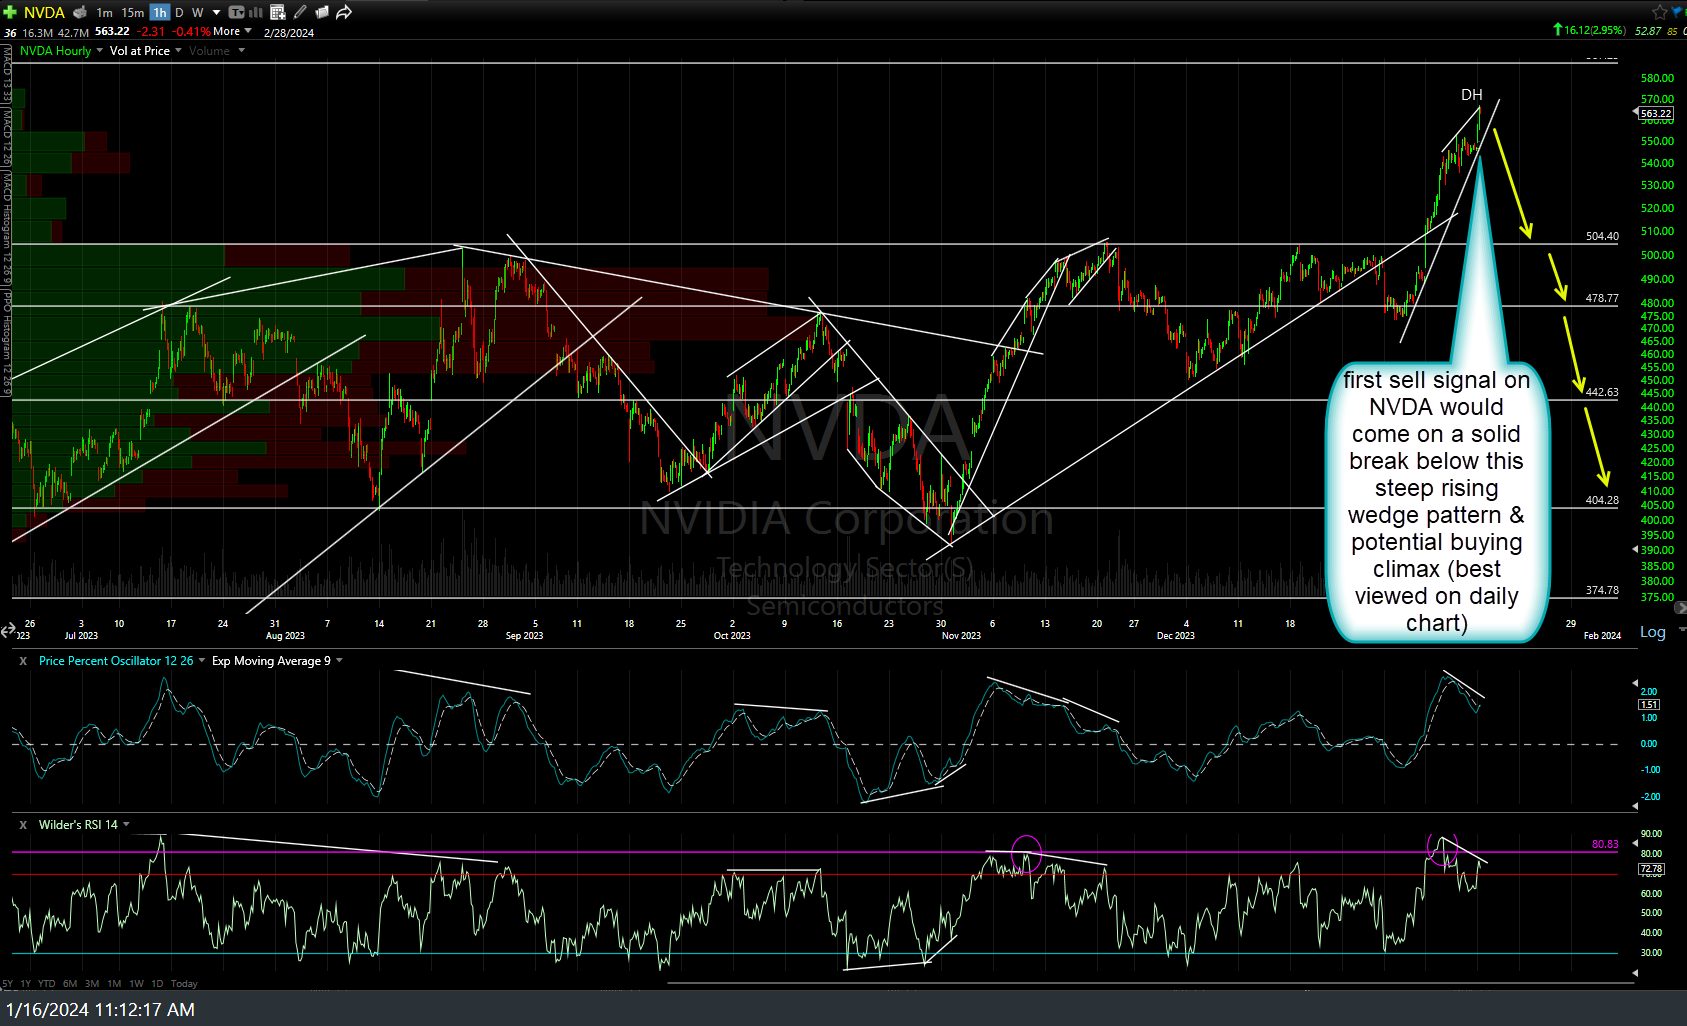
NVDA 60m Jan 16th
META will offer objective short entries on breaks below each of these 3 support levels (uptrend lines & 342ish support).
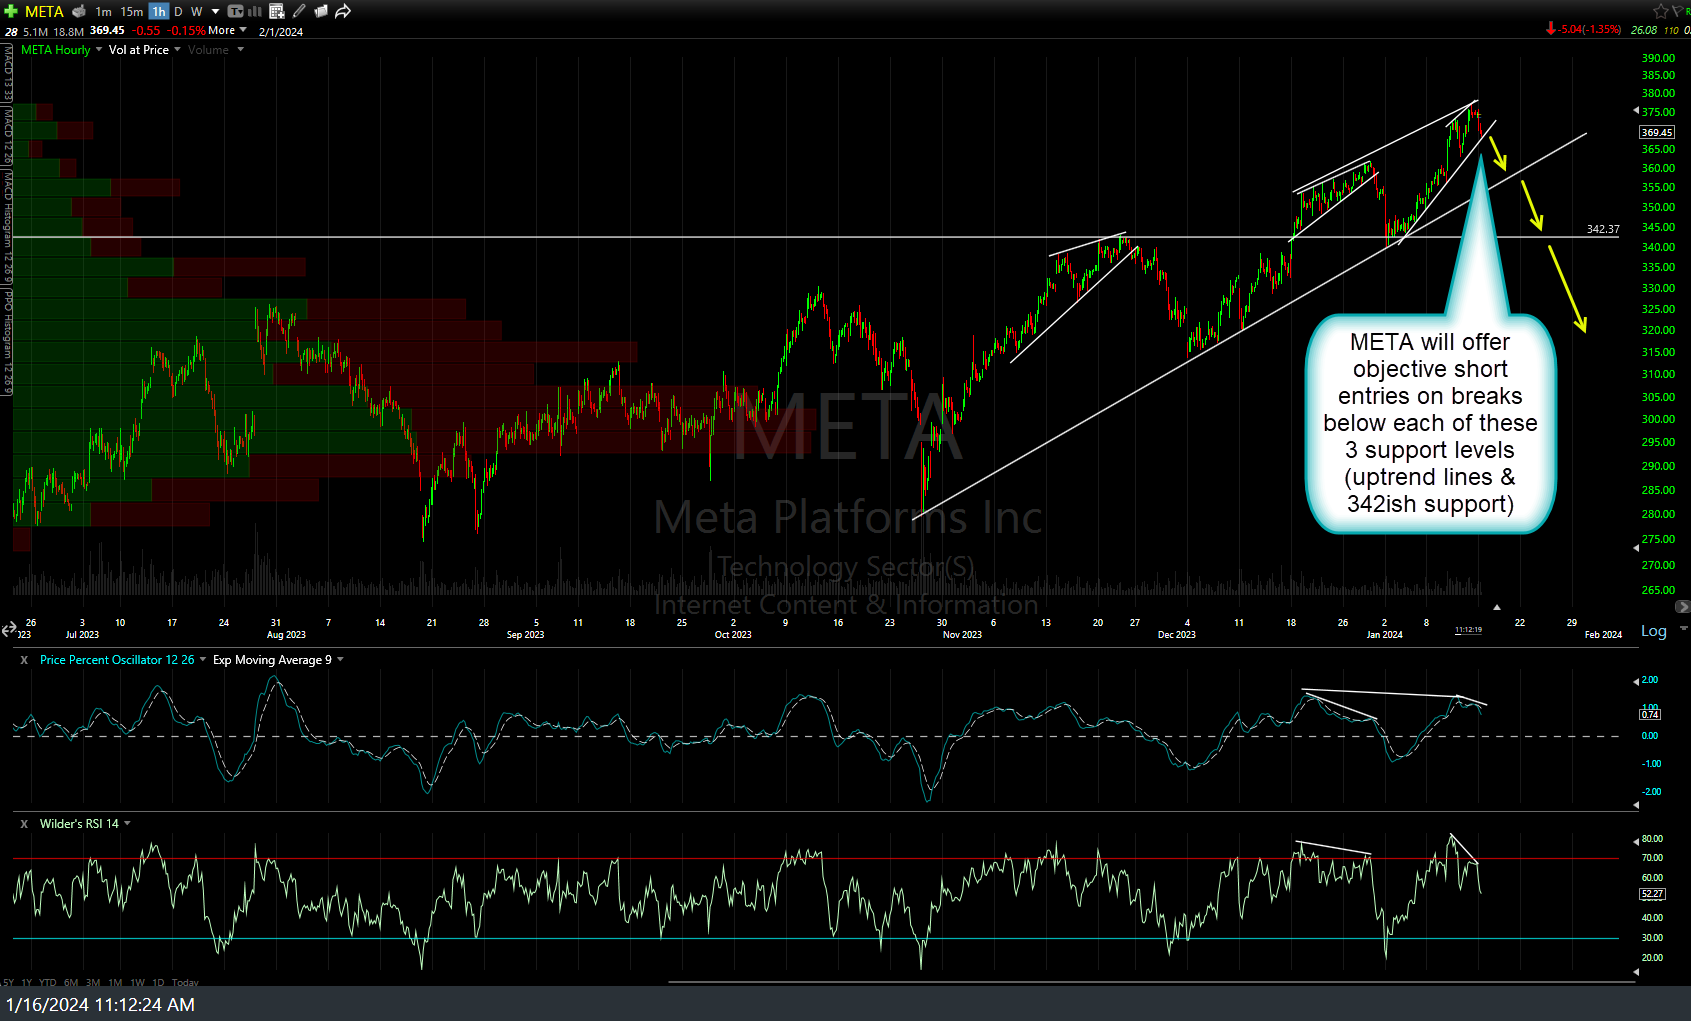
META 60m Jan 16th
I don’t have much of a read on the near-term direction for TSLA although the intermediate & longer-term outlook still appears more bearish than bullish at this time.
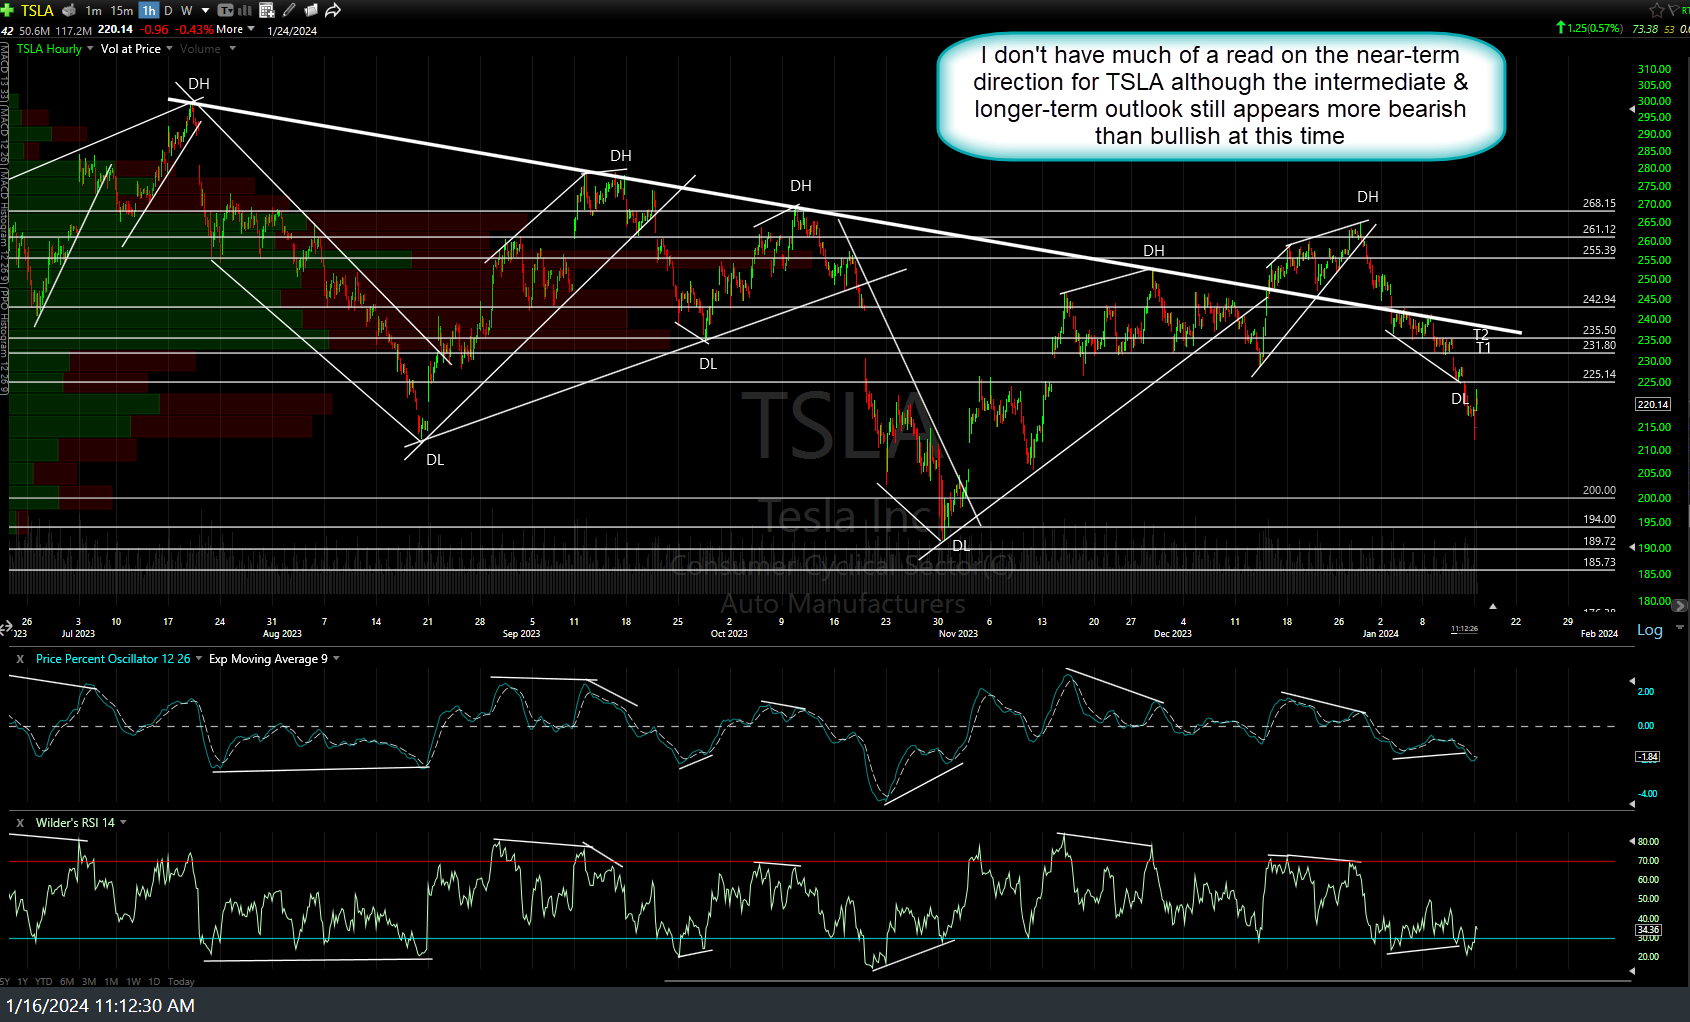
TSLA 60m Jan 16th
Bottom Line:
- While the intermediate-term trend remains bullish at this time, the technical postures on nearly all of the Magnificent 7 stocks that determine the direction of the rest of the stock market still appears to indicate that a significant reversal & potential major trend change appears both likely & imminent at this time, even if most of these stocks are able to make another marginal (but only marginal) thrust higher.
- Based on both the intermediate-term outlook (from the 60-minute charts in this post) coupled with the longer-term technical posture of the daily & weekly charts, the R/R clearly appears to be skewed to the downside vs. the upside IMO.
- As I like to say, support is support until & unless broken so watch for the potential sell signals above & also remember that any one bullish or bearish development in any of the Mag 7 isn’t as important as what the group does collectively (e.g.- bearish most or all break support while bullish if most or all can continue higher to the point the divergences are negated or taken out).
- Also, keep a close eye on what I refer to as the BIG 3: The stock market (particularly the Nasdaq 100 & the Mag 7 that determine where it as well as the rest of the stock market goes); US Treasury bonds; and the US Dollar & Euro forex pair (EUR/USD). Rising yields & a rising US Dollar (i.e.- falling EUR/USD) are net bearish for the stock market & vice versa.