
A quick glance at a few things that I’ll be watching for today & into the close tomorrow:
Regarding the precious metals & miners, my primary focus remains on the US Dollar. In yesterday’s pre-market video, I outlined a scenario where we might see a little more downside in the EUR/USD (i.e.- a rising Dollar/falling Euro) to backtest the downtrend line that was recently taken out on the EUR/USD daily chart.
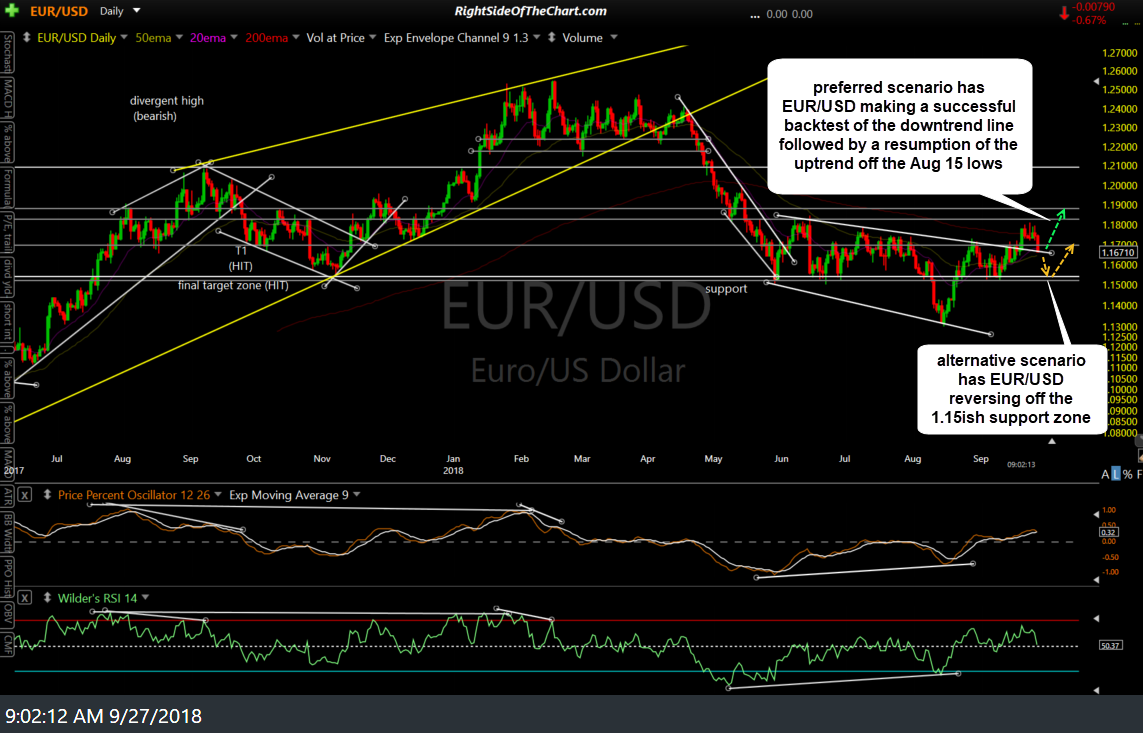
EUR-USD daily Sept 27th
That scenario has now come into play with EUR/USD falling back to that trendline while also coming up on the aforementioned 1.16582 support level on the 60-minute chart. 1.1658 is the level that I would still expect to (roughly) contain this overbought pullback which was triggered by the breakdown & backtest of the uptrend line following the divergent high on the 60-minute time frame.
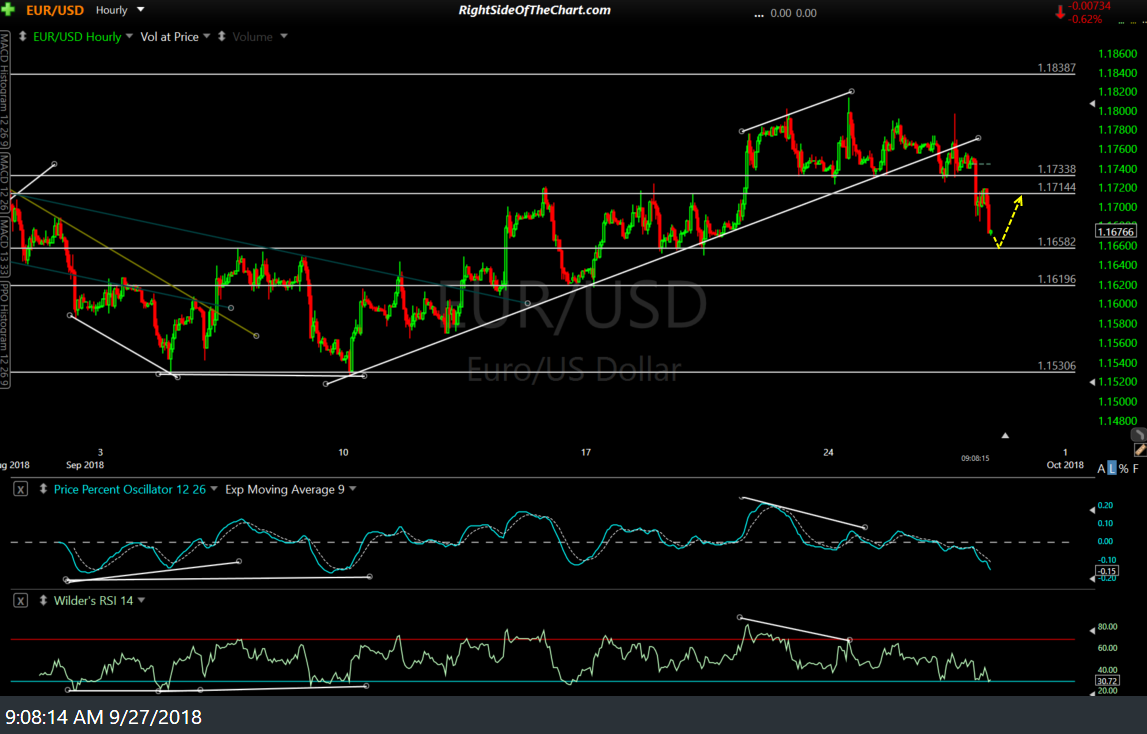
EUR-USD 60-min Sept 27th
With the majority of the post-FOMC rate announcement “noise” now behind us, today & possibly tomorrow should tell us if yesterday’s impulsive breakdown below the SPY 60-minute trendline was the real deal or just a whipsaw signal.
At the lows yesterday, SPY reversed just 2 cents shy of the first support/target level from the recent 60-minute charts which was & still is at 289.39. With the typical reaction of the initial tag of a support level from above, I will now be watching for a potential impulsive break below that level for additional evidence that the US stock market may be in the early stages of a much larger correction.

SPY 60-min Sept 26th close
However, I will also be watching the 291.62ish former support, now resistance level at which SPY has failed at recently, including the sharp fade of the brief rip that followed the 2:00 pm FOMC rate decision announcement. A solid break above that level, more so yesterday’s high of 292.24, which would most likely coincide with a move back above the trendline, would certainly dampen the case that a correction has begun.
Not much to add on QQQ, which failed at the 78.6% Fibonacci retracement level yesterday following the post-FOMC announcement pop. Still awaiting a break below the minor uptrend line on this 60-minute chart for a sell signal in QQQ with yesterday’s high of approximately 186 as resistance which would be near-term bullish if taken out.

QQQ 60-min Sept 26th close