
I was away from my desk the entire day yesterday and will be catching up on the charts as well as any questions & chart requests from the trading room today. With the 6 largest components of the Nasdaq 100 leading index all reporting earnings over the next week, the stock market is likely to go into a holding pattern over the next couple of days until at least the first of those FAAMG+I stocks (FB, AAPL, AMZN, MSFT, GOOG & INTL) reports, with INTC (Intel) kicking things off on Thursday after the market close (AMC).
As the largest semiconductor stock, INTC earnings are likely to set the tone for the semiconductor sector which is often a leading indicator for the larger tech sector. Following INTC, we have AAPL & AMD reporting AMC on Tuesday, Jan 28th, MSFT, FB & TSLA on Wednesday, Jan 29th, AMZN & V (Visa) on Thursday, Jan 30th, and GOOG (Google parent company, Alphabet) on Monday, Feb 3rd.
While the market can certainly go either way once these market-leading stocks & top-heavy components of the major indexes have reported & provided forward-looking guidance, the technical posture of the daily & weekly charts on the majority of these stocks, most of all of which have negative divergences & overbought conditions, substantially increases the risk that the next 10% direction in the market will be to the downside.
Of course, the market & those top-heavy components have continued to climb despite the divergences & overbought conditions building for some time now and as always, divergences & OB conditions are not sell signals, merely an indication that an impending trend change or correction is likely if & when we get some decent sell signals. I will post some update charts on the FAAMG+I stocks soon but until then, I continue to watch for a break below that yellow uptrend line on the /NQ 60-minute chart, which was most recently successfully tested in the late hours on Monday with /NQ rallying off that trendline support back up towards the top of the price channel since then.
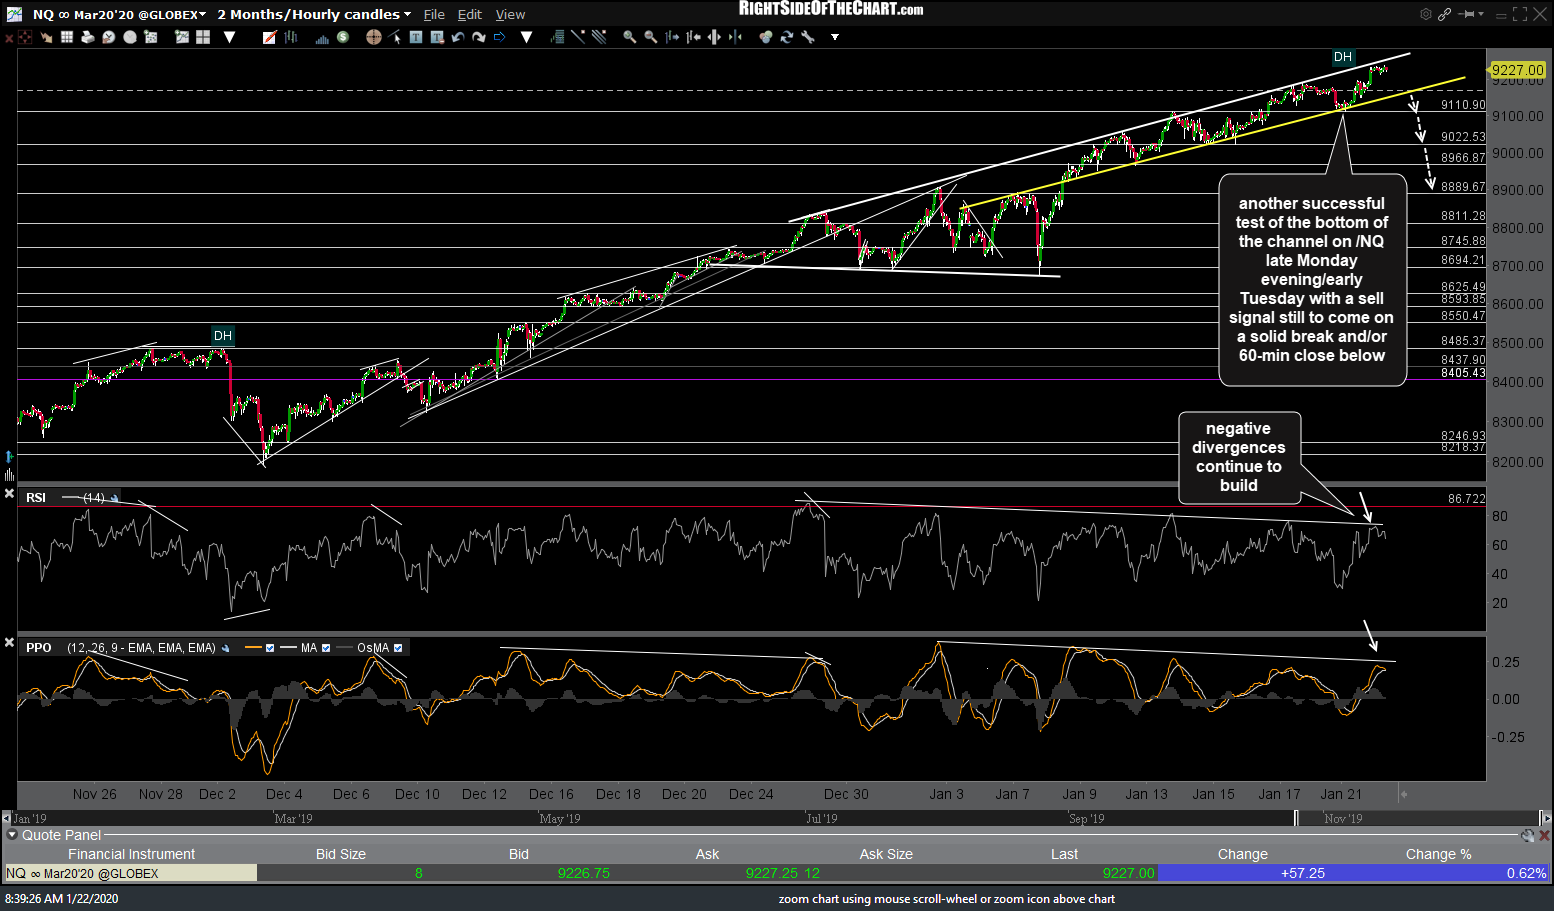
NQ 60m Jan 22nd
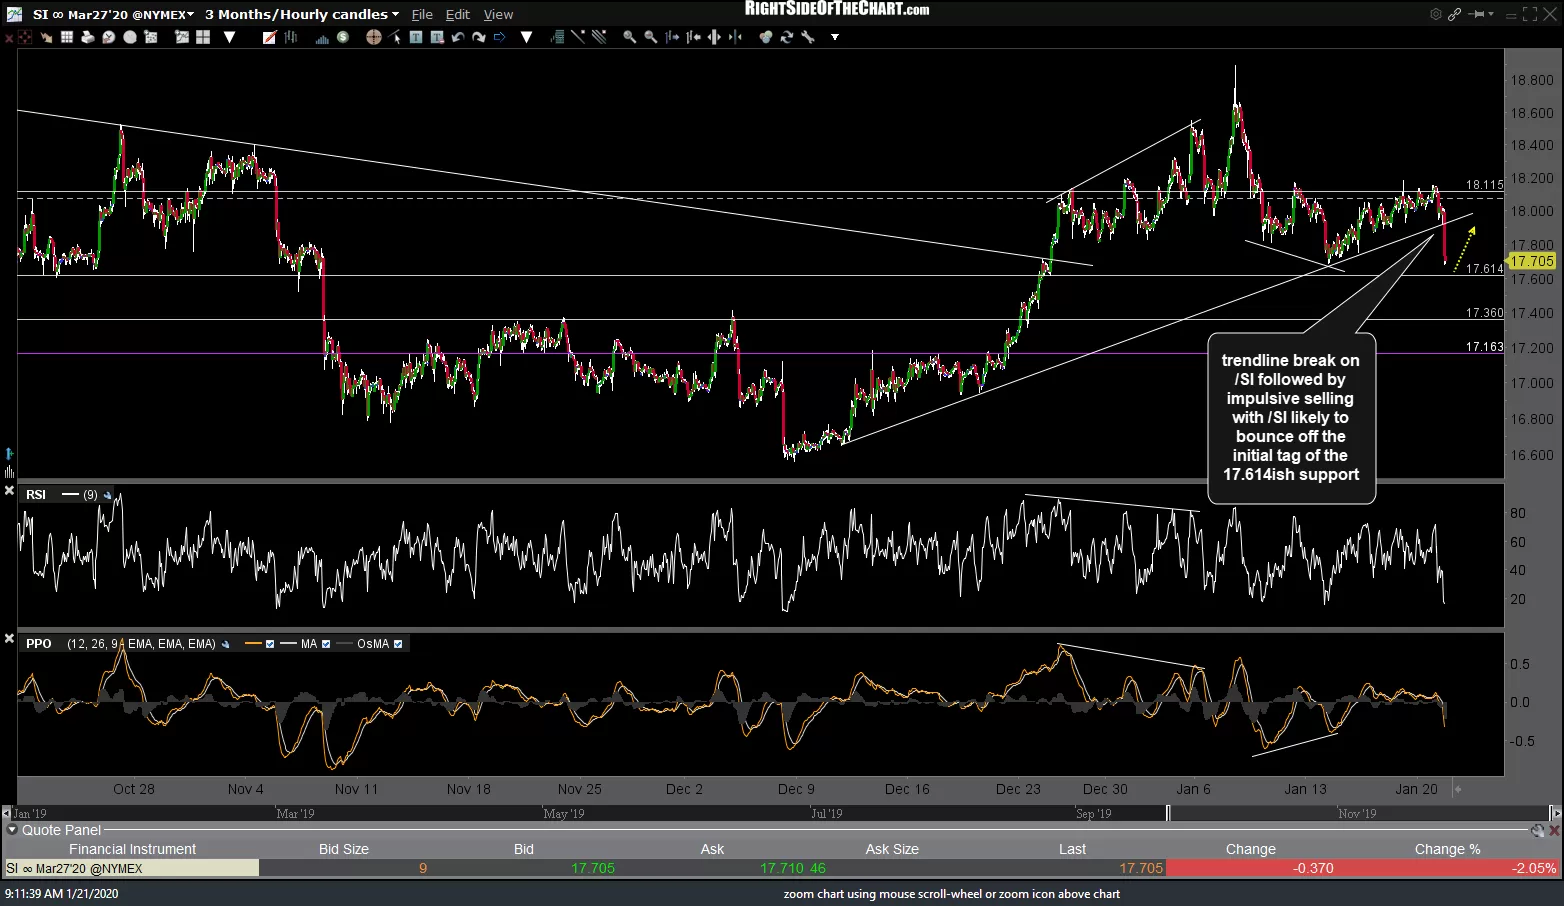
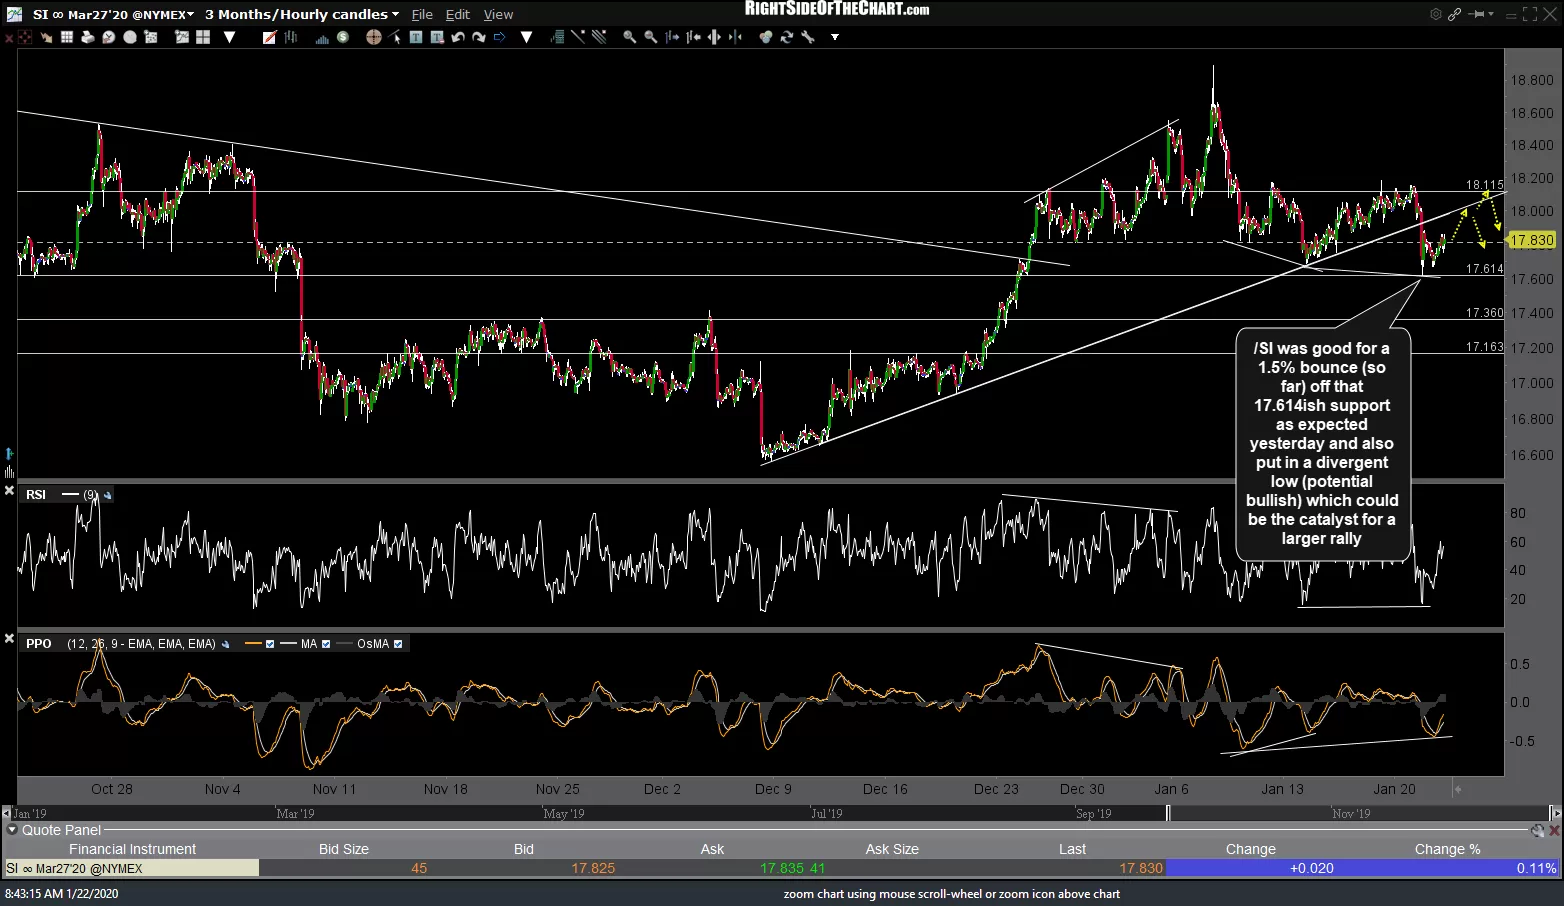
While gold, silver & palladium all broke below uptrend line support levels that may lead to more downside in the coming days or even weeks, /SI was good for a 1.5% bounce (so far) off that 17.614ish support, as expected yesterday, and also put in a divergent low (potential bullish) which could be the catalyst for a larger rally. Those that went long for a bounce trade off support yesterday & are still holding might consider trailing up stops while targeting a backtest of the trendline from below and/or the 18.115 former support, now resistance level which would intersect the trending in a few days. Previous (yesterday) and today’s updated 60-minute charts below.
-
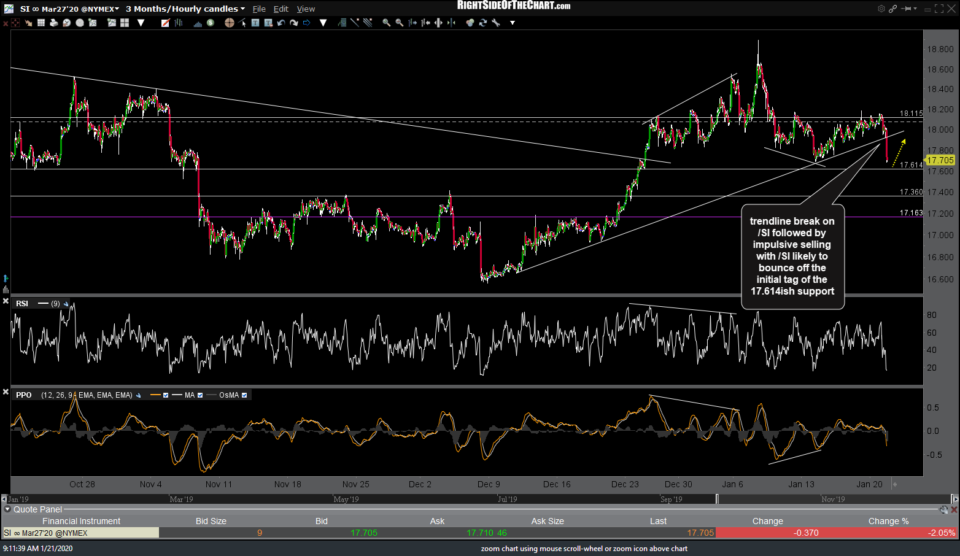
- SI 60m Jan 21st
-
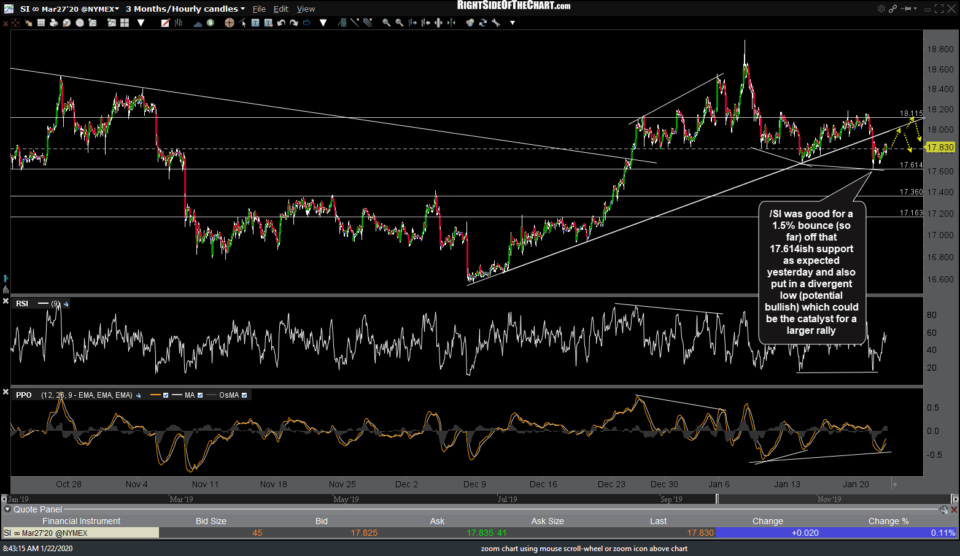
- SI 60m Jan 22nd
Another consideration to make with the market-leading FAAMG+I stocks reporting over the next week is the fact that breakouts & breakdowns (buy & sell signals) on many individual stocks, sectors & even the indexes, both this week & next, will run an increased risk of proving to be whipsaw signals. As such, one might opt to keep trading light, position sizes small and/or be extra-selective which breakouts to take. Also, with NFLX earnings out of the ways, I may add it as an official short trade later today or this week although I’d like to see how it trades once the regular session gets underway.