
The daily charts below highlight some key technical levels & potential developments to watch for in the coming days to weeks. As of now, the stock market remains in a near-to-intermediate-term uptrend within a longer-term downtrend (bear market) although the major stock indices remain at a key technical juncture that could determine the next tradable (10%+) trend, depending on which way we break from here.
These 2 upper-most circles are key supports levels on the QQQ daily chart; Price, 200-day MAs, primary downtren line, & uptrend line; bearish if & as each are taken out. Also, note the recent overbought (30+ RSI) reading, which typically marks end of rallies in bear markets. On watch for a potential bearish crossover on the PPO as it starts to roll over, another fairly accurate predictor of an intermediate-term trend change.
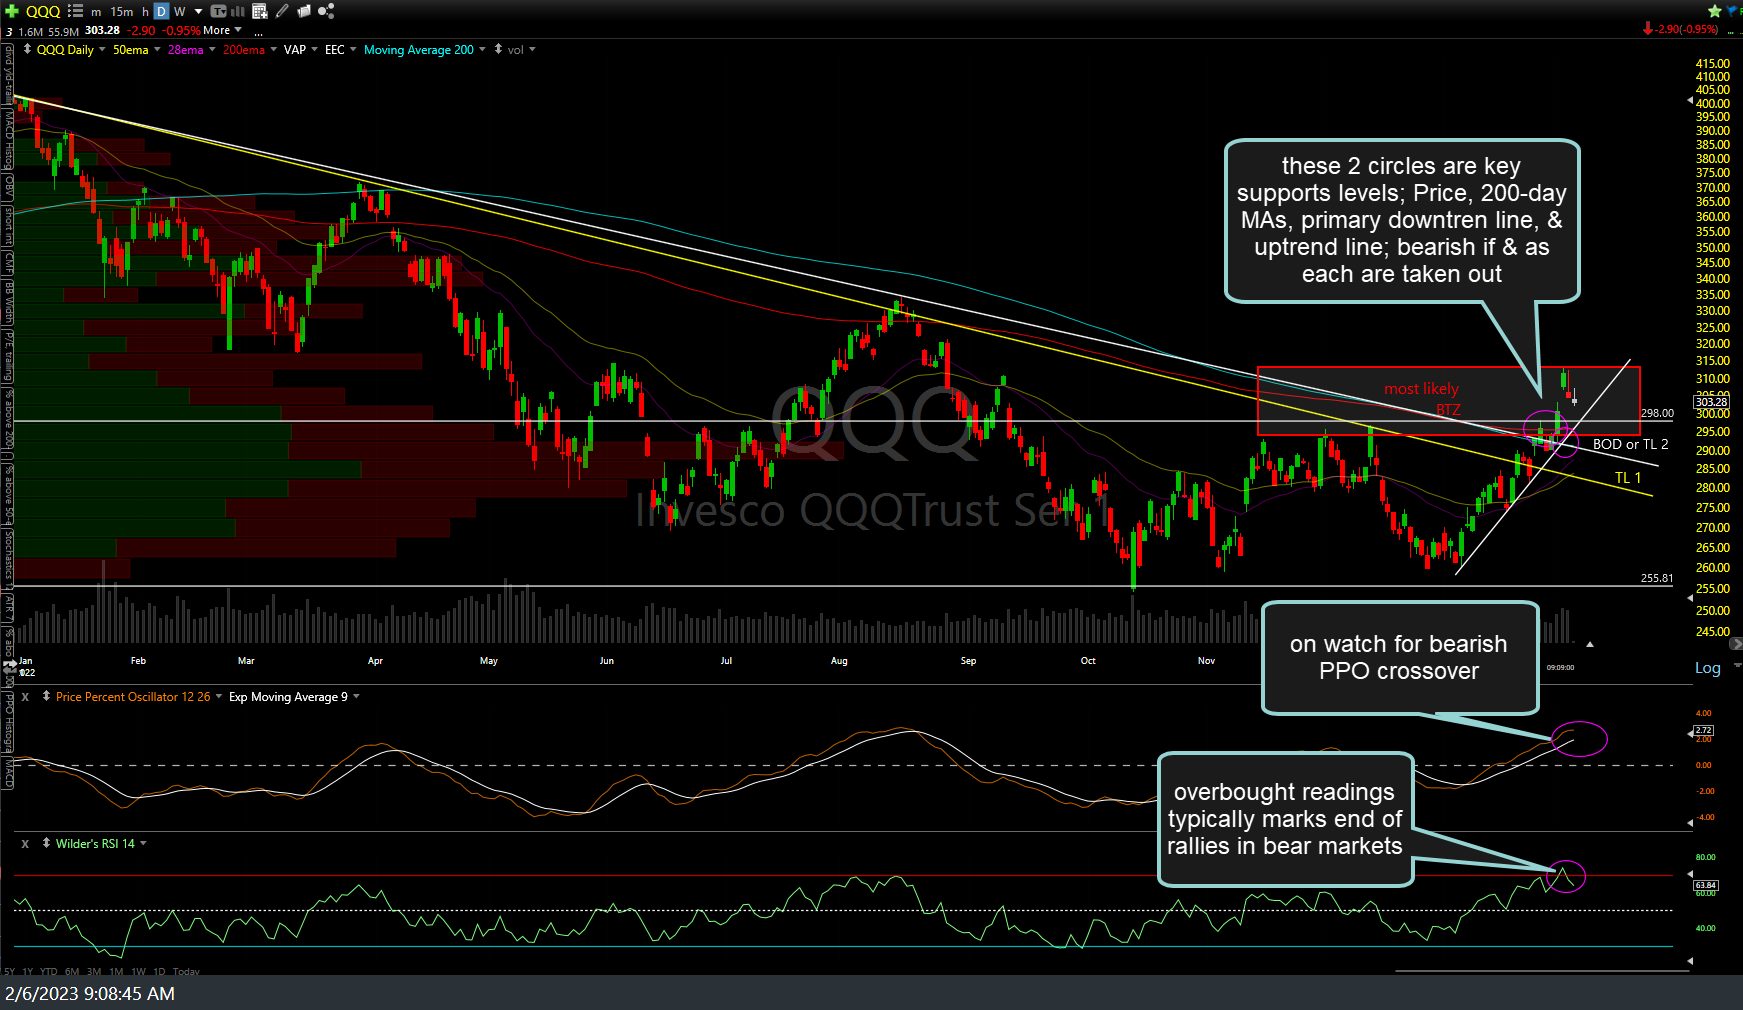
QQQ daily Feb 6th
Pretty much ditto for SPY (same technicals/levels to watch as the QQQ chart above) although with a trio of circled support levels just below to watch. Bullish if the indices can rally from here & put those support levels clearly in the rear-view mirror; bearish if all are clearly taken out. The market might also want to grind around testing these levels for a while while it digests the recent gains & if so, that will be frustrating to typical swing & trend traders while more conducive to active swing & day traders.
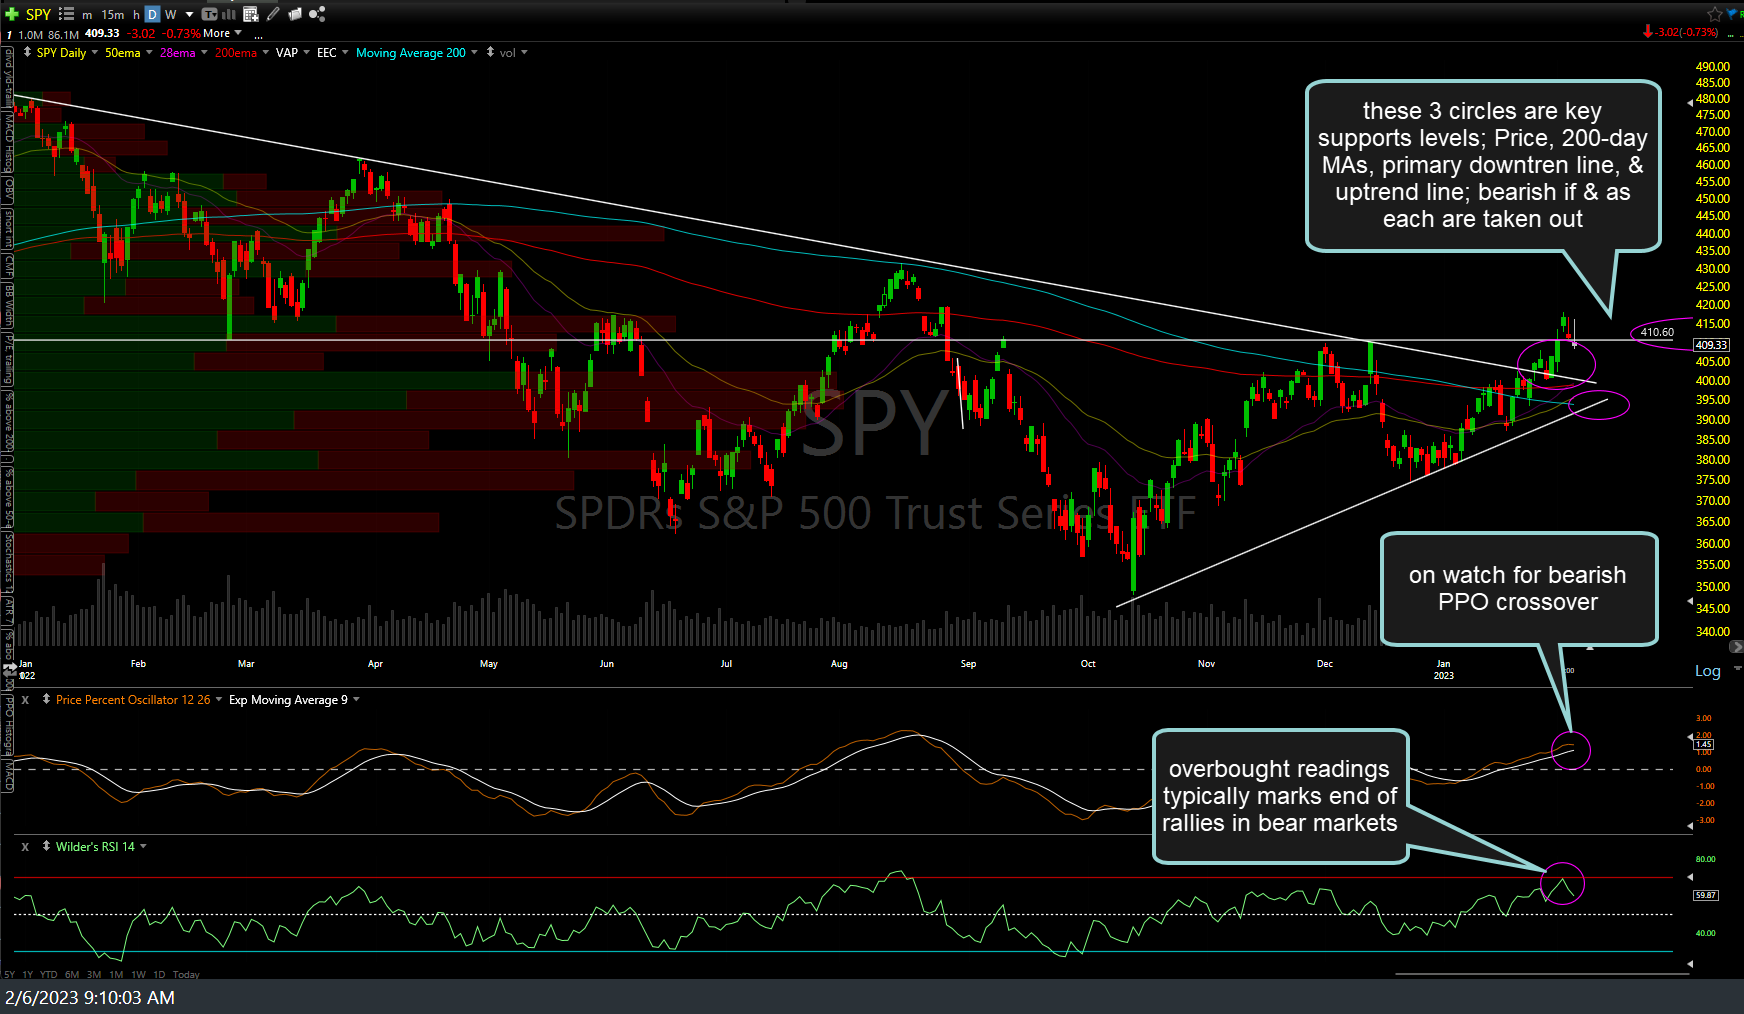
SPY daily Feb 6th
I’m also on watch for an impulsive breakout above the bullish falling wedge pattern on $VIX as it remains on trendline support with positive divergences (along with sell signals on SPY & QQQ). Daily chart below.
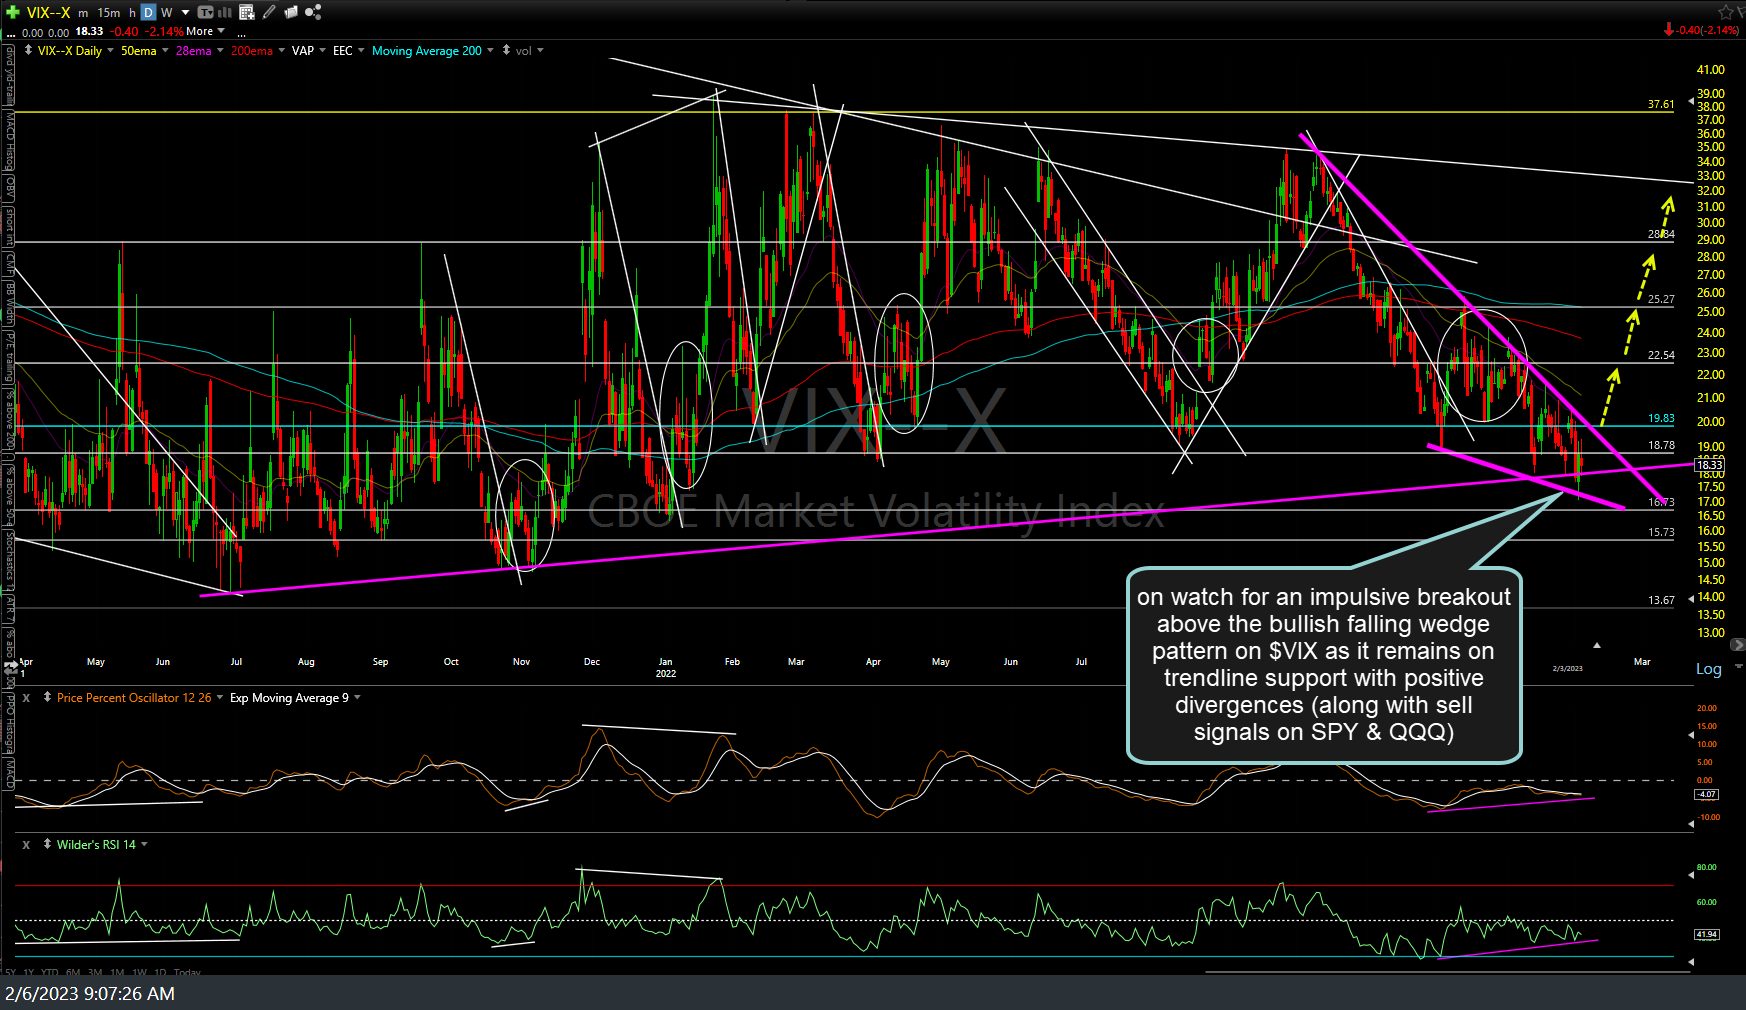
$VIX daily Feb 6th