
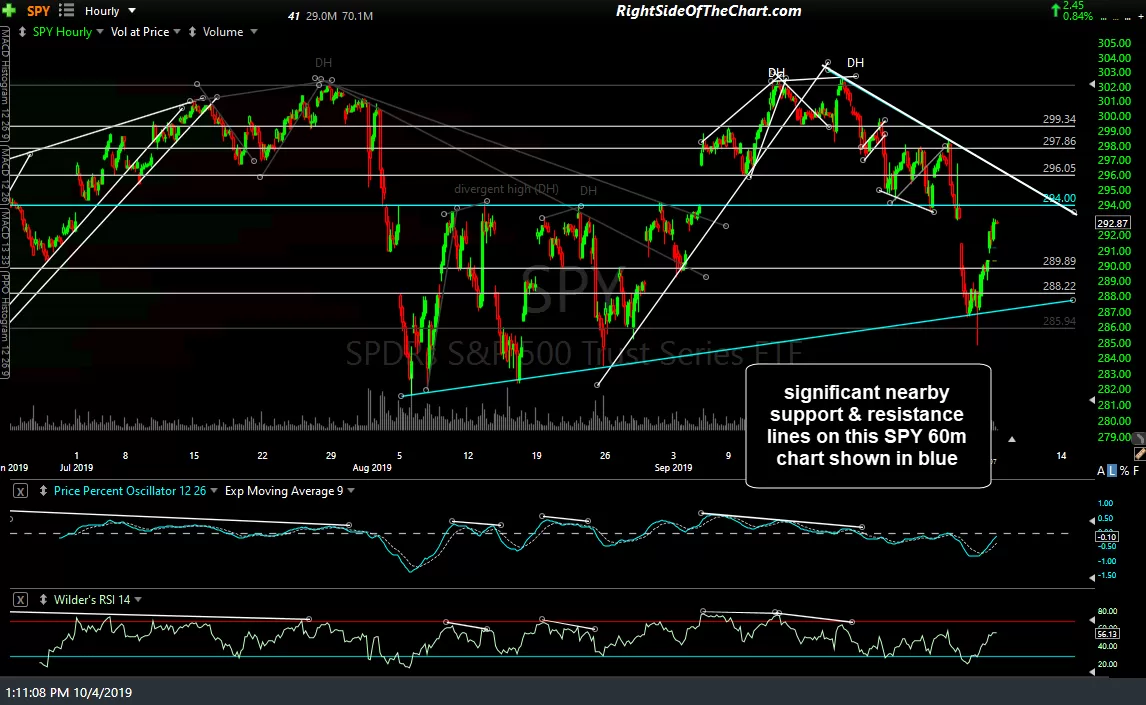
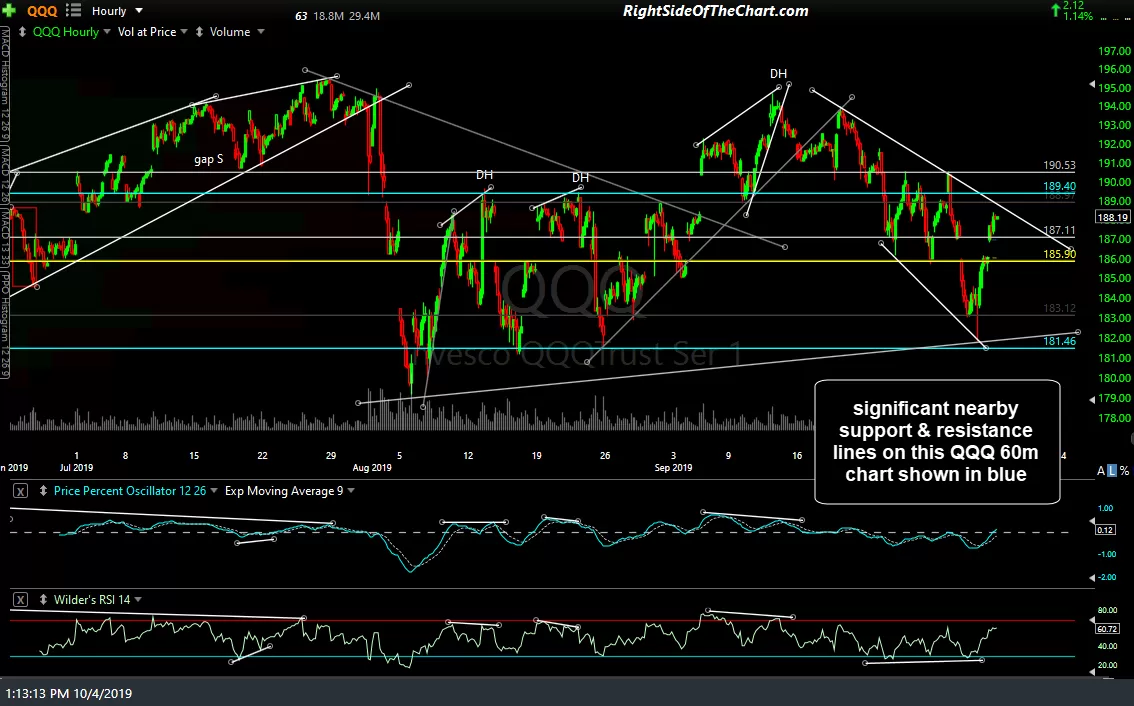
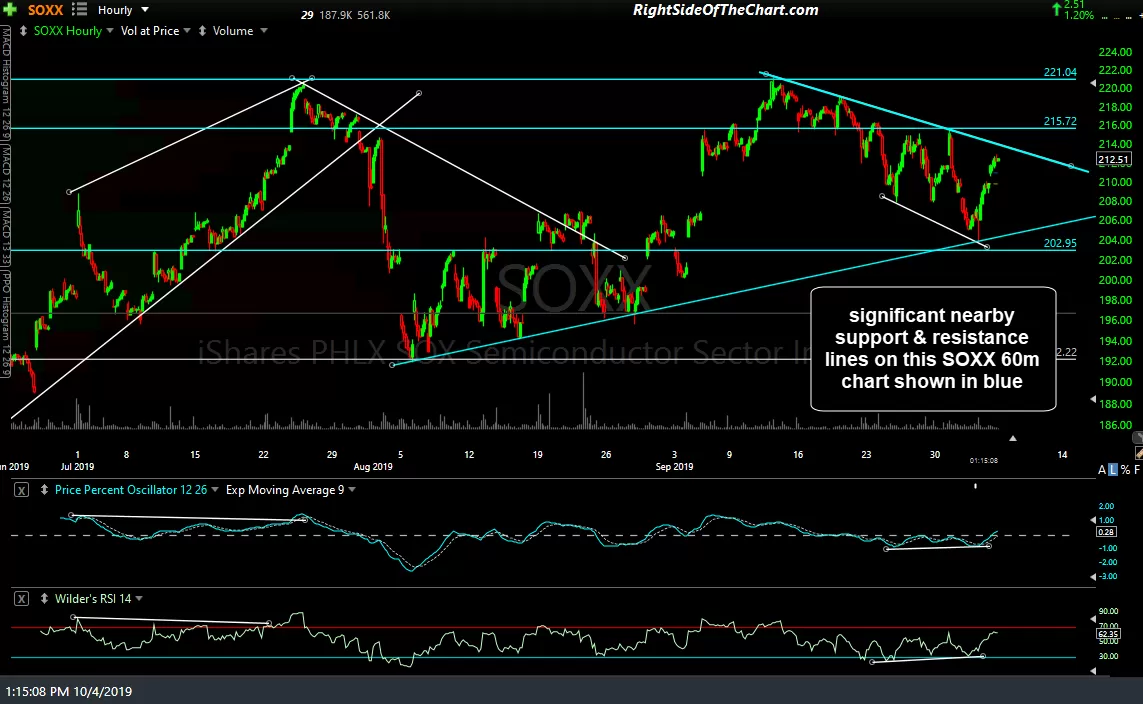
The 60-minute charts below including some potentially significant nearby support & resistance levels (blue trendlines & price levels) on the SPY, QQQ & SOXX 60-minute charts, including the tops of the August trading ranges, which both QQQ & SPY remain below at this time. Additional support & resistance levels that could come into play are shown in white.
-
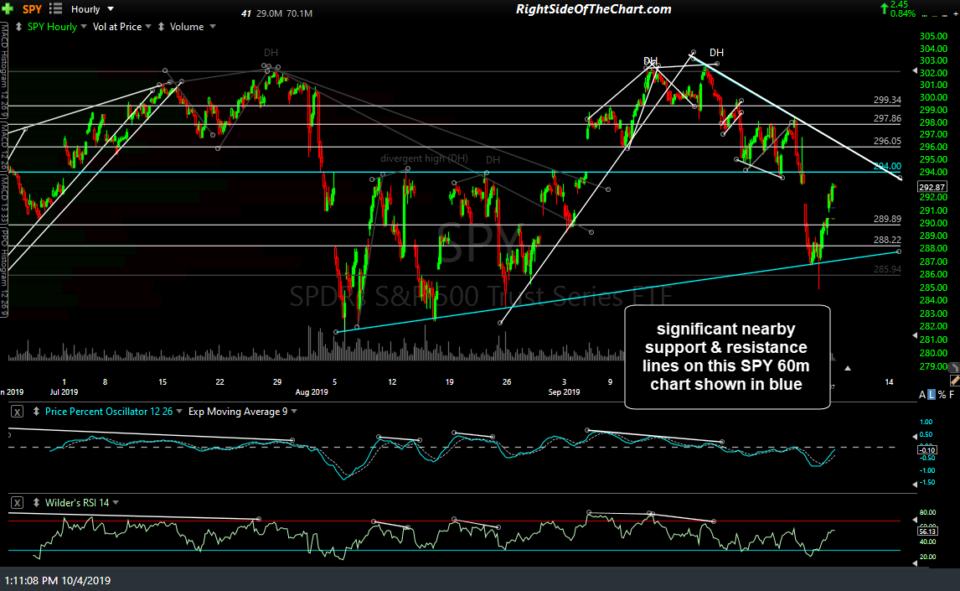
- SPY 60m Oct 4th
-
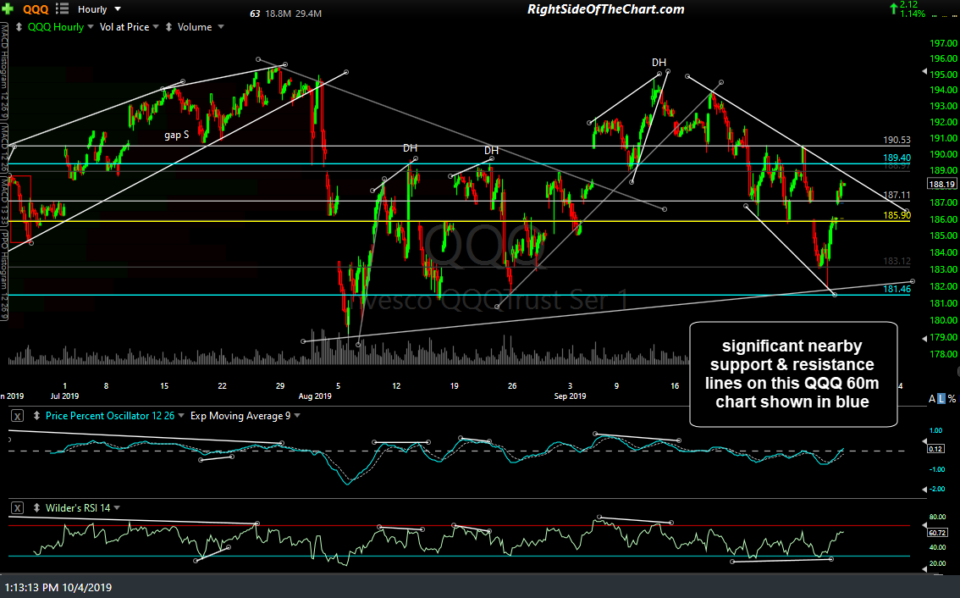
- QQQ 60m 2 Oct 4th
-
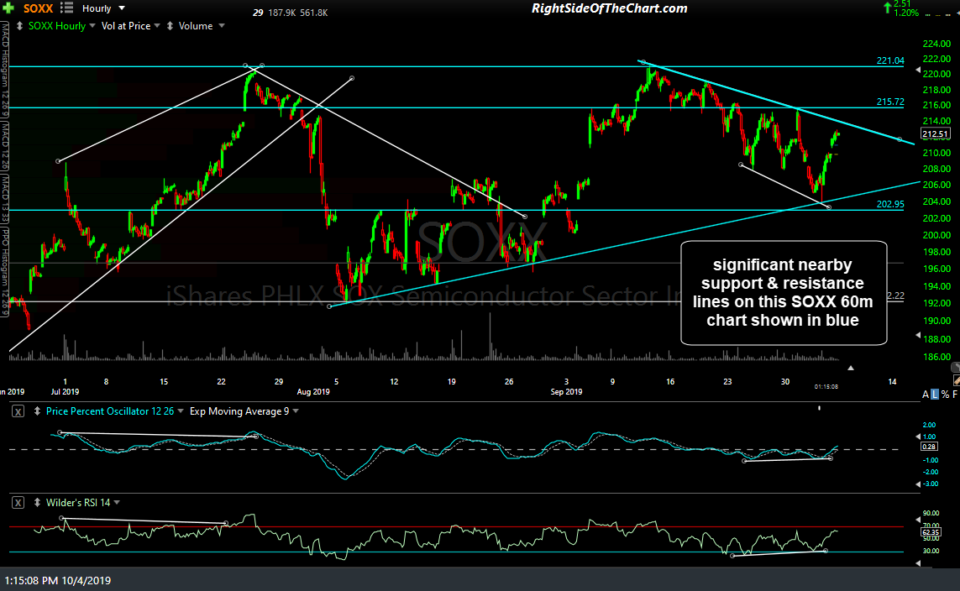
- SOXX 60m Oct 4th
As of now, the major stock indexes have essentially stalled out just shy of the top of the August trading ranges with the rally in SPY (so far) stopping at the top of Wednesday’s gap of 293.21 without any changes since the early-session market update video earlier today. With just over 2-hours left to close out the weekly candlesticks, both QQQ & XLK are likely to close below the Dec 24th uptrend lines for the second consecutive week (or just above/on them at best if we rally hard into the close), keeping last week’s sell signal intact for now. Therefore, my focus will turn back to the 60-minute & daily charts as we kick off the trading next week.