
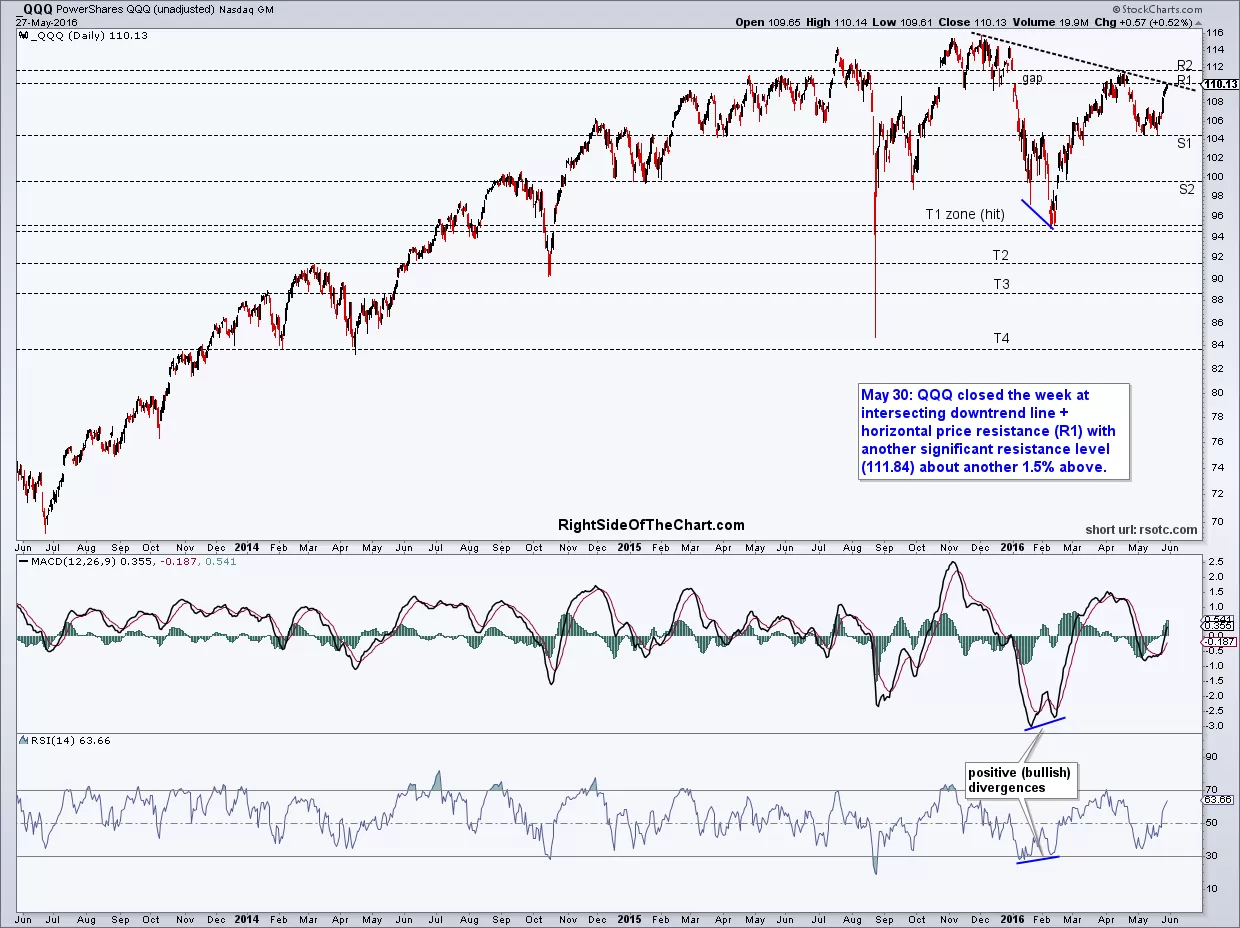
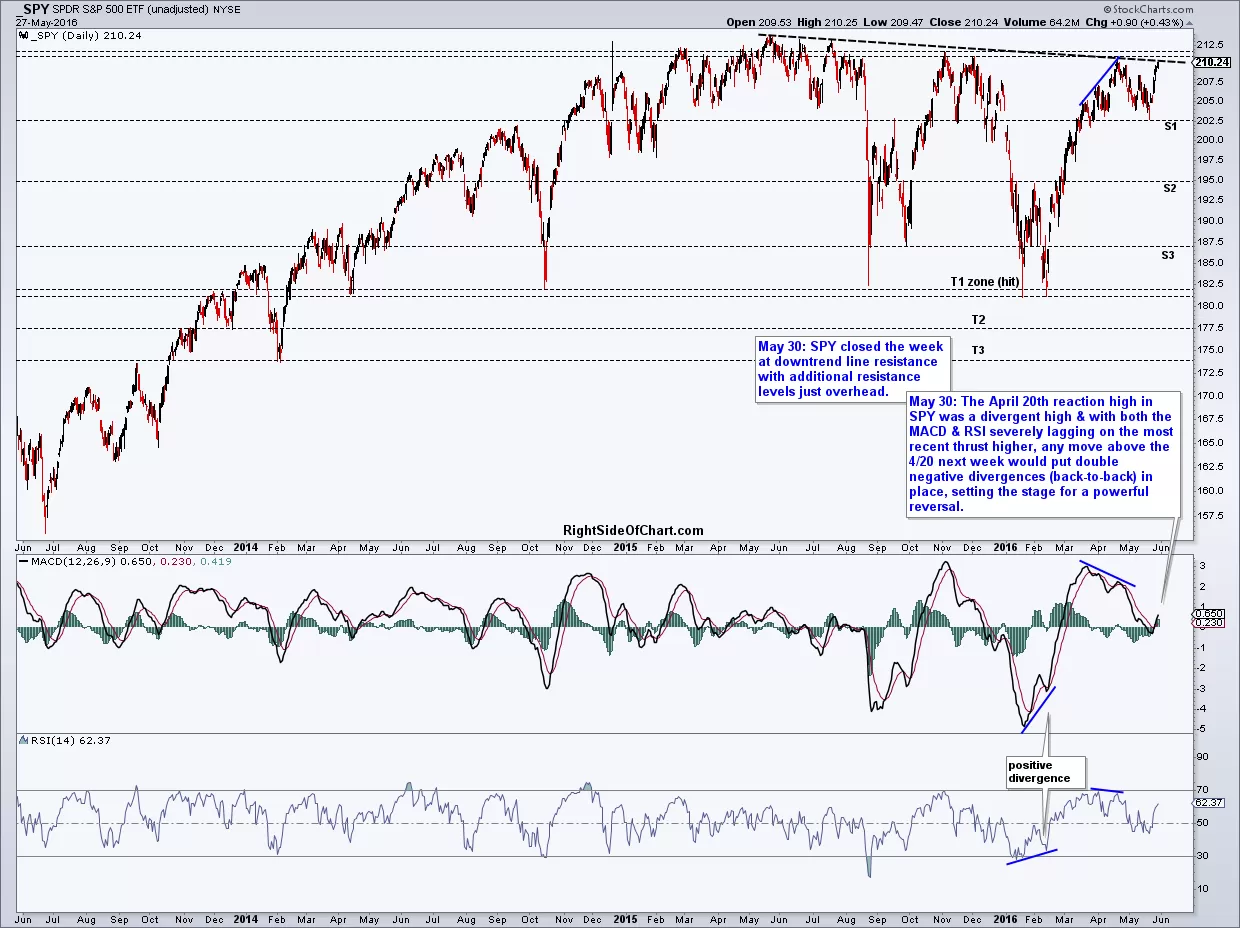
Both the QQQ (Nasdaq 100 ETF) and SPY (S&P 500 ETF) closed at downtrend line resistance on Friday & both face significant resistance levels just overhead, should they try to pop above the downtrend lines for a stop-raid sometime this week. While the SPY is just shy of testing the April 20th reaction high, a key resistance level, with both the MACD & RSI severely lagging on the most recent thrust higher, any move above the April 20th highs next week would put double negative divergences (back-to-back divergences) in place, setting the stage for a powerful reversal & move to any or all of the support levels and ultimately the remaining price targets (T2 & T3) on this daily chart.
-
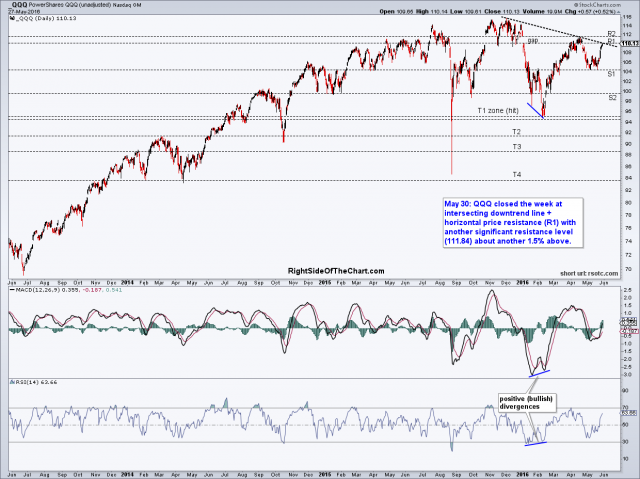
- QQQ daily May 30th
-
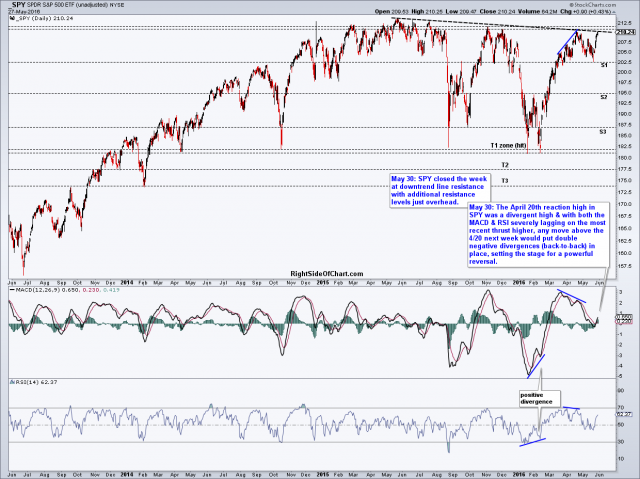
- SPY daily May 30th
Following the breakdown of the bearish rising wedge pattern on the $GOLD/GLD daily time frame, $GOLD (and GLD) hit my initial price target on Friday where a reaction is likely. However, my conviction for a bounce is not very strong as I would give about 50/50 odds for a continued move in gold down to the 1175-1180 area before a meaningful & lasting reversal in gold.
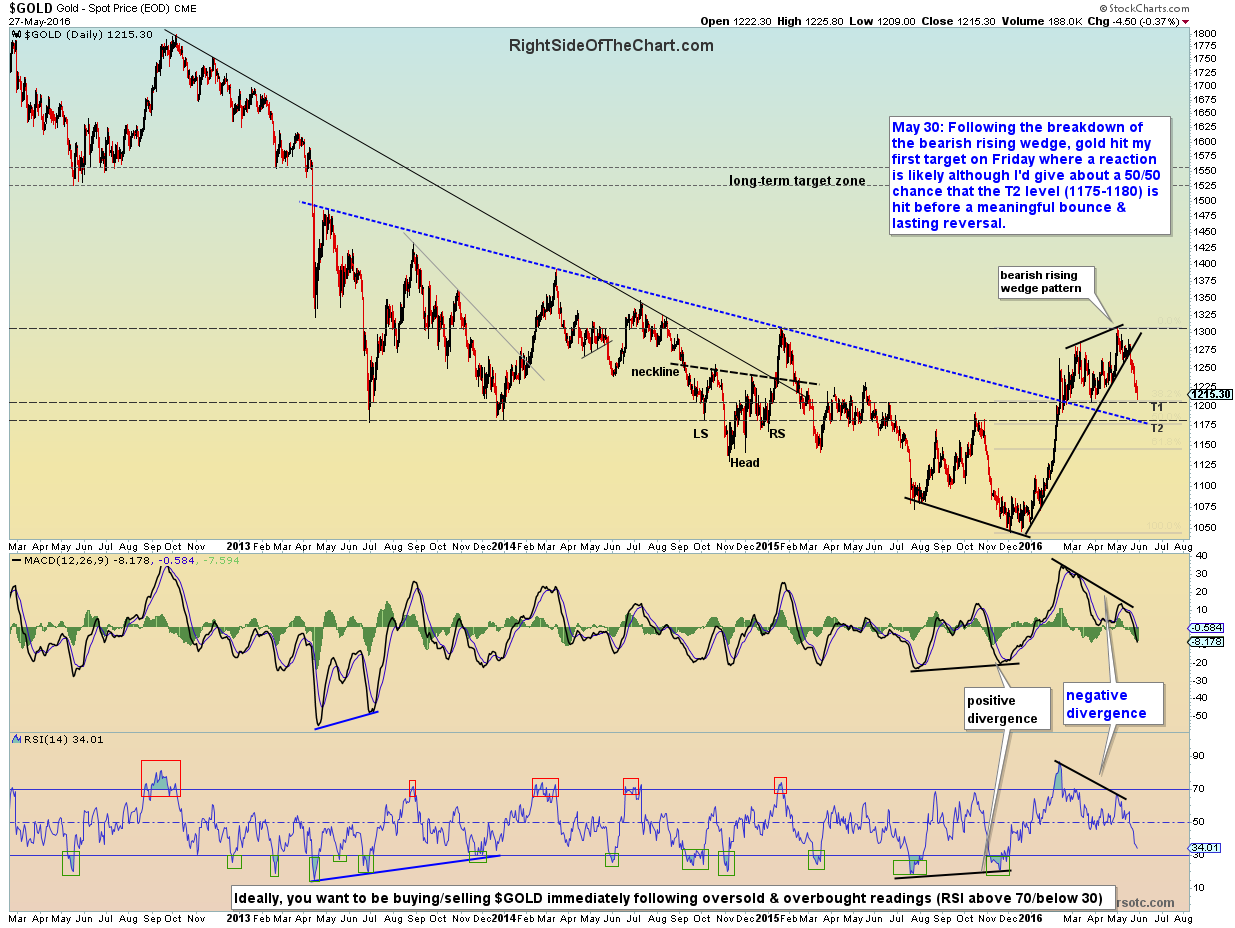
$GOLD daily May 30th
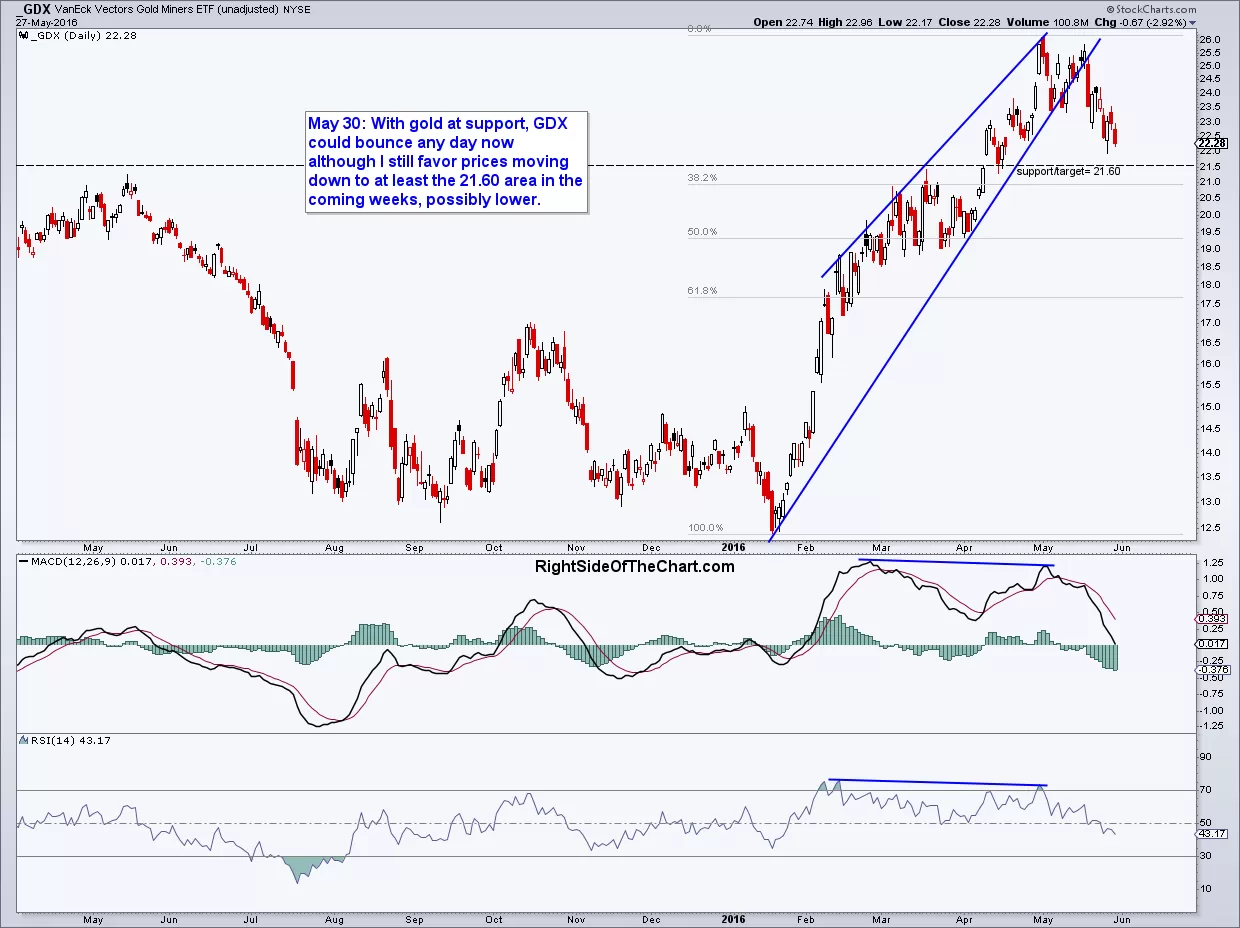
With gold at support, GDX (gold miners ETF) could bounce any day now although I still favor GDX moving down towards at least the 21.60 are in the coming weeks & quite possibly lower. T3 at 21.52 remains the final official target on the GDX/NUGT short trade for now although I may decide to slightly raise that target this week. Although I put nearly equal odds on a bounce in gold early this week, I’m not as concerned with my remaining NUGT short position (I booked partial profits last week to lighten ahead of the 3-day weekend when GLD hit my profit target) as it appears that the gold mining stocks still have some catching up to the downside as they outperformed gold by a wide margin over the last few months.
-
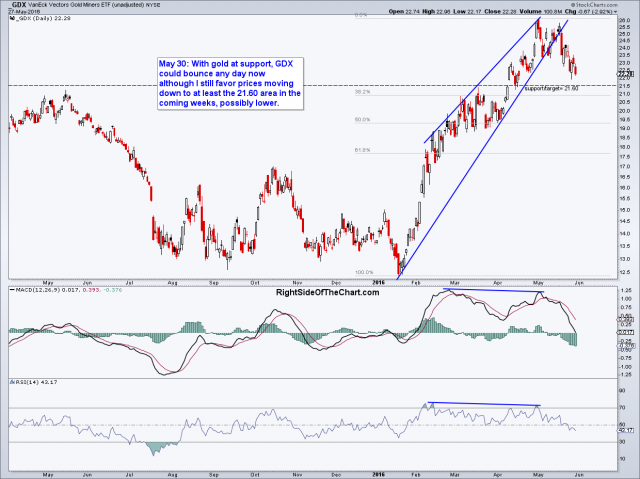
- GDX daily May 30th
-
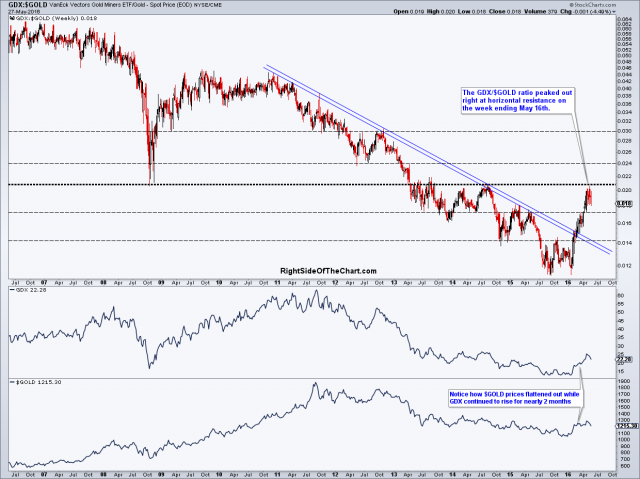
- GDX-$GOLD ratio May 30th
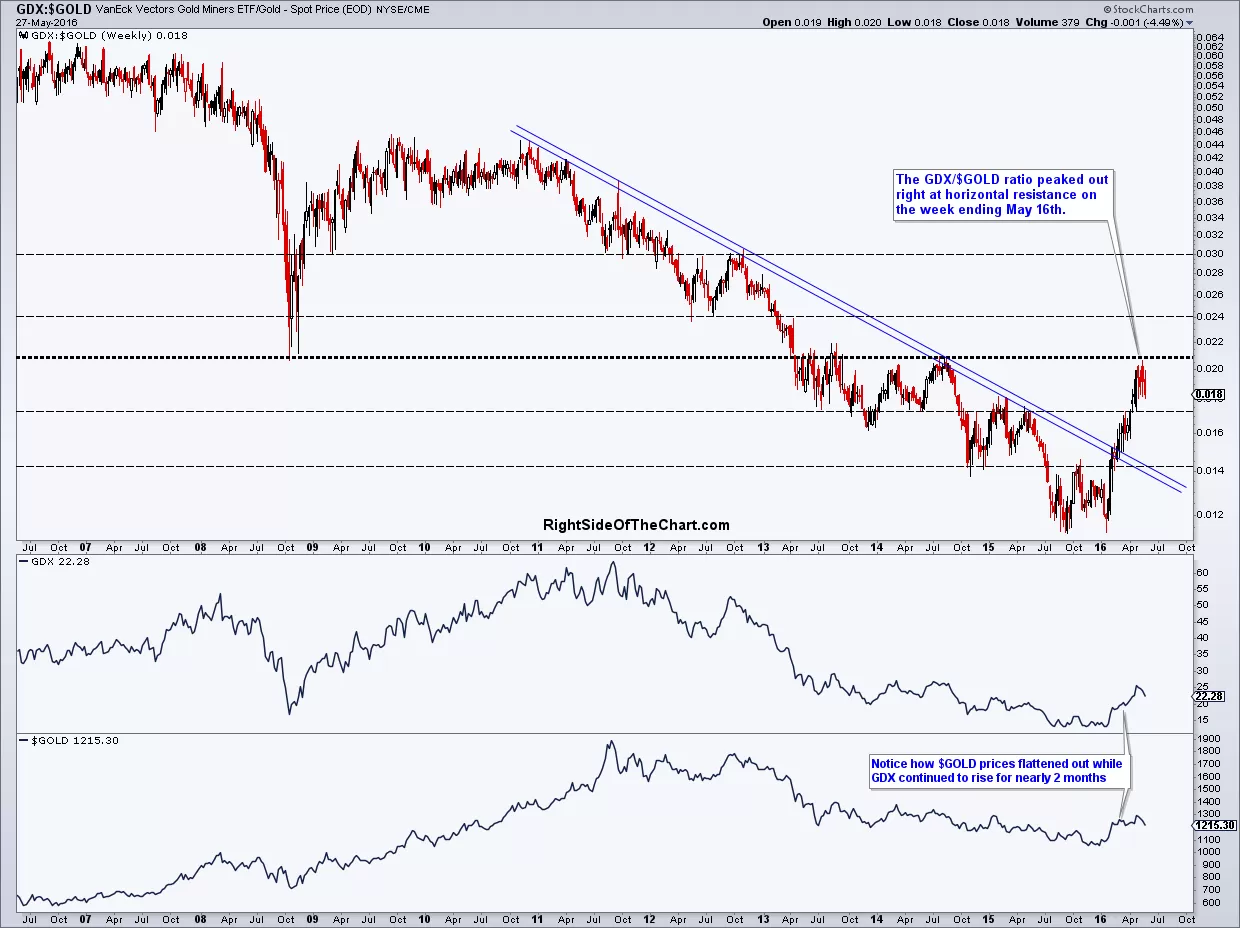
When GLD put in a reaction high of 122.37 back on March 4th, it essentially topped, moving sideways to only slightly higher (1.3%) a couple of months later on May 2nd. Meanwhile, GDX didn’t get the memo that gold prices had peaked, instead going on to rally another 25%+ plus from its comparable March 4th reaction high. Not coincidentally, the GDX-to-Gold ratio also peaked earlier this month & that peak occurred (again, not coincidentally IMO) right at key resistance on the GDX/$GOLD ratio. While the ratio still has plenty of room to increase to return to its previous bull market highs, as with most initial tags of resistance from below, a reaction (pullback) was likely & that pullback still looks to have some more downside left (horizontal dashed lines mark support & resistance levels in the GDX/$GOLD ratio, weekly chart shown).
Last but not least is crude oil, in which a break down below this bearish rising wedge pattern still appears imminent at this point. My expectation is for a drop of about 12-15% from Friday’s close in crude oil.

$WTIC daily May 30th