
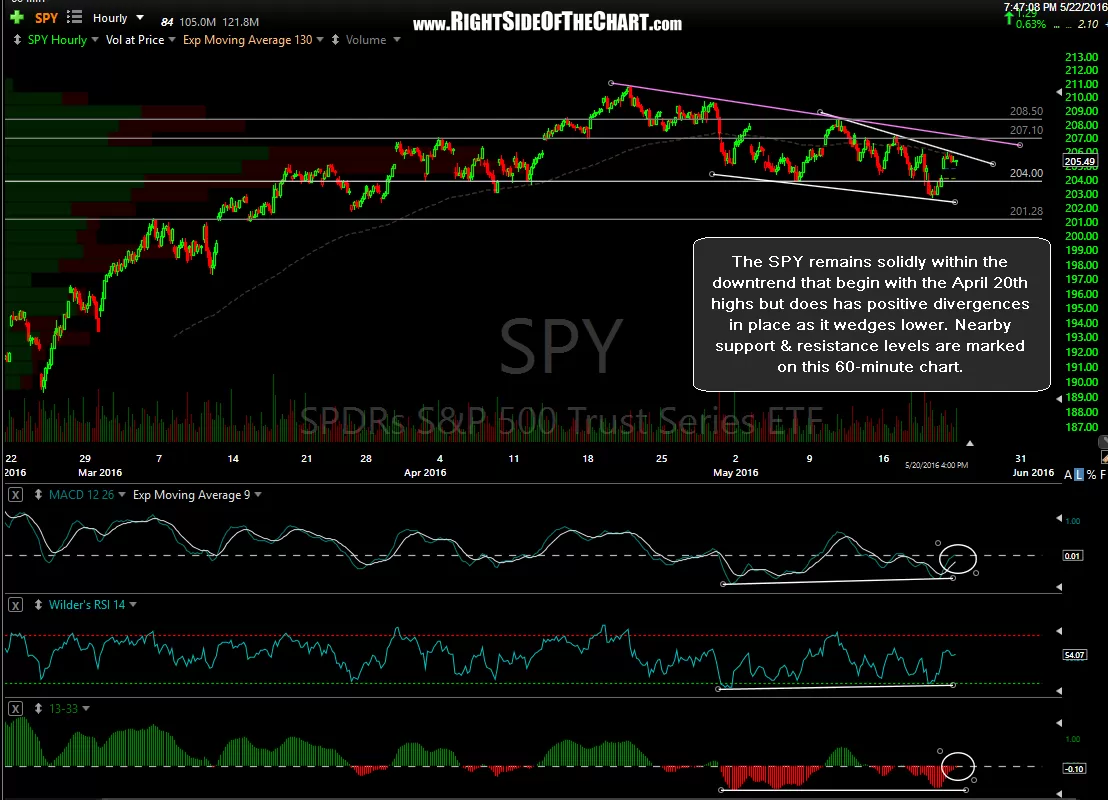
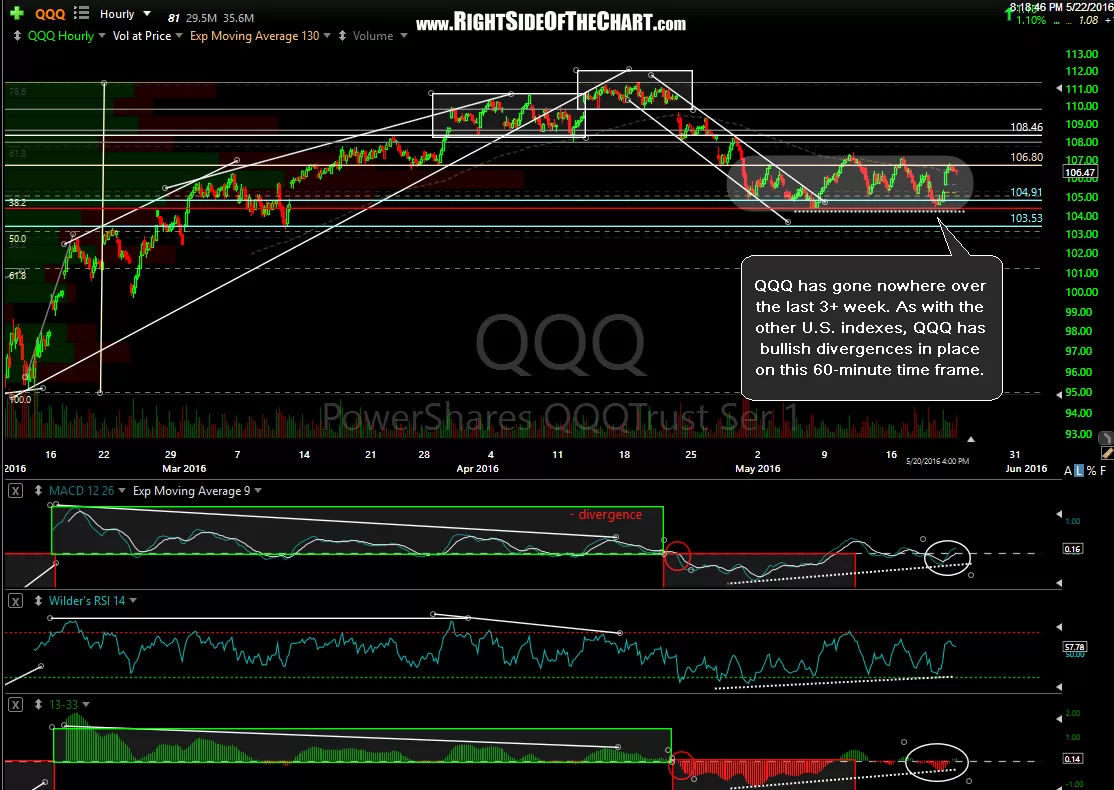
Friday saw the broad gains across U.S. equities although for the most part, those gains were insignificant from a technical perspective, as all major U.S. indices still remain solidly entrenched in a near-term downtrend that began with the April 19th & 20th highs in the QQQ & SPY, respectively. A downtrend is simply defined a prices making a series of lower highs & lower lows, which so far remains the case for the U.S. markets although the Nasdaq 100 (QQQ) has essentially traded sideways now for over 3 weeks, closing on Friday at 106.47 compared to a closing value of 106.28 back on April 28th, all while trading in a relatively tight sideways range of a just 2.81% over that time period, obviously a frustrating period for both bulls & bears alike.
-
- SPY 60-minute May 22nd
-
- QQQ 60-minute May 22nd
-
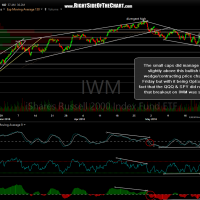
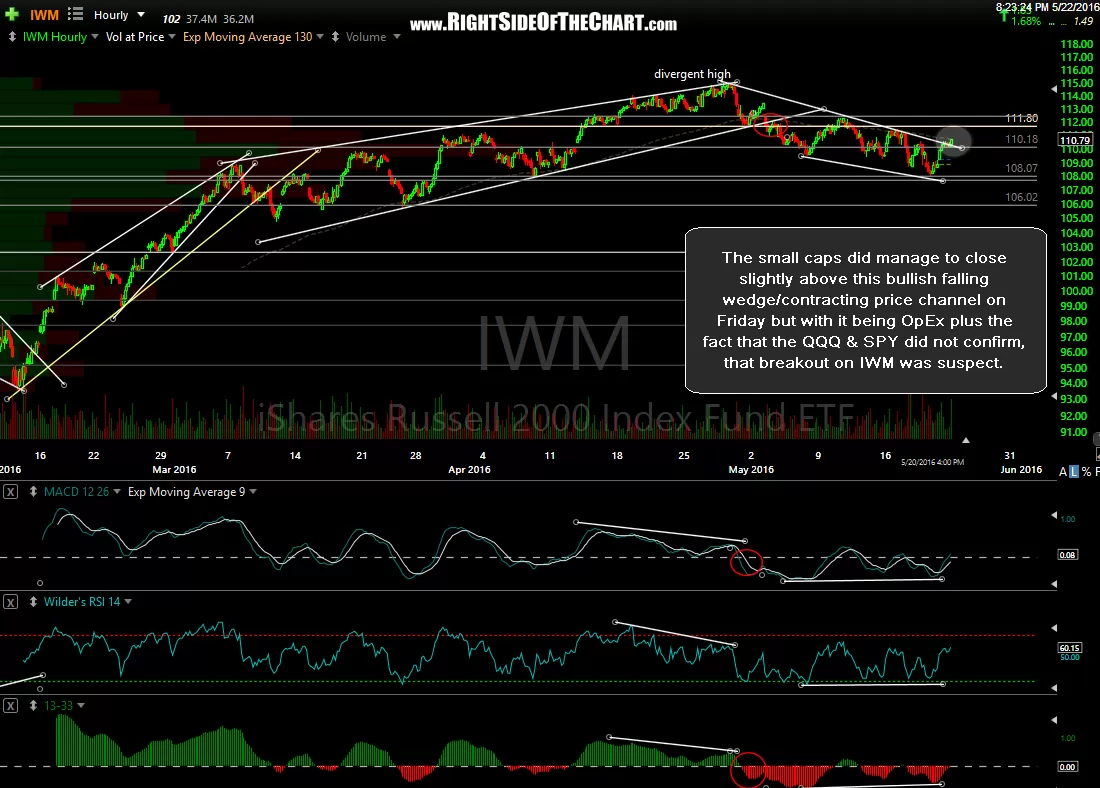
- IWM 60-minute May 22nd
The SPY remains solidly entrenched within the downtrend that begin with the April 20th highs but does has positive divergences in place as it wedges lower, which could be the catalyst for at least a short-term rally. Nearby support & resistance levels are marked on this 60-minute chart. Despite what may have seemed like a strong finish to the week, Friday’s OpEx induced rally only managed to lift the broad market (S&P 500) 0.63% to close the week with a total gain of just 0.36%, essentially a flat week. The Nasdaq 100 (QQQ) with a slightly more impressive 1.10% gain on Friday still only managed to close the week with a modest gain of just 0.73%.
Overall, the near-term trend remains bearish with all major U.S. indexes still trading below numerous resistance levels, such as downtrend lines, key moving averages & horizontal price resistance. It is worth noting that, as pointed out last week, that not just the SPY but all the major indexes have bullish divergences in place on the 60-minute time frames. Those divergence help to validate the bullish falling wedge patterns that have formed on some indices such as SPY & IWM so we’ll have to monitor these patterns closely to see if the bears can step up & foil those bullish patterns & keep the downtrend alive & well or if the bulls can capitalize on these potential trend reversal patterns & start unwinding the bearish case by taking out the overhead resistance levels.
-
- GLD daily May 22nd
-
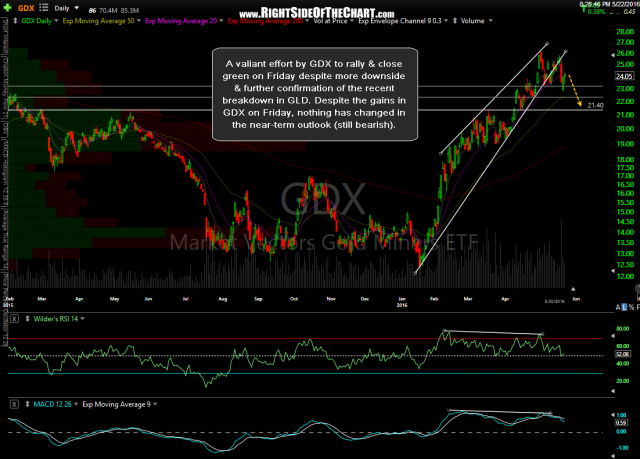
- GDX daily May 22nd
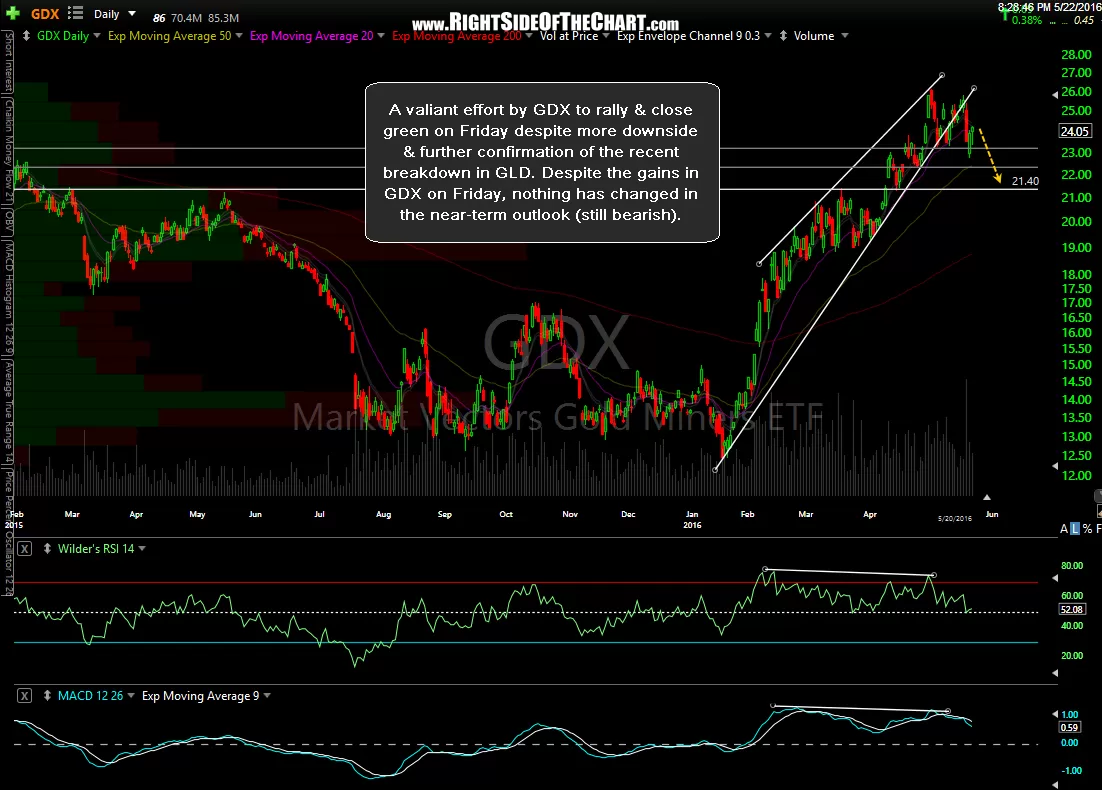
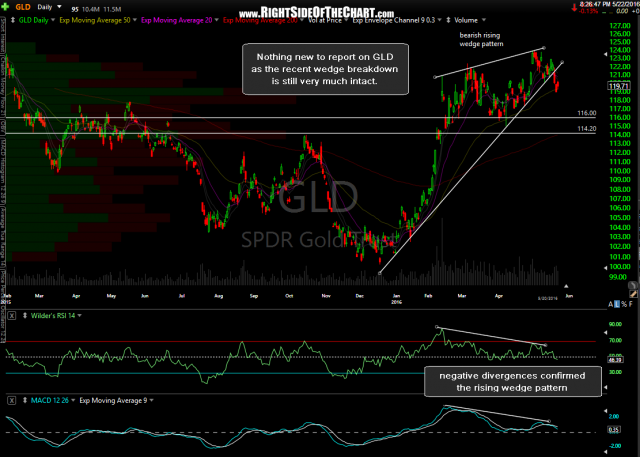
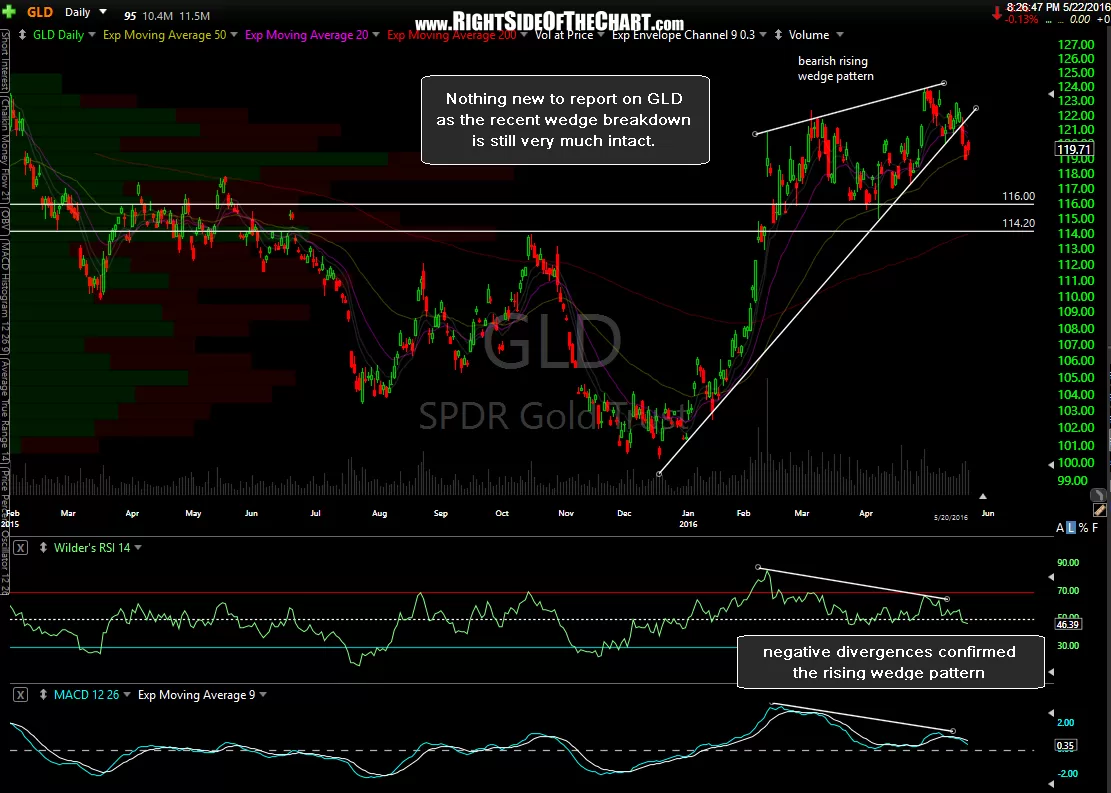
Nothing new to report on GLD as the recent wedge breakdown is still very much intact. GDX made a valiant effort to rally & close green on Friday despite more downside & further confirmation of the recent breakdown in GLD. Despite the gains in GDX on Friday, nothing has changed in the near-term outlook (still bearish).

USO daily May 22nd
USO (crude etf) reversed where expected & closed slightly down on Friday. My expectation remains for more downside in the coming days to weeks with a move down to the 10.70 area as very likely.
Bottom line: It still appears that the charts indicate more downside in the coming weeks in both US equities as well as certain dollar-sensitive commodities such as gold & oil. However, with the 60-minute divergences in place on the equity indices & the U.S. dollar quite overbought & due for at least a healthy pullback, the possibility for upside (i.e.- a bounce) in equities early this week is certainly elevated at this time. With the longer-term & intermediate-term charts still bearish, my guess is that any rally, assuming that these divergences start to play out, will be relatively minor in scope (1½ – 2%) and duration (1-3 days).