Identifying divergences between the stock market & various indicators in order to help identify when to be on the look out for a trend reversal. Covered in this video are the charts of the Nasdaq 100, S&P 500, IWM (Russell 200) and the percentage of stocks trading above their 50-day moving average in the Nasdaq.
-

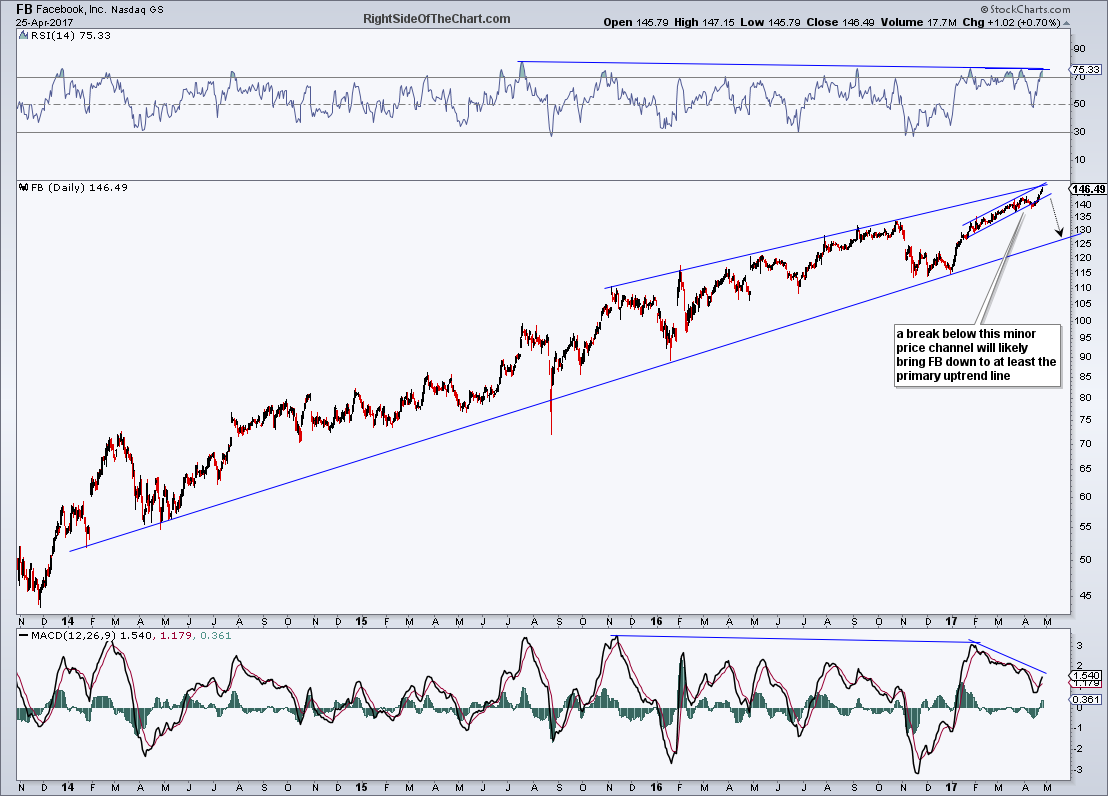
- FB daily April 25th
-
- AAPL daily April 25th

-
- AMZN daily April 25th

-
- MSFT daily April 25th

-
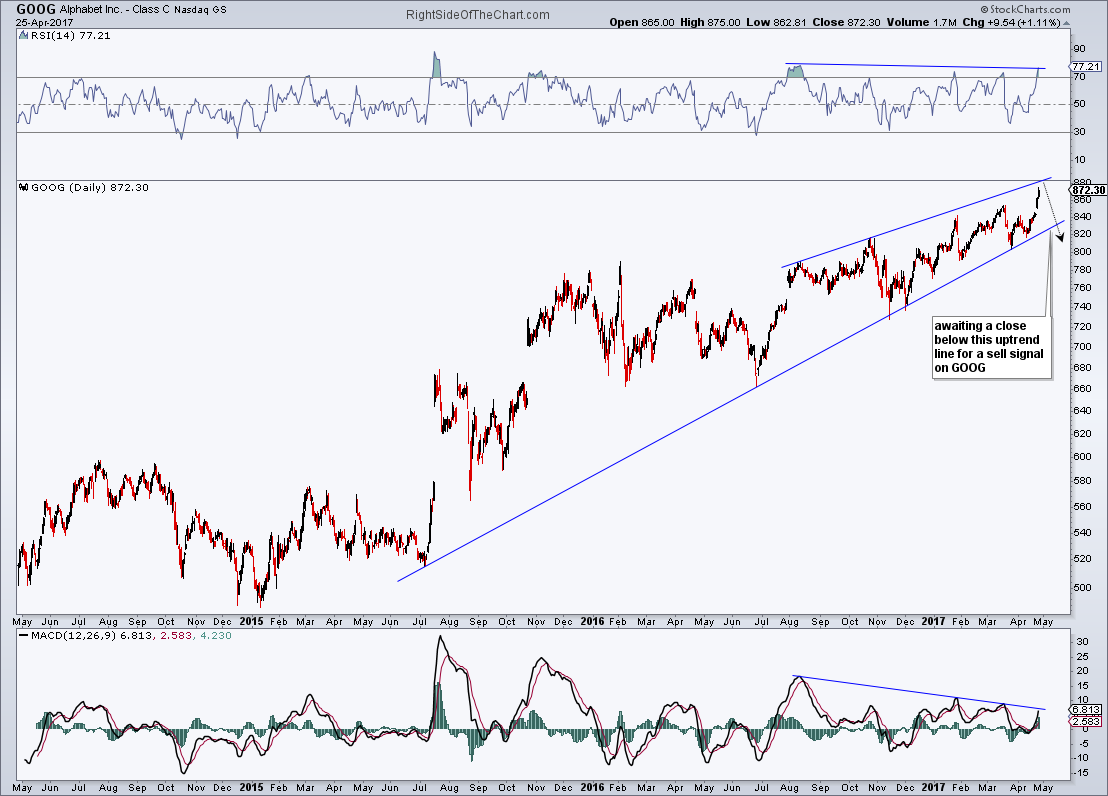
- GOOG daily April 25th