As favored, /GC (gold futures) rallied into the top of the trading range (1791 resistance) & while a solid & sustained breakout above that level would be bullish, a break below this small bearish rising wedge with gold at resistance with negative divergences, would likely trigger at least a minor correction before a lasting breakout. Updated 60-minute chart below.
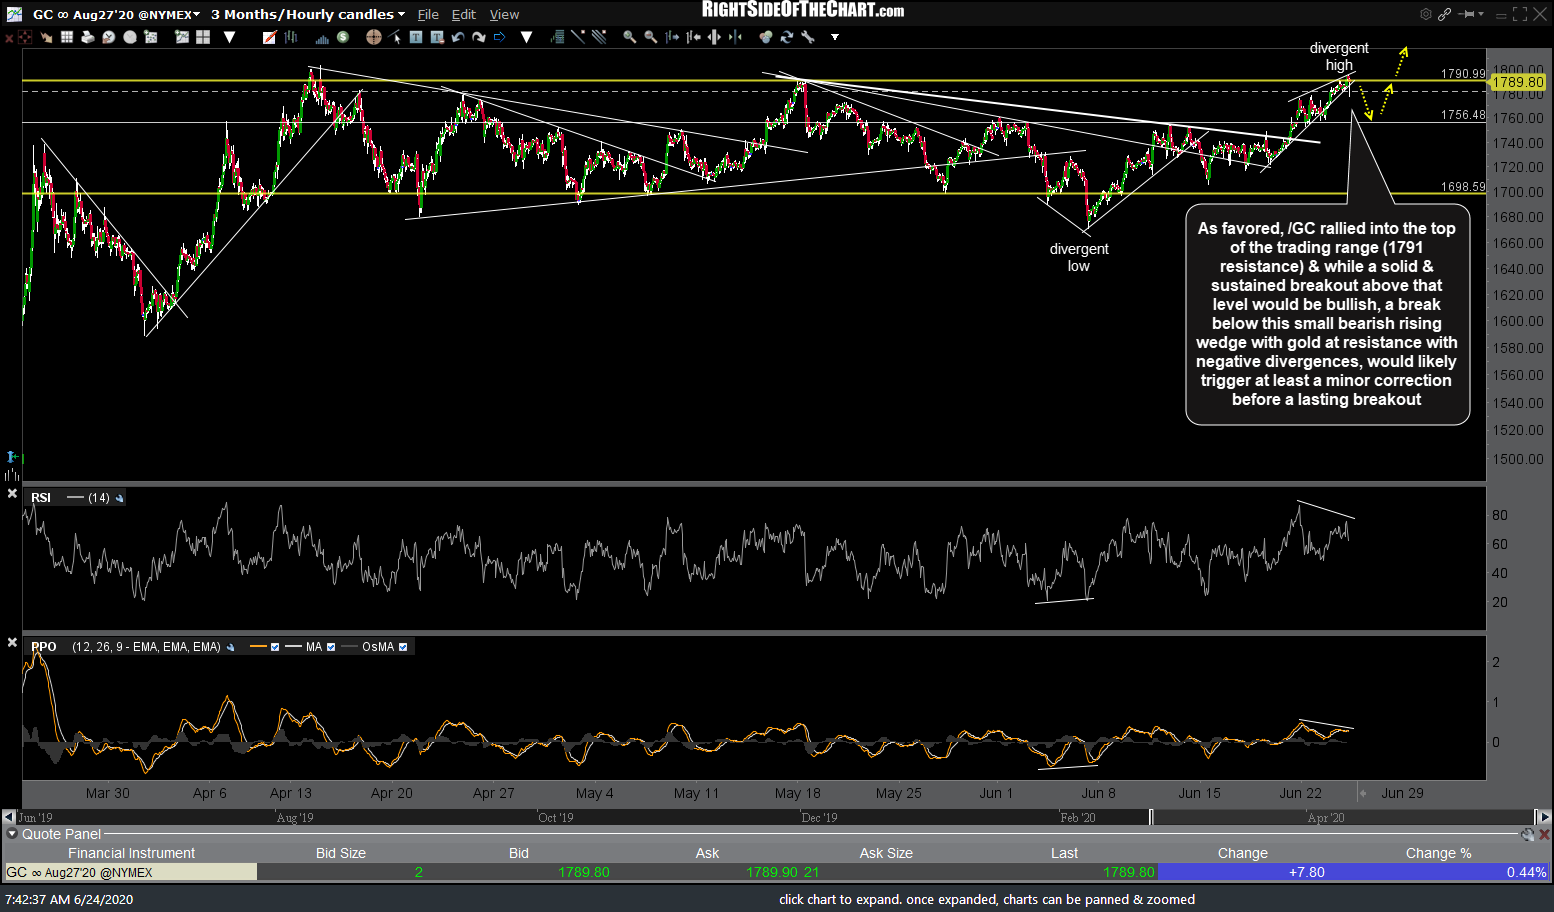
GC 60m June 24th
The previous 60-minute charts below, highlighting the recent bear trap/false breakdown below the trading range & divergent low, which was the catalyst for the 7%+ rally over the past few weeks. Note: Multiple images in a gallery format, as below, will not appear on email notifications but may be viewed on rsotc.com (short url). Click on first chart to expand, then use the arrow to advance to the next full-size chart.
-
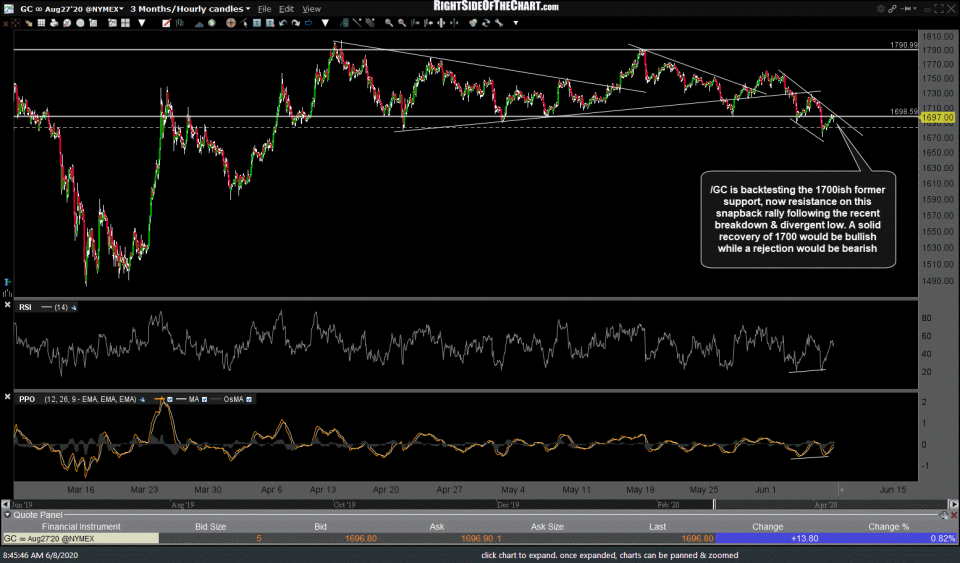
- GC 60m June 8th

-
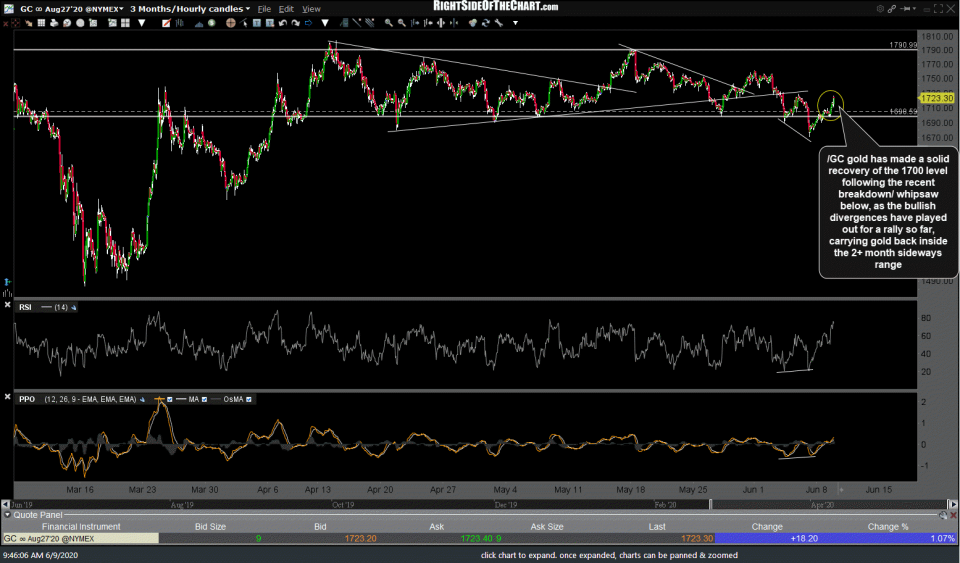
- GC 60m June 9th

-
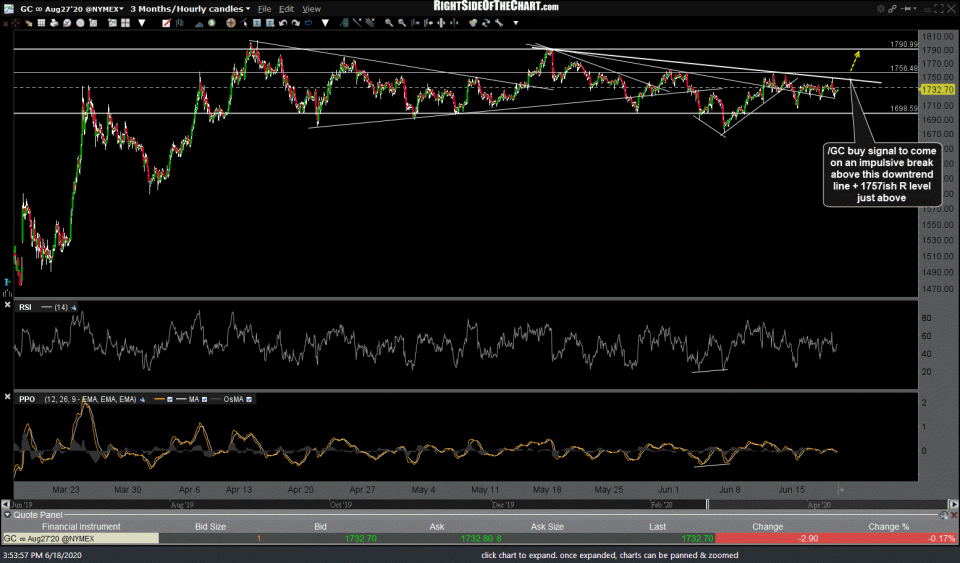
- GC 60m June 18th

-
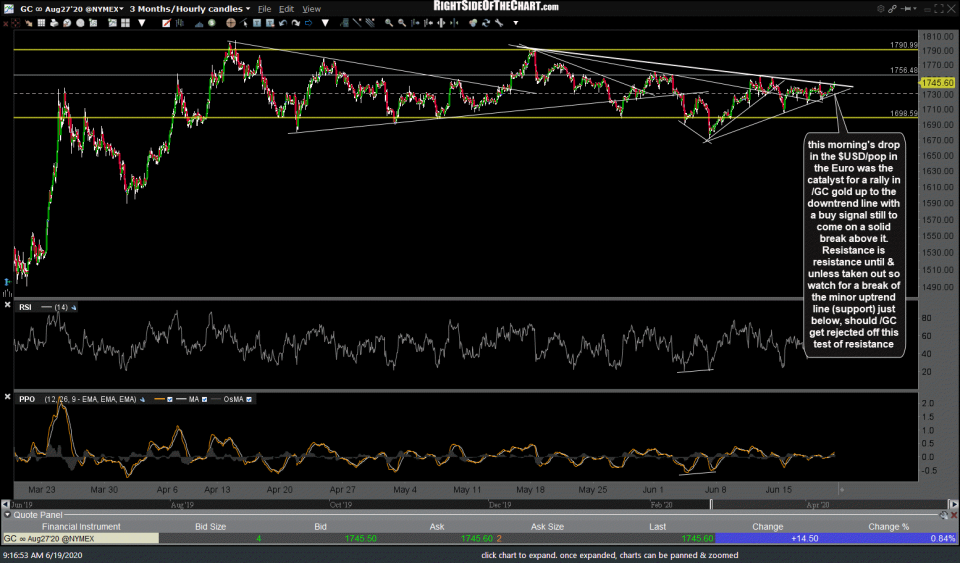
- GC 60m June 19th

-
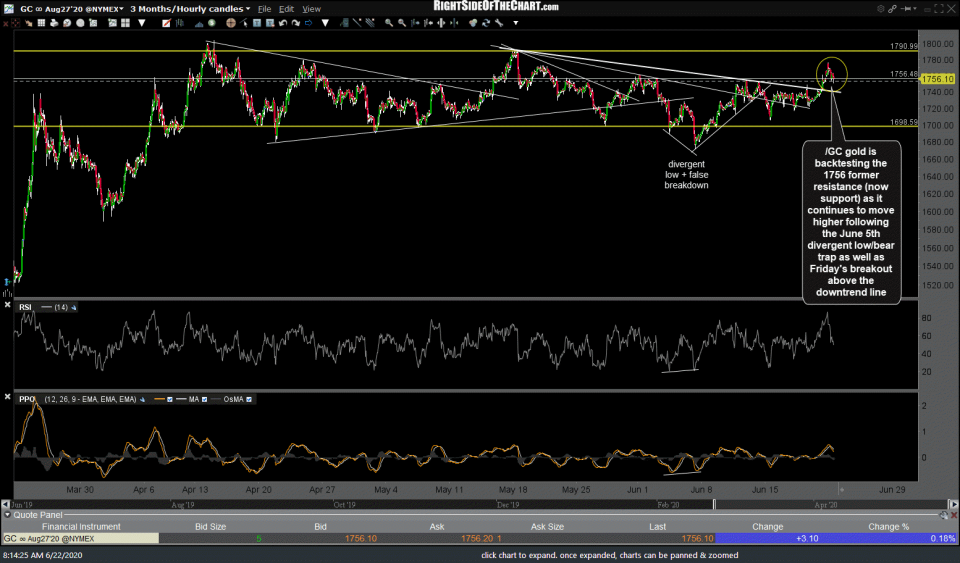
- GC 60m June 22nd

-

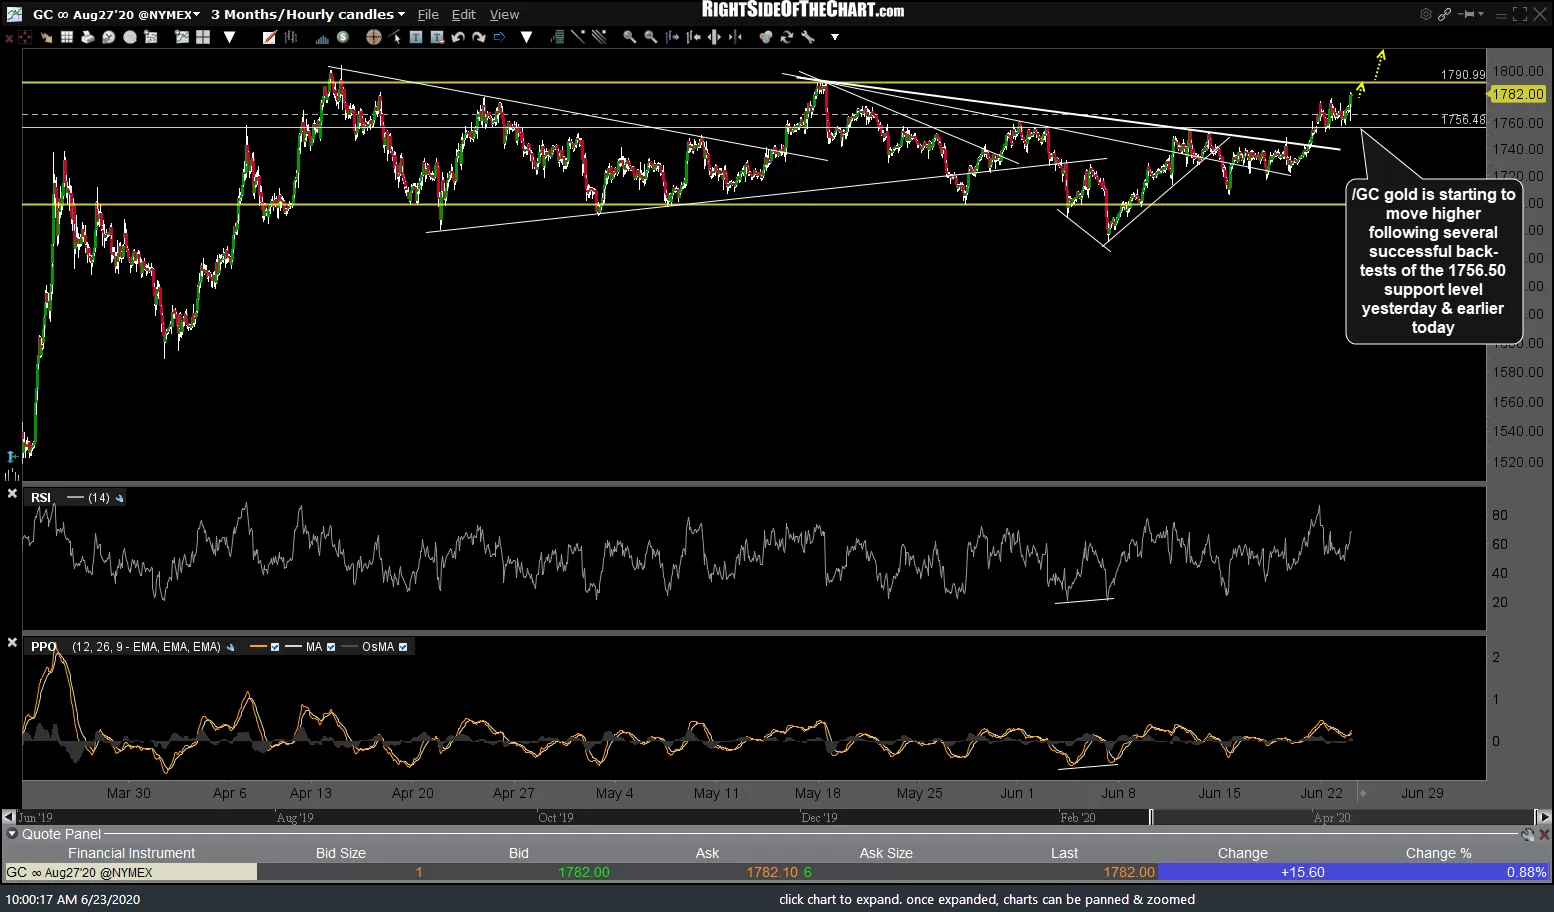
- GC 60m June 23rd
/SI (silver futures) remains in a near-term uptrend since the June 15th divergent low. However, a break below this bearish rising wedge pattern, which seems fairly likely, would likely take silver back down to at least the 17.736 support level.
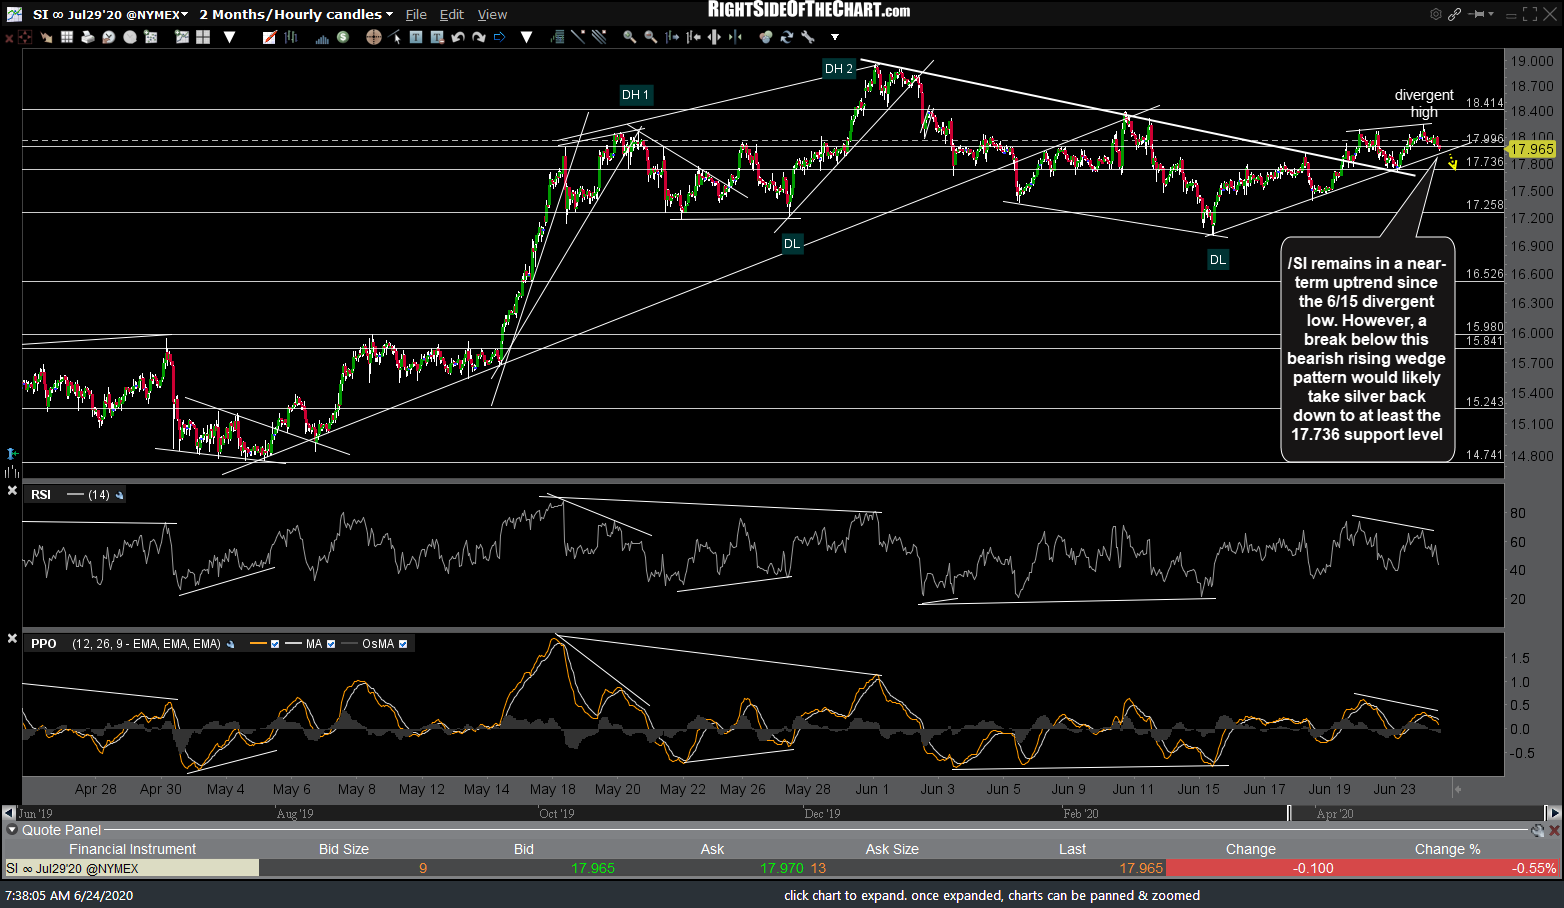
SI 60m June 24th
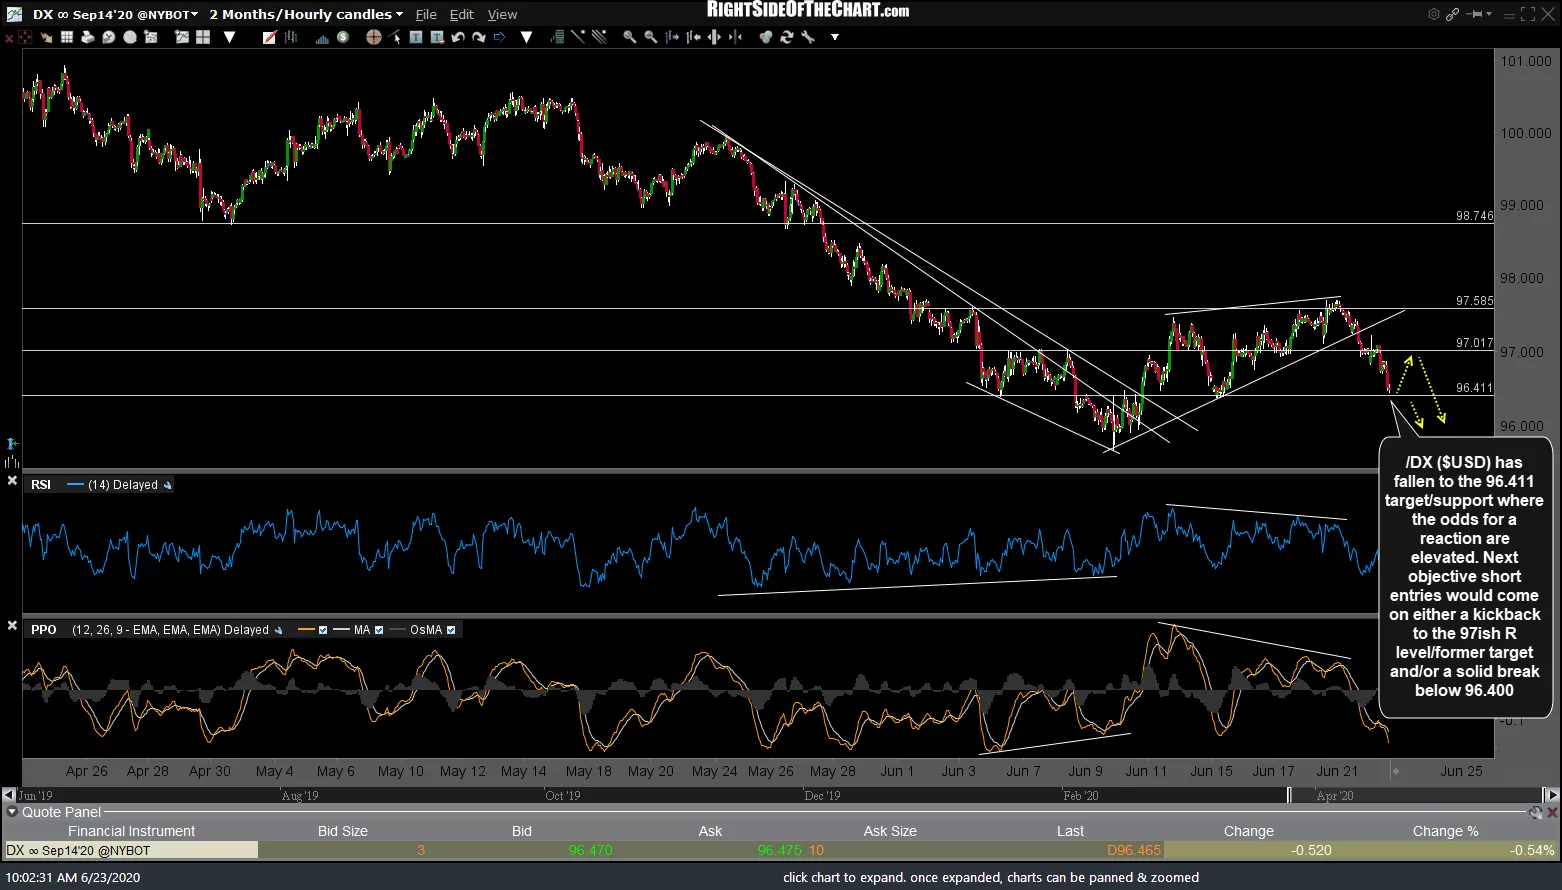
/DX ($US Dollar Index futures) reversed off the initial tag of the 96.411 target/support, bouncing from there to hit & reverse off the bottom of the 97ish resistance zone. The next sell signal to come on a solid break below yesterday’s low although it may chop around for a while before the next major leg down.
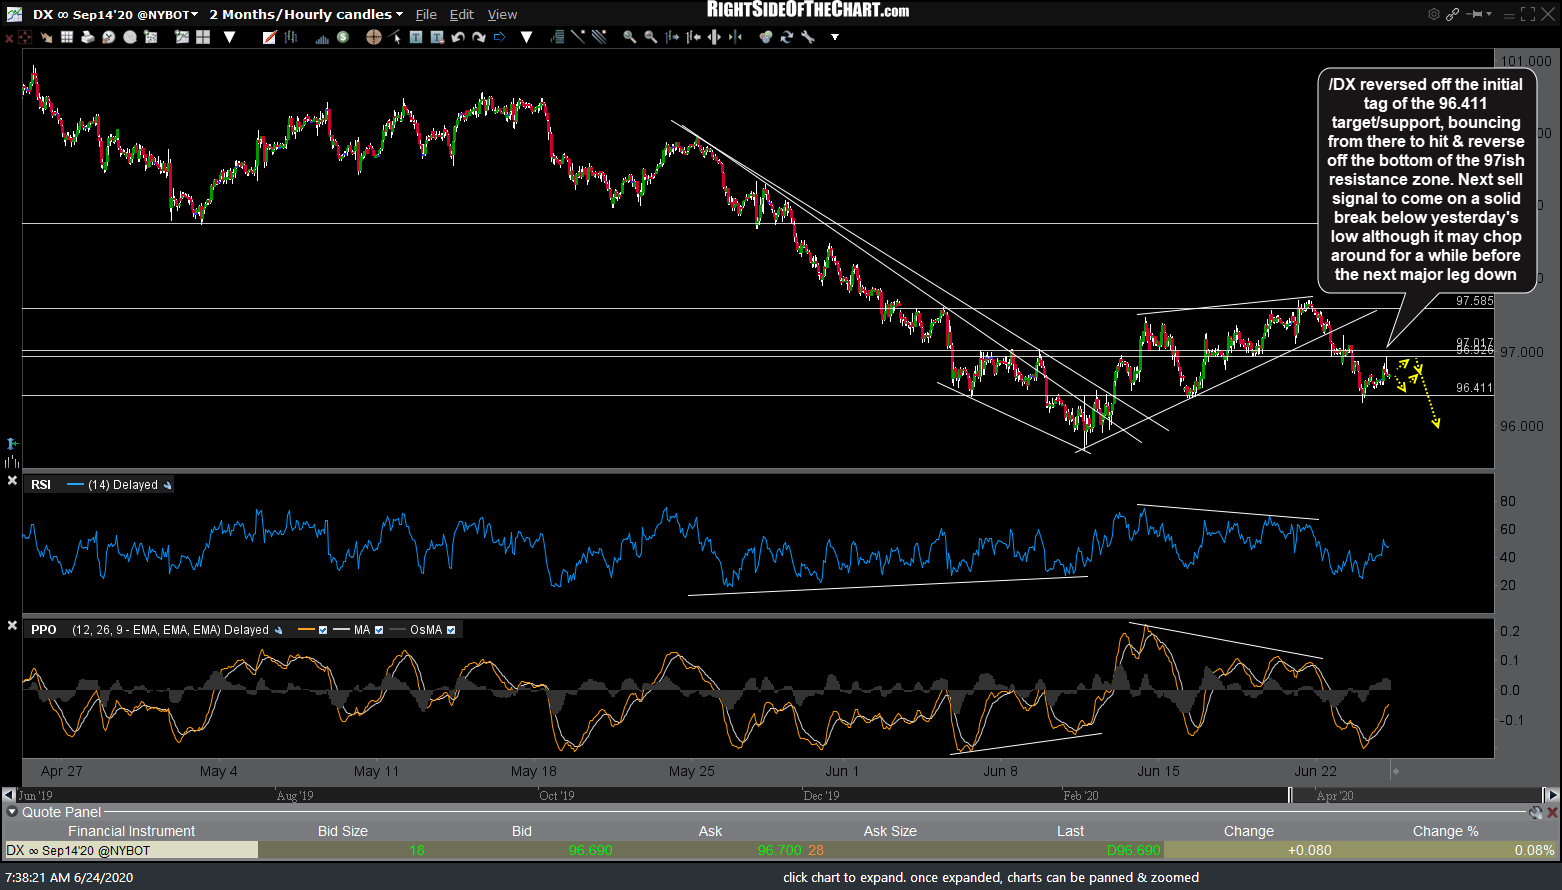
DX 60m June 24th
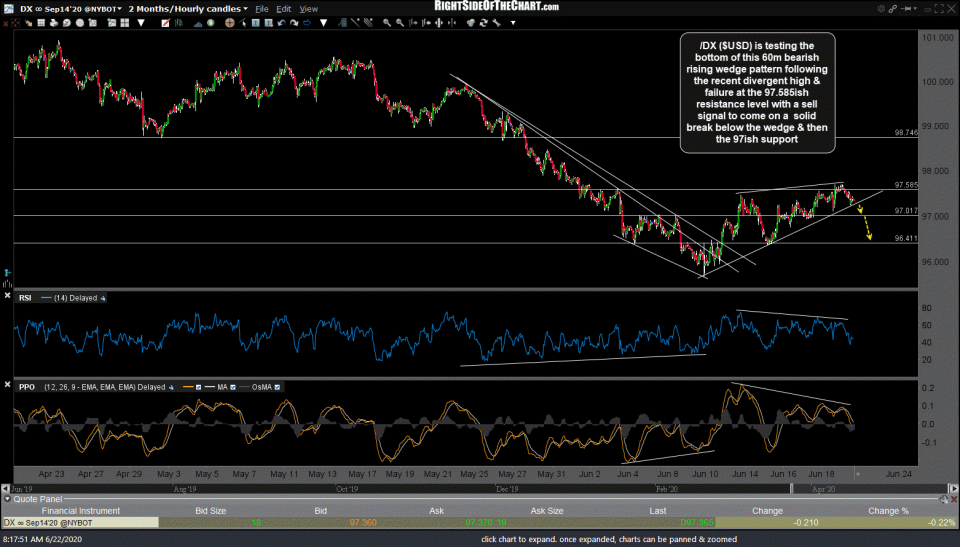
The string of previous 60-minute charts on /DX below illustrates how the rally into the 97.585 resistance, coupled with the negative divergences & bearish rising wedge pattern on the US Dollar, were able to be used to not only help predict a trend change/correction in the Greenback but also support the case for additional upside in gold & silver.
-
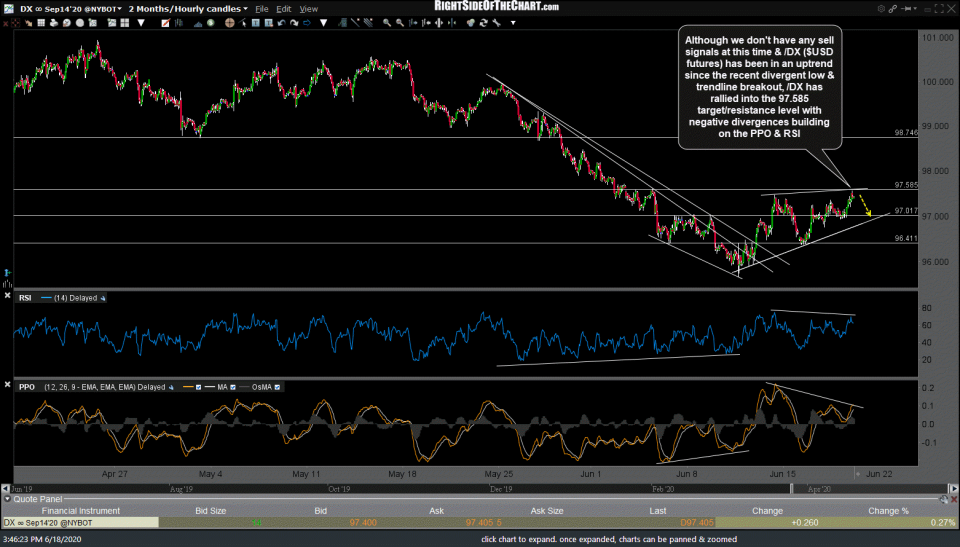
- DX 60m June 18th

-
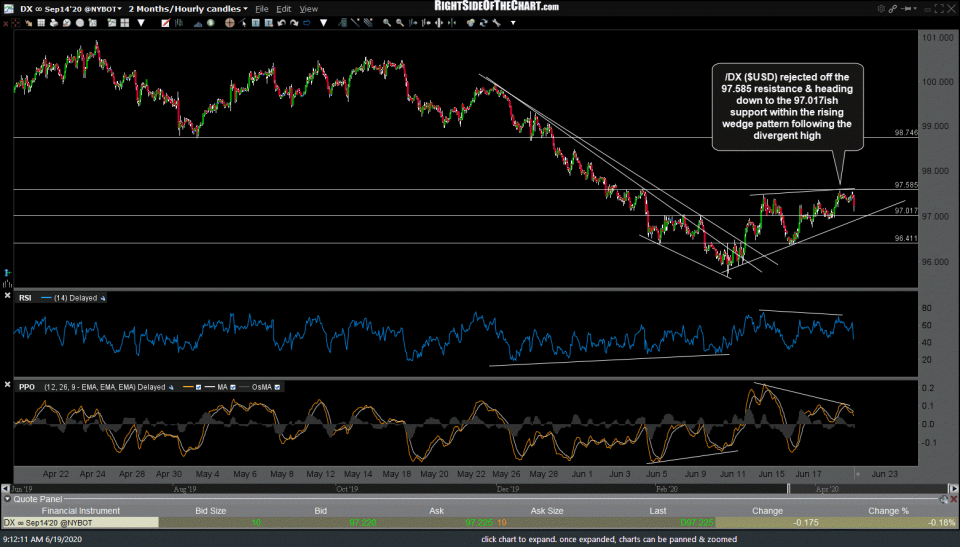
- DX 60m June 19th

-
- DX 60m June 22nd

-
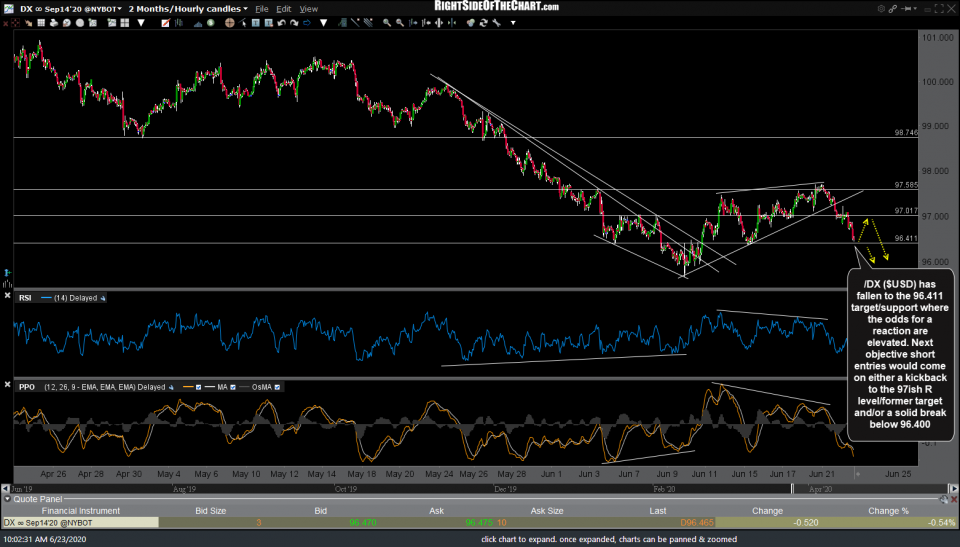
- DX 60m June 23rd