/GC (gold futures) has rallied 1½% off yesterday’s lows, taking out both downtrend lines as well as the 1504 resistance level (bullish) & is currently testing the 1512 resistance level. 60-minute chart:
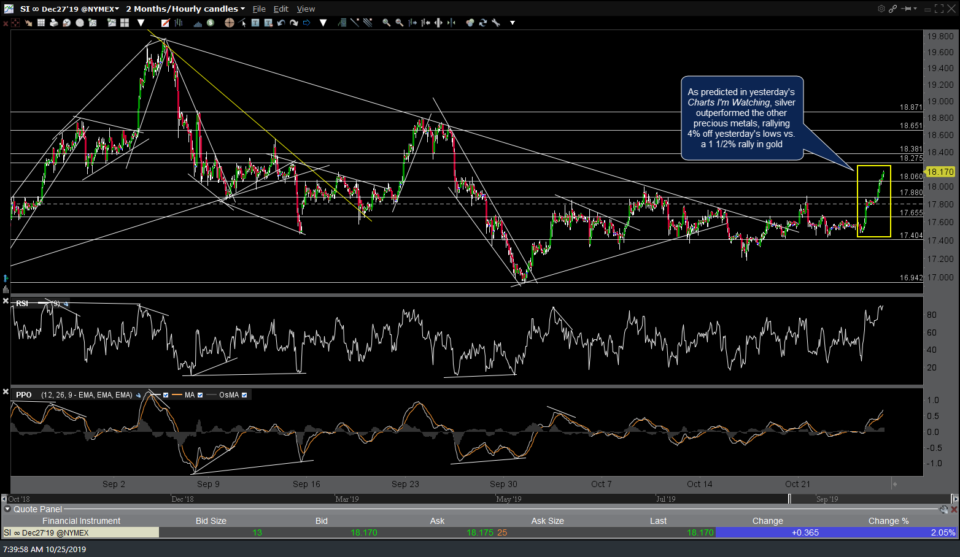
As predicted in yesterday’s Charts I’m Watching, silver outperformed the other precious metals by a wide margin, rallying 4% off yesterday’s lows vs. the 1½% rally in gold. /SI (silver futures) 60-minute chart below:
There are potential but unconfirmed divergences forming on /PL platinum following the recent breakout & rally above the 60m triangle pattern with the next target around 940.
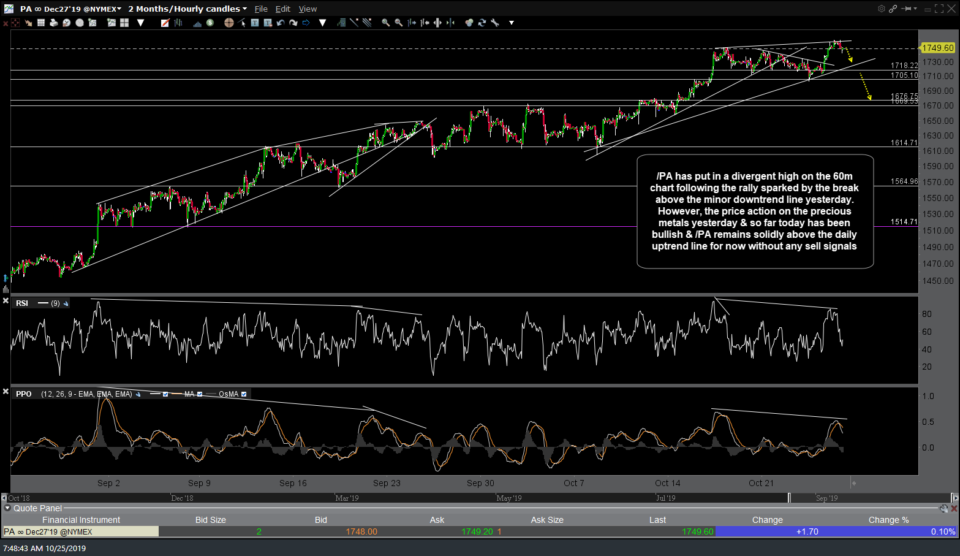
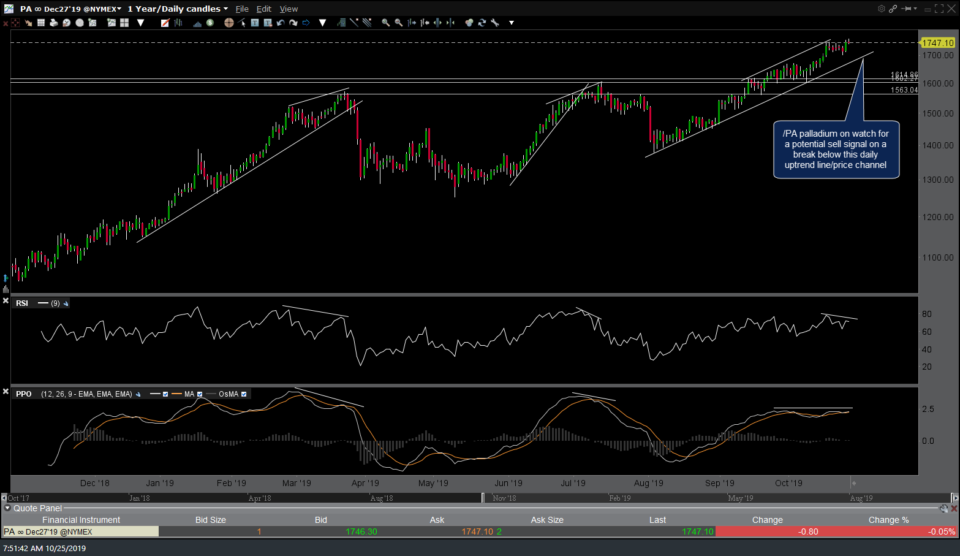
/PA palladium has put in a divergent high on the 60-minute chart following the rally sparked by the break above the minor downtrend line yesterday. However, the price action on the precious metals yesterday & so far today has been bullish & /PA remains solidly above the daily uptrend line for now without any sell signals. 60-minute & daily charts below:
- PA 60m Oct 25th
- PA daily Oct 25th
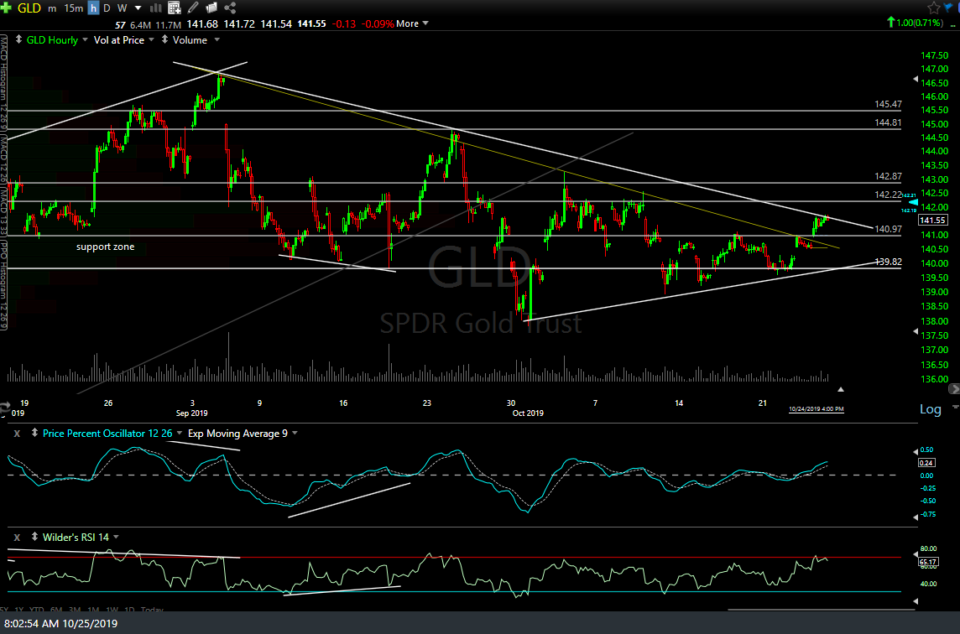
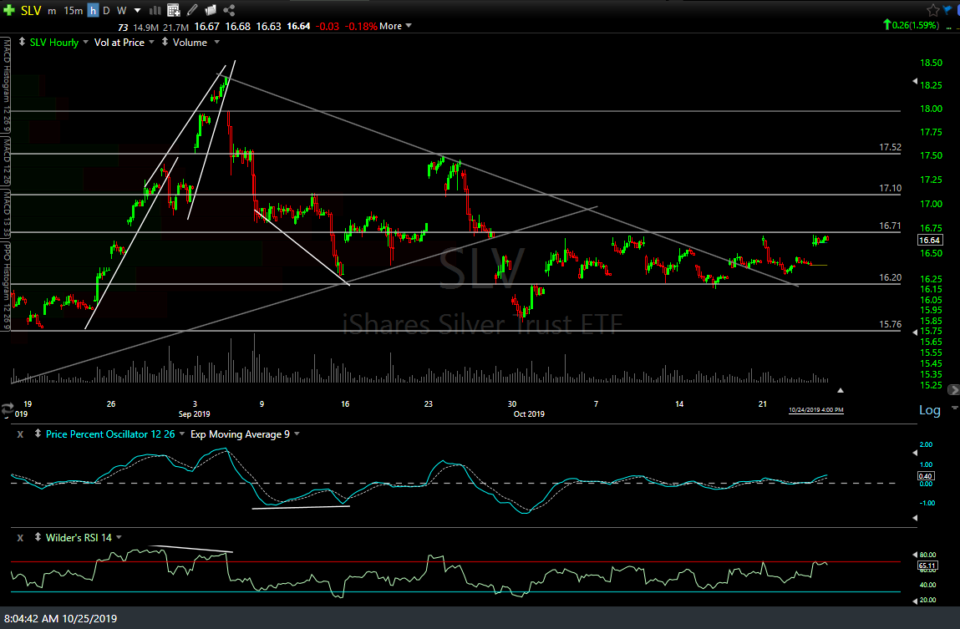
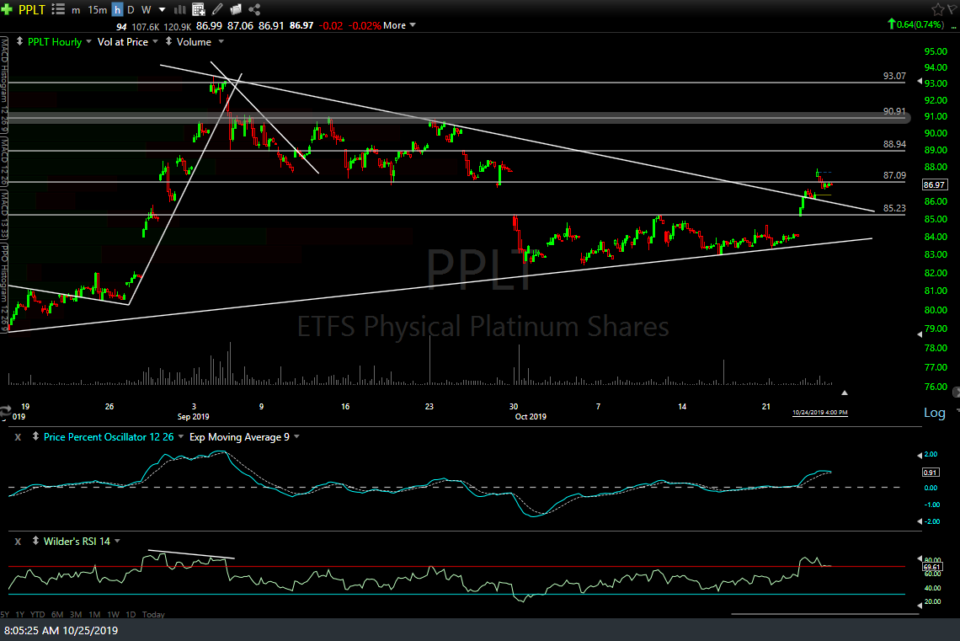
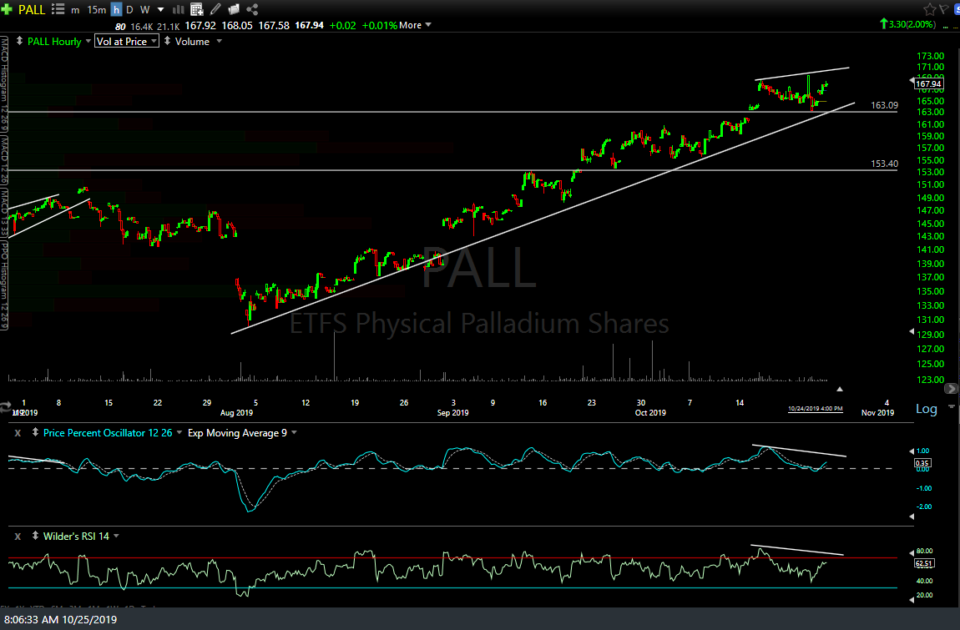
The 60-minute charts of GLD, SLV, PPLT & PALL (gold, silver, platinum & palladium ETFs) with some nearby support & resistance levels which could be used as potential price targets, pullback entries & stops are below.
- GLD 60m Oct 24th close
- SLV 60m Oct 24th close
- PPLT 60m Oct 24th close
- PALL 60m Oct 24th close
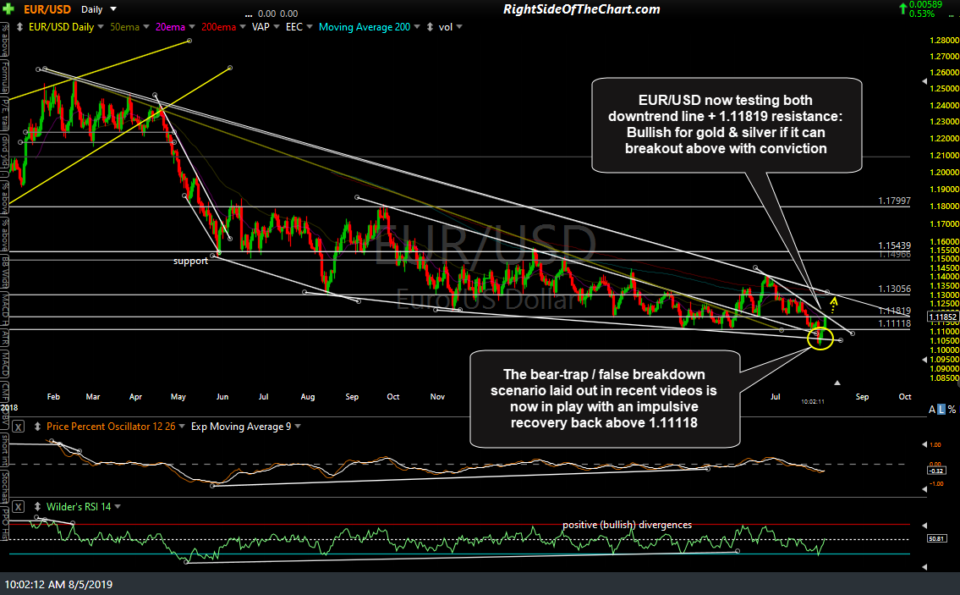
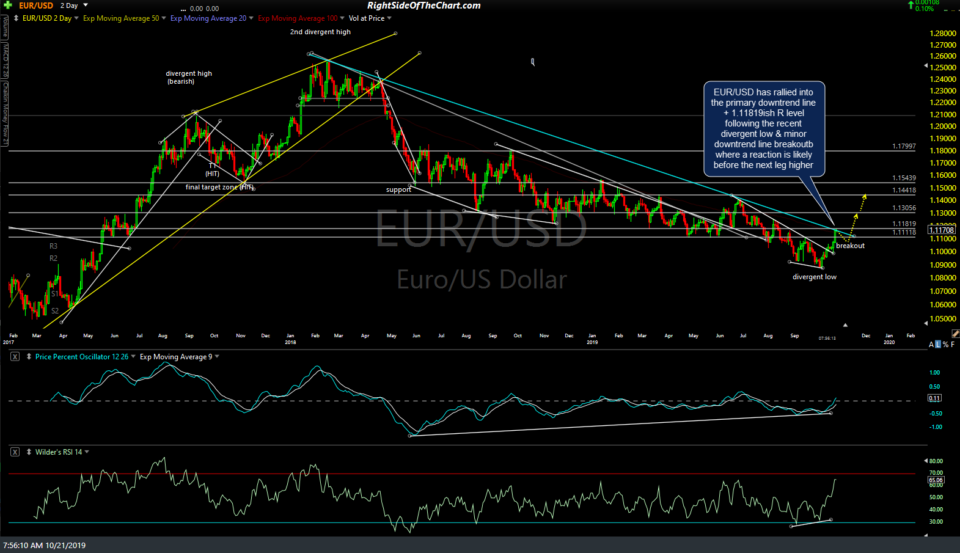
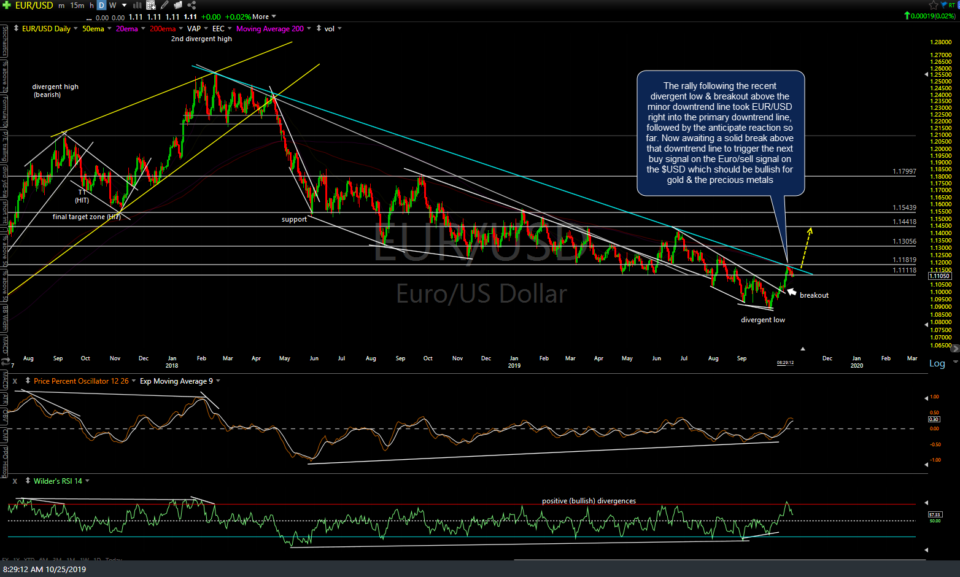
The rally following the recent divergent low & breakout above the minor downtrend line took EUR/USD right into the primary downtrend line, followed by the anticipated reaction so far. Now awaiting a solid break above that downtrend line to trigger the next buy signal on the €Euro/sell signal on the $USD which should be bullish for gold & the precious metals. Previous & updated daily charts below.
- EUR-USD July 29th screenshot
- EUR-USD daily Aug 5th
- EUR-USD 2-day Oct 21st
- EUR-USD daily Oct 24th close
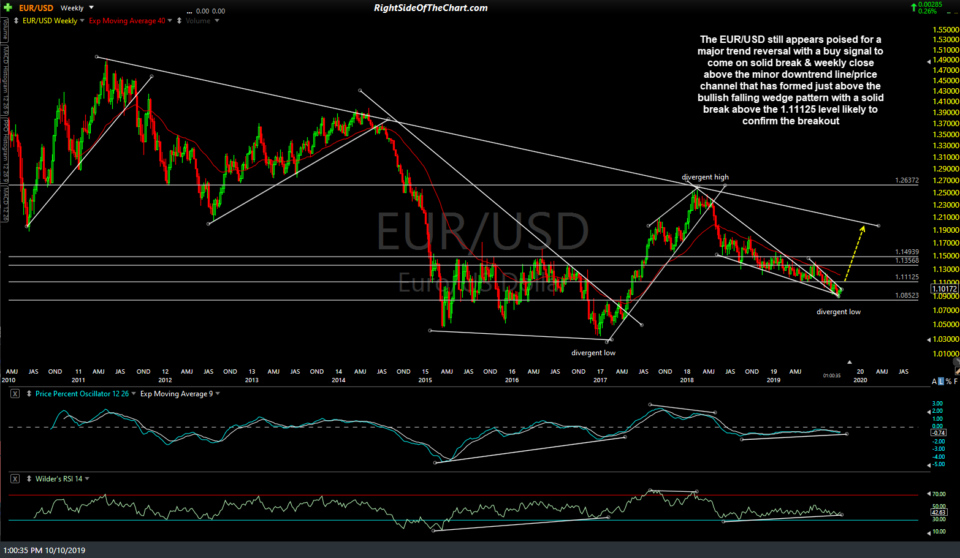
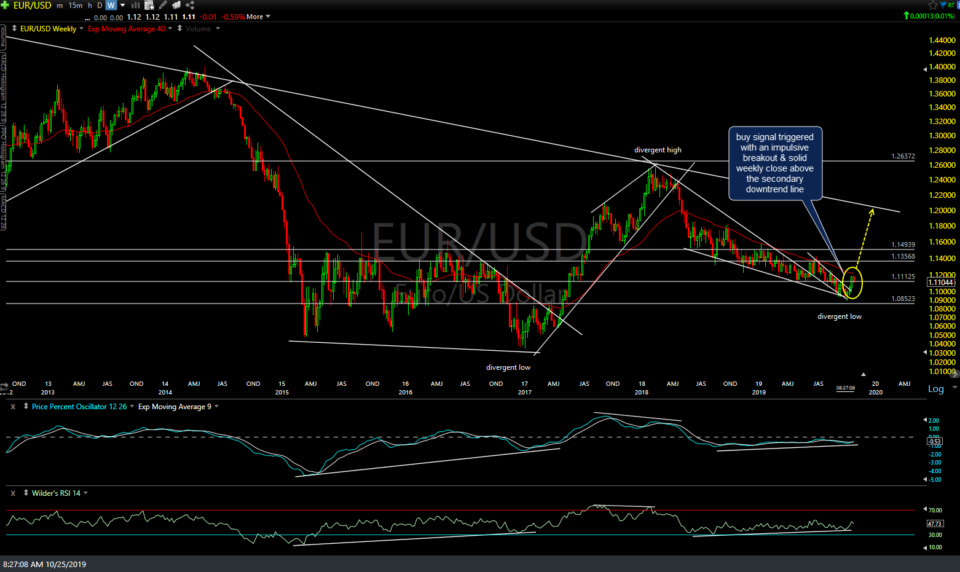
..and the previous & updated weekly charts, with the buy signal triggered with an impulsive breakout & solid weekly close above the secondary downtrend line below.
- EUR-USD weekly Oct 10th
- EUR-USD weekly Oct 24th close


