
Gold futures (/GC) have bounced off the 1304 minor support level while also breaking above a minor downtrend line/bullish falling wedge on the 60-minute time frame. The bullish divergences on the RSI have been negated but are still intact on the MACD. Watching for additional confirmation of a potential bottom & resumption of the uptrend.

GC 60-minute Sept 19th
Assuming that the correction in gold is complete, then the gold mining stocks will most likely resume their uptrend as well. The daily chart of GDX still looks very constructive following the early August breakout & impulsive rally above the downtrend line which followed the divergent low back in July.
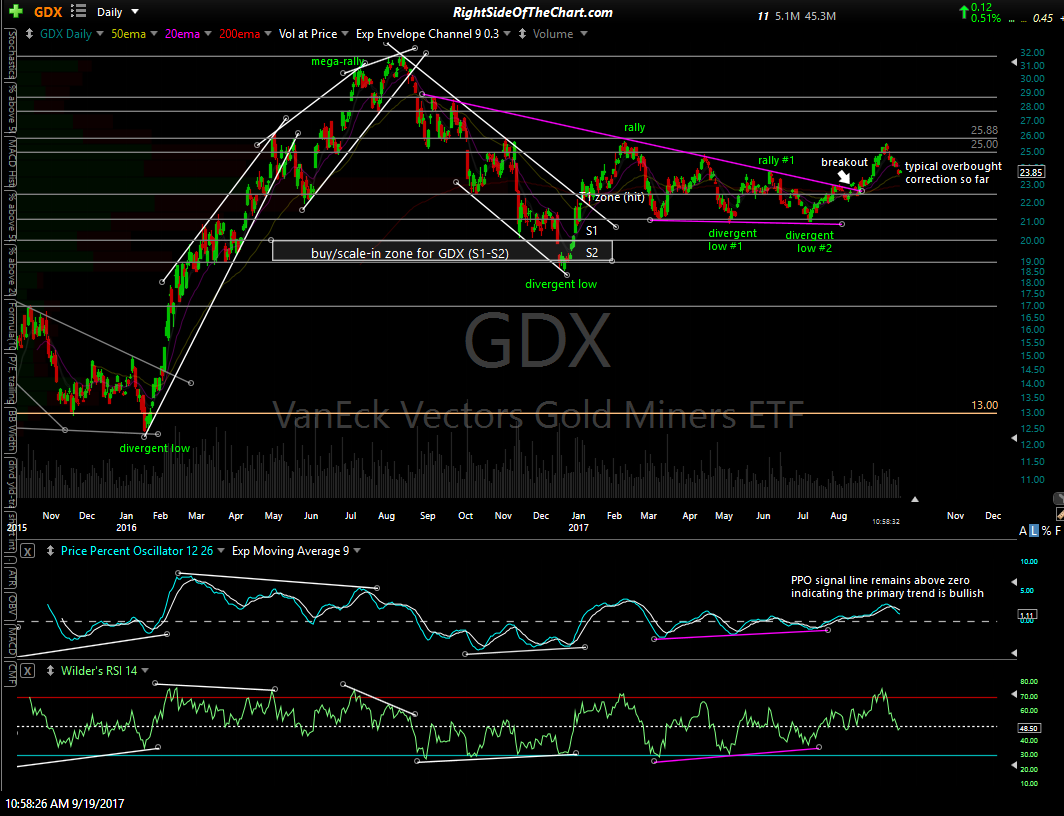
GDX daily Sept 19thGDX
Zooming down to the 60-minute time, it appears that the first objective buy signal on GDX will come on a break & 60-min close above this descending price channel with buy signal #2 on a break & 60-min close above the 24.15 R level (assuming the charts of gold confirm at the time).

GDX 60-min Sept 19th
Last but certainly not least, as I like to align my analysis of gold with the outlook for the US Dollar, the charts of EUR/USD confirm my analysis on gold with a likely trend change pending a break below this daily uptrend line. (edit: Please see the comment section below this post for corrections made on this chart as well as the implications of a breakdown below this trendline in EUR/USD, which would be bearish for gold, not bullish).
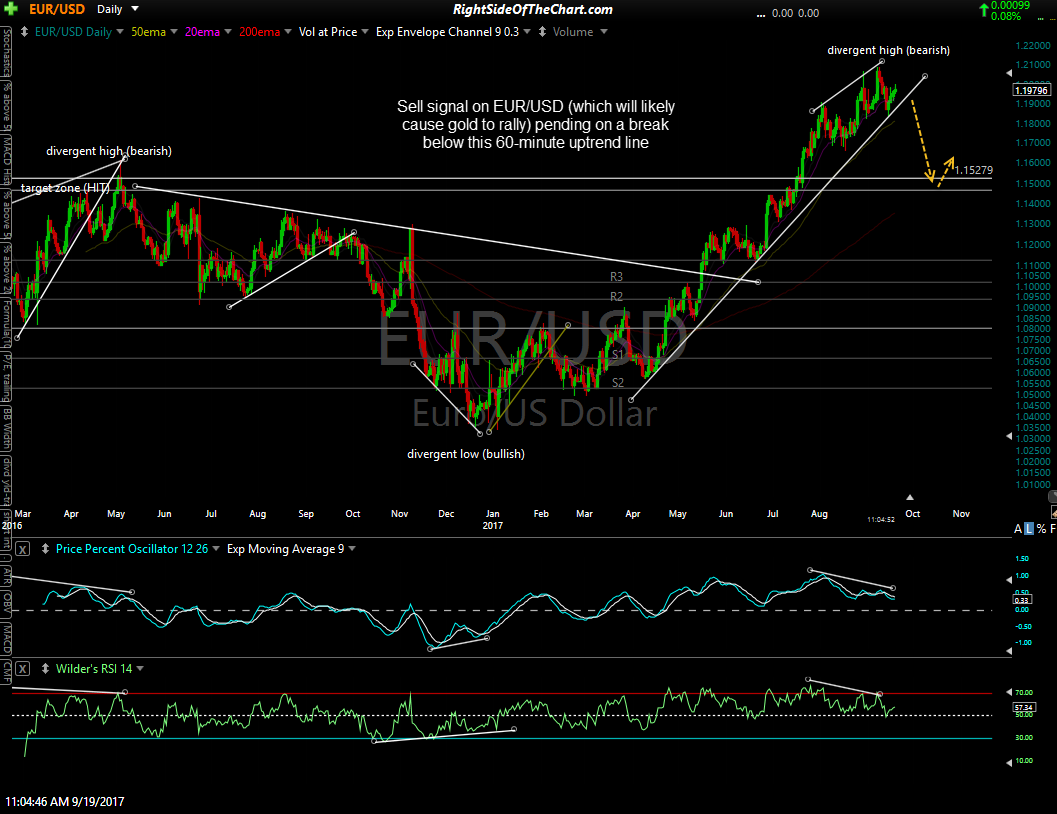
EUR-USD daily Sept 19th