
Let’s take a quick look at some of the major global stock markets from a longer-term perspective (10-year weekly charts). Starting with the S&P 500, with prices recently rolling off the top of the large broadening wedge pattern as well as the recent bearish cross on the weekly PPO, along with many other factors, it looks like the SPX is headed to at least the 1820 support level in the coming weeks to months.

S&P 500 10-year weekly Sept 18th
By nearly all accounts, it appears that the 29% bear market in the Tokyo Nikkei Index since the mid-2015 highs doesn’t appear to be over. Note how the weekly PPO trading solidly below the zero line helps to confirm that the primary trend remains bearish despite the recent oversold bounce/bear market rally.
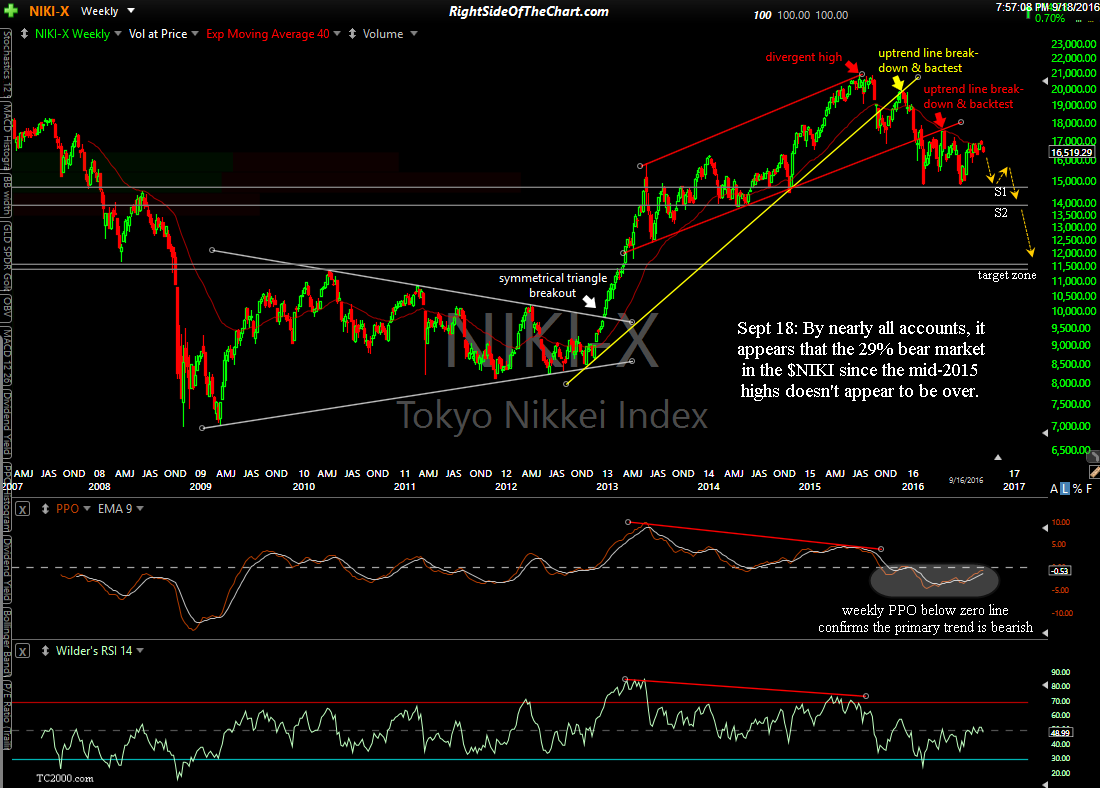
Nikkei 10-year weekly Sept 18th
The Sydney All Ordinaries Index has been moving lower since backtesting the recently broken primary bull market uptrend line & appears likely to continue lower in the coming weeks to months, especially in light of the recent bearish crossover on the weekly PPO, which often indicates more downside to come for weeks to months.
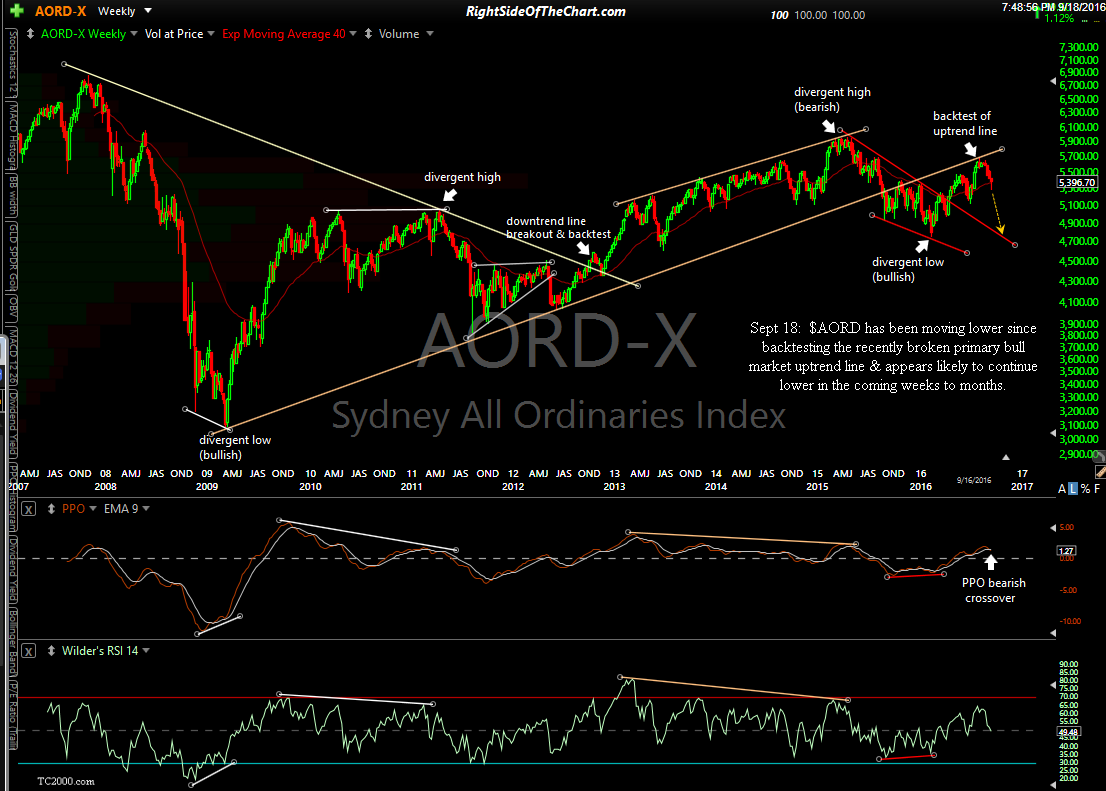
All Ordinaries Index 10-year weekly Sept 18th
The recent bearish crossover & overbought readings on the weekly time frame help to support the case that the TSX Composite Index is likely headed lower in the coming weeks to months. Continued weakness in oil & gold prices will only further support the bearish case for the Canadian economy.
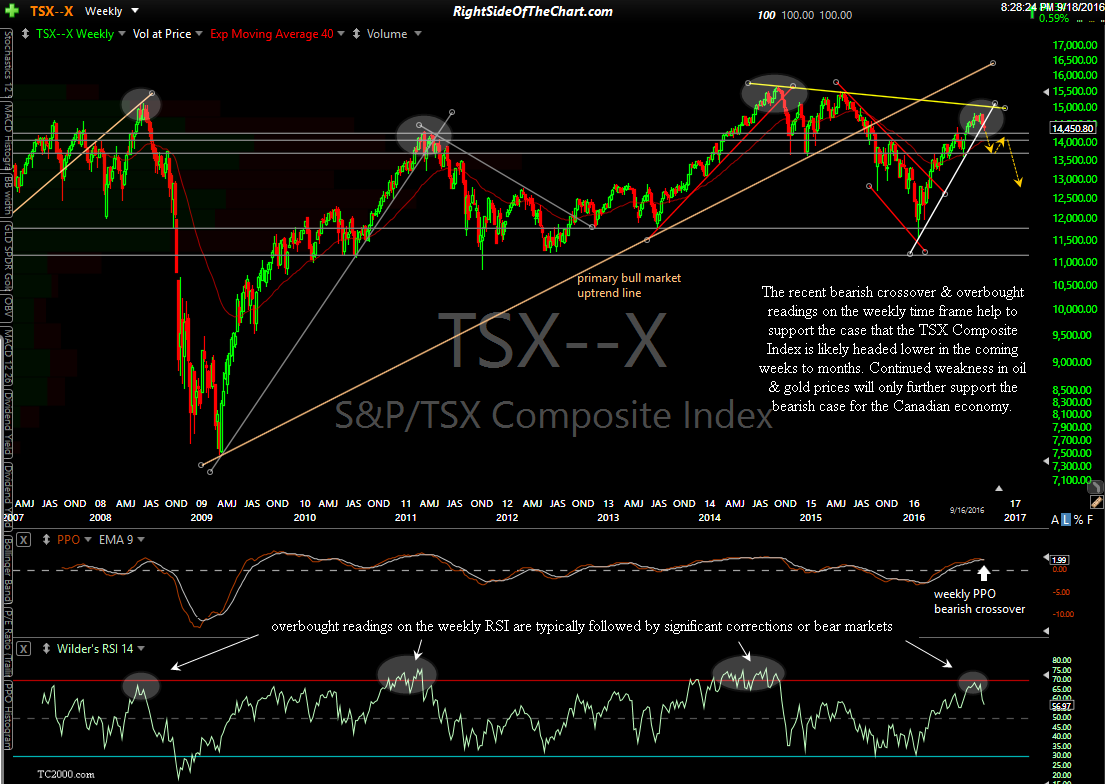
TSX Composite Index 10-year weekly Sept 18th
A break & weekly close below this yellow primary bull market uptrend line will likely bring the Dax to at least the 8000 level in the coming months. Note the recent failed breakout/bull trap.
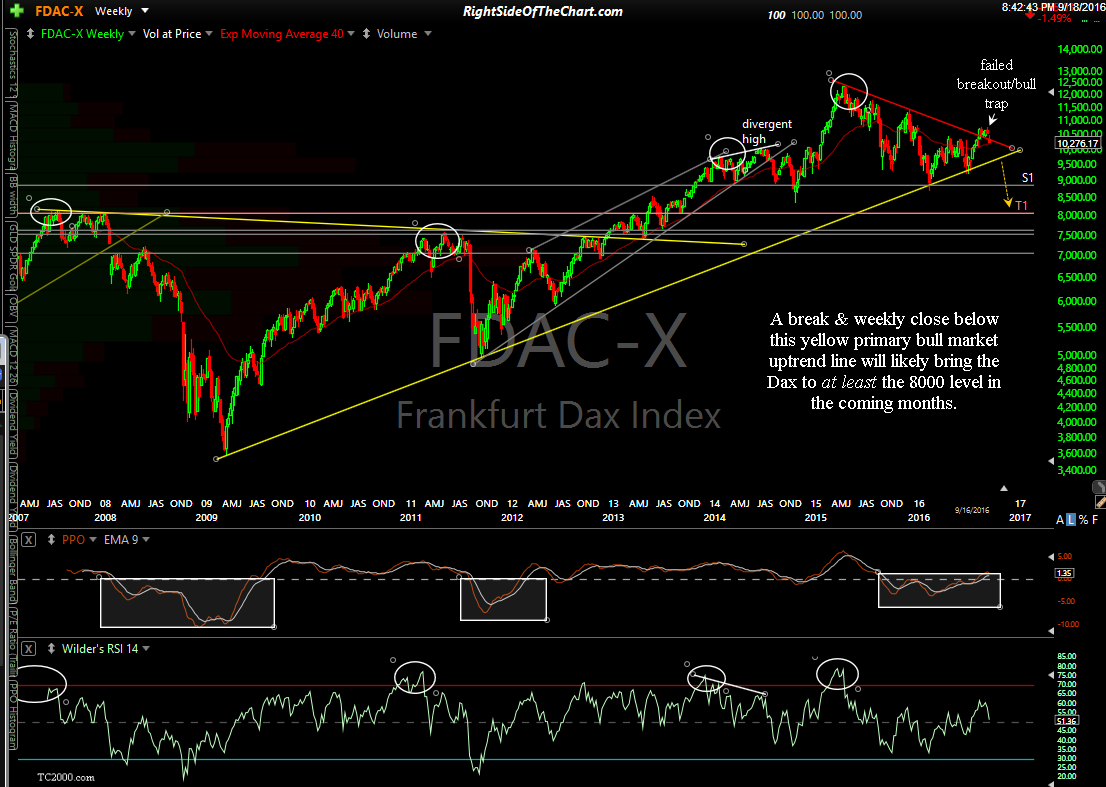
Frankfurt Dax Index 10-year weekly Sept 18th