
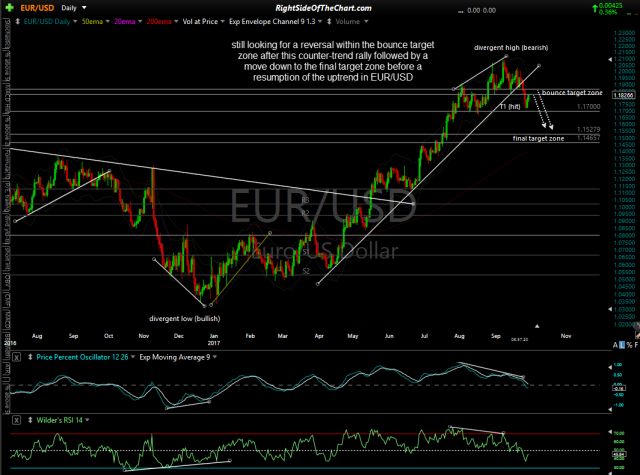
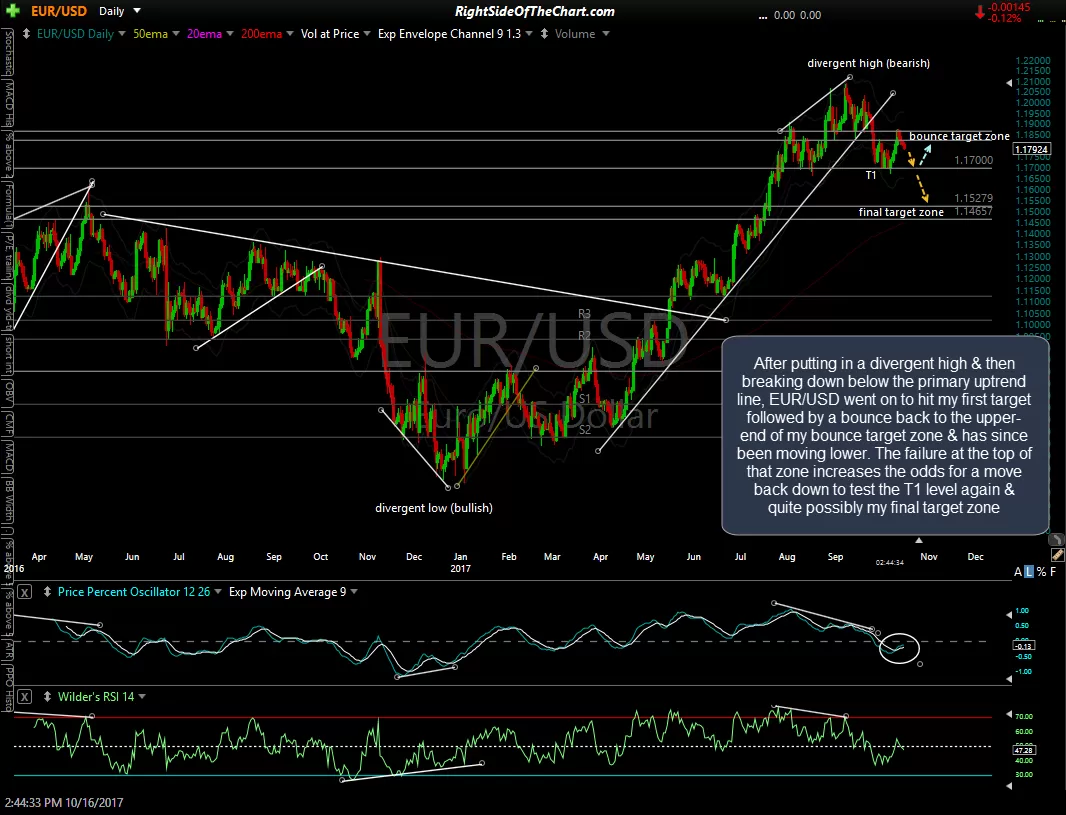
Regarding the outlook for gold & the precious metals sector, one hardly needs to include a chart either GLD or GDX as the charts of EUR/USD are often sufficient to assess the outlook for gold, which has a strong direct correlation with gold prices. After putting in a divergent high & then breaking down below the primary uptrend line, EUR/USD went on to hit my first target followed by a bounce back to the upper-end of my bounce target zone & has since been moving lower. The failure at the top of that zone increases the odds for a move back down to test the T1 level again & quite possibly my final target zone. Previous & updated daily charts on €EUR/$USD:
-

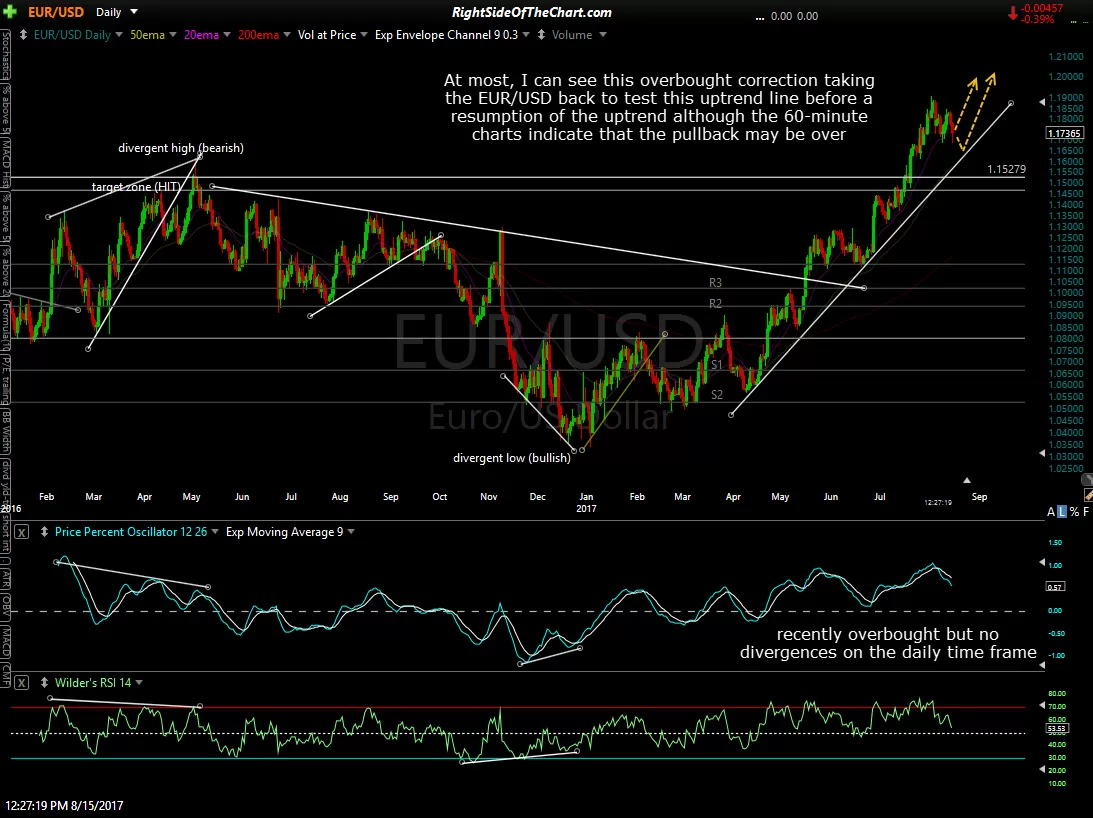
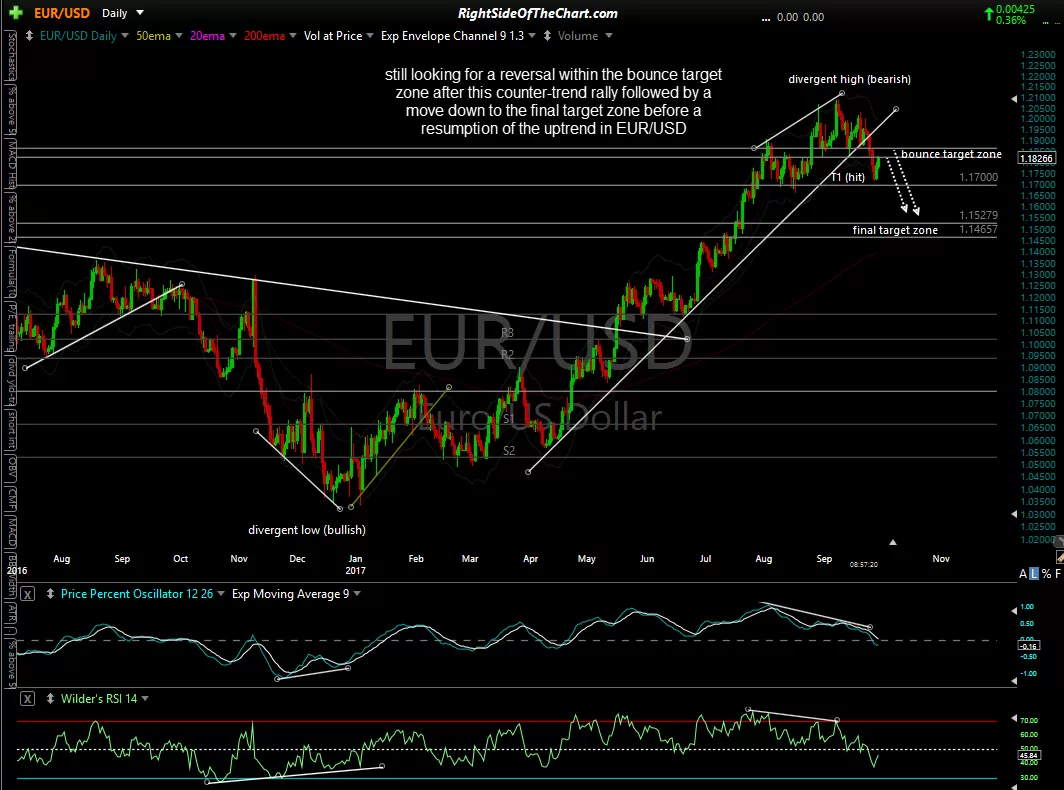
- EUR-USD daily Aug 15th
-
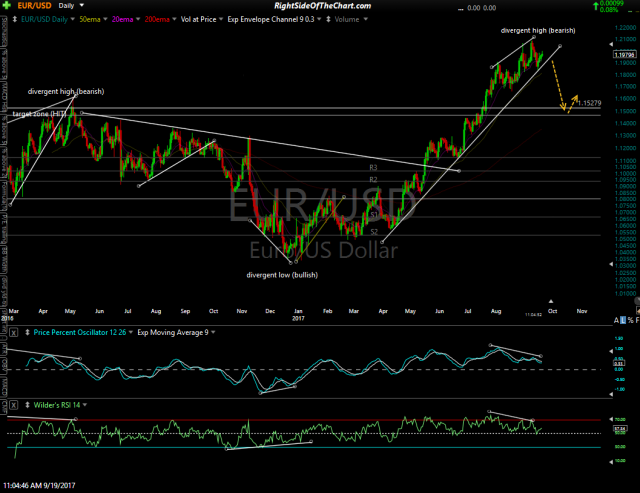
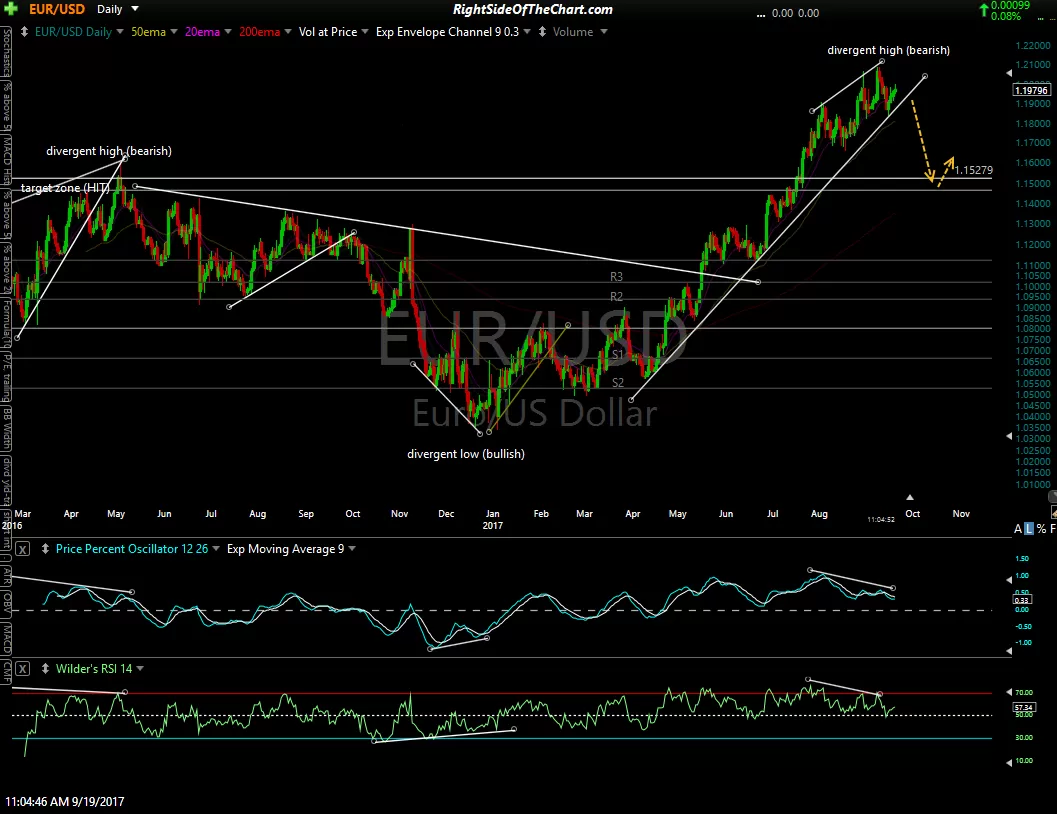
- EUR-USD daily Sept 19th
-
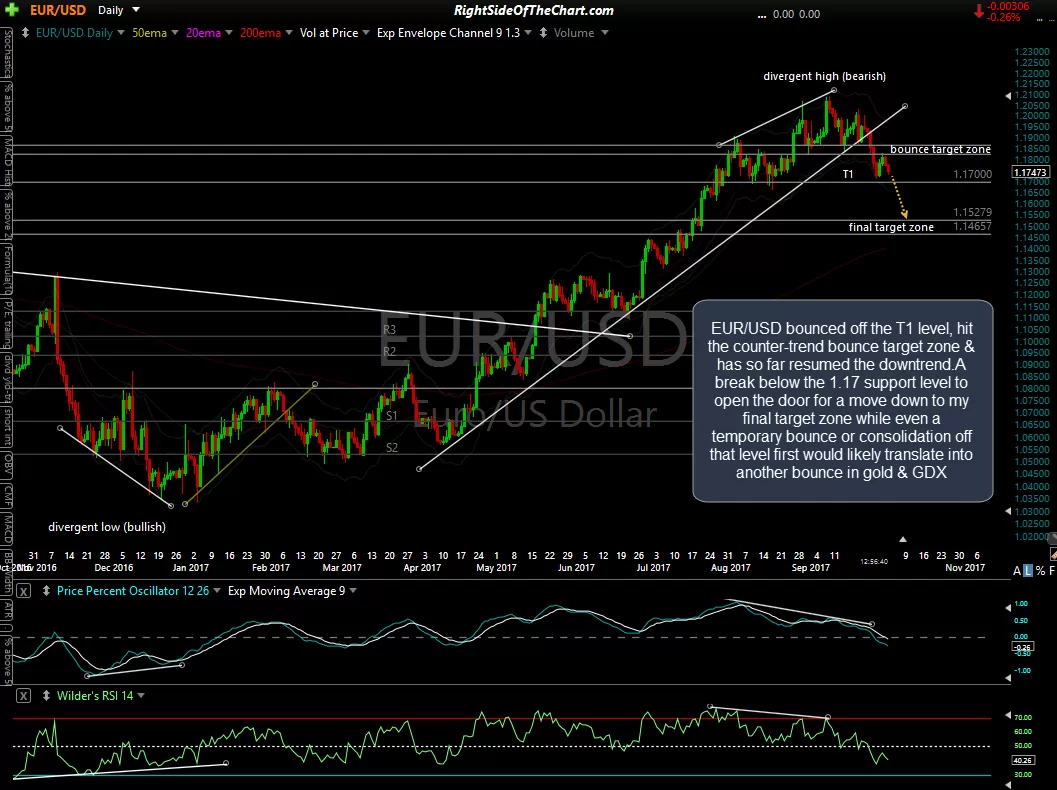
- EUR-USD daily Sept 29th
-

- EUR-USD daily Oct 2nd
-
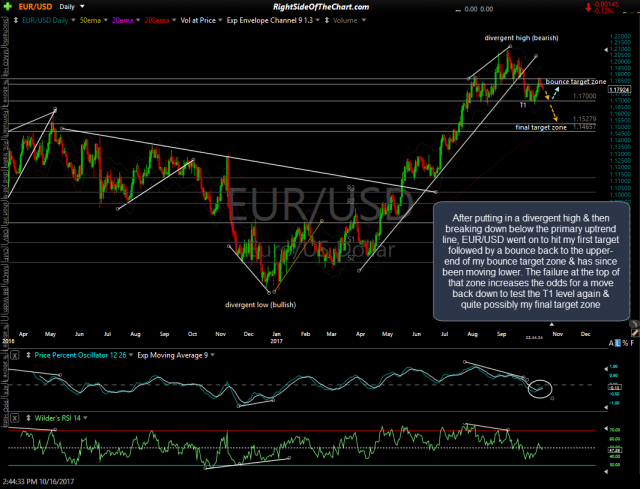
- EUR-USD daily Oct 16th
Of course, there are the occasional disconnects between the (inverse) correlation of gold & the US Dollar so best to use the outlook for the dollar to confirm or refute your analysis on gold. The chart below is the 60-minute chart of /GC, gold futures. Gold has recent put in a confirmed divergent high, which is bearish, and has started moving lower along with the EUR/USD. Based on the scope of these divergences along with the fact that the EUR/USD pair continues to play out as the charts have reflected for months now, it appears that the near-term outlook for gold is bearish at this time (although the odds favor at least a minor bounce off the 1292.90 level where /GC has just fallen to… see scenario below).
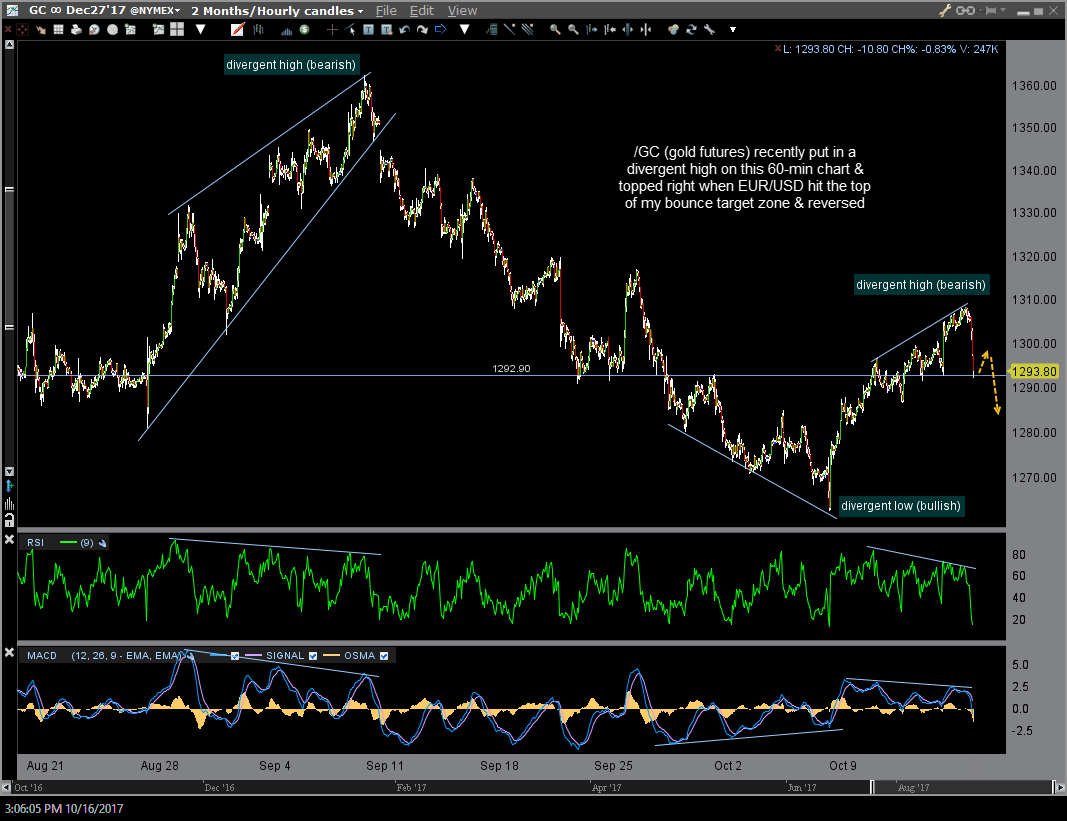
$GC 60-min Oct 16th
Should EUR/USD reverse on or before the former T1 level (1.17) and go on to take out last week’s highs with conviction, that would indicate that the correction in both gold & the EUR/USD is likely over whereas should EUR/USD continue to fall in the coming days, I’ll be watching for either a second, successful test of the 1.17 level (bullish) or a impulsive break below (bearish) which would likely bring the currency pair, and gold along with it, down to my final target zone around 1.153 – 1.146.