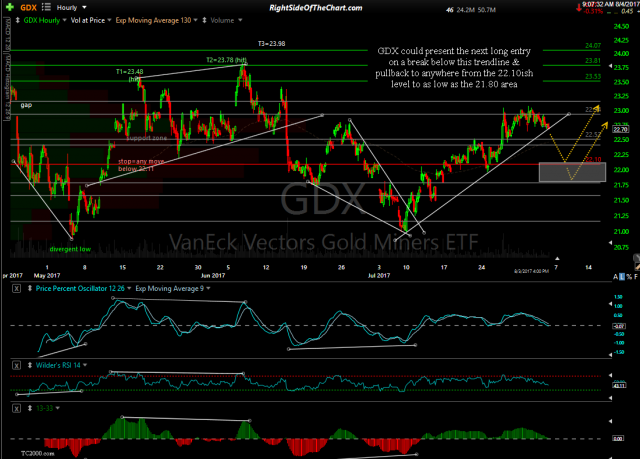
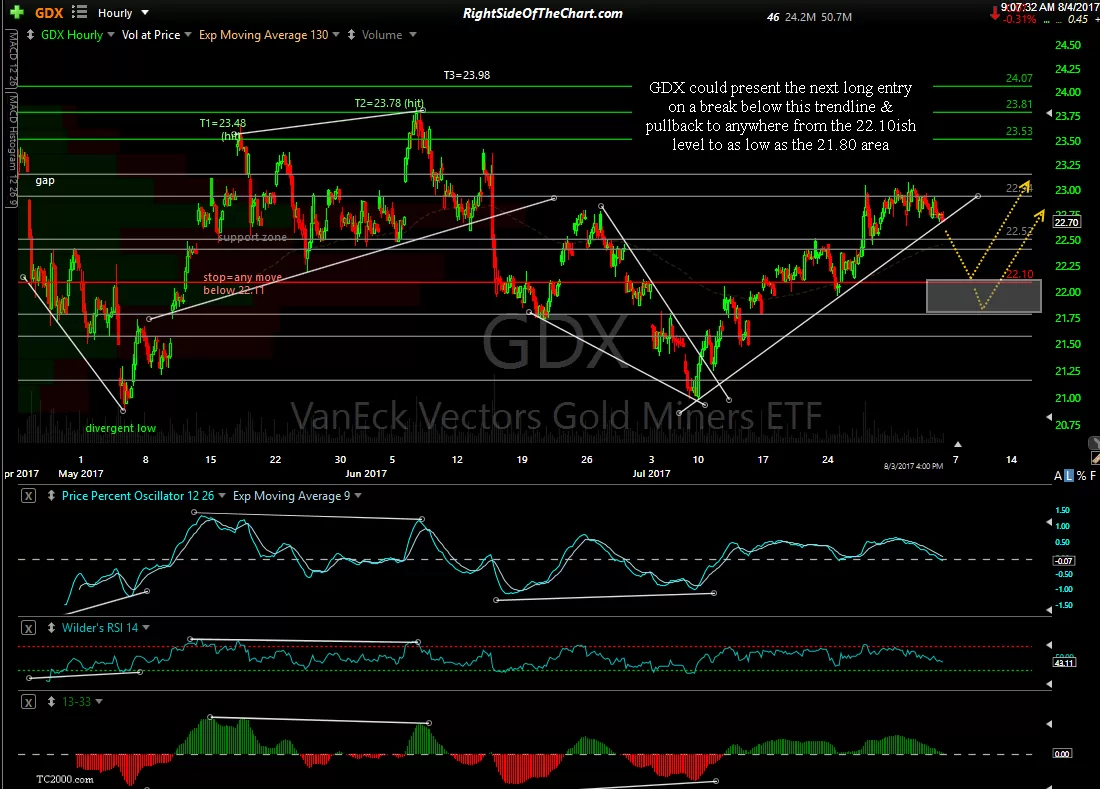
We had a few significant technical developments in GLD (gold ETF), GDX (gold miners ETF) & the EUR/USD (Euro/US Dollar pair) both yesterday & so far today which could indicate that the anticipated correction in gold & the Euro may have run its course. The first chart on each below is from Friday’s post, Watching US Dollar, Euro & Gold for Trade Entry On GDX, followed by the updated charts.
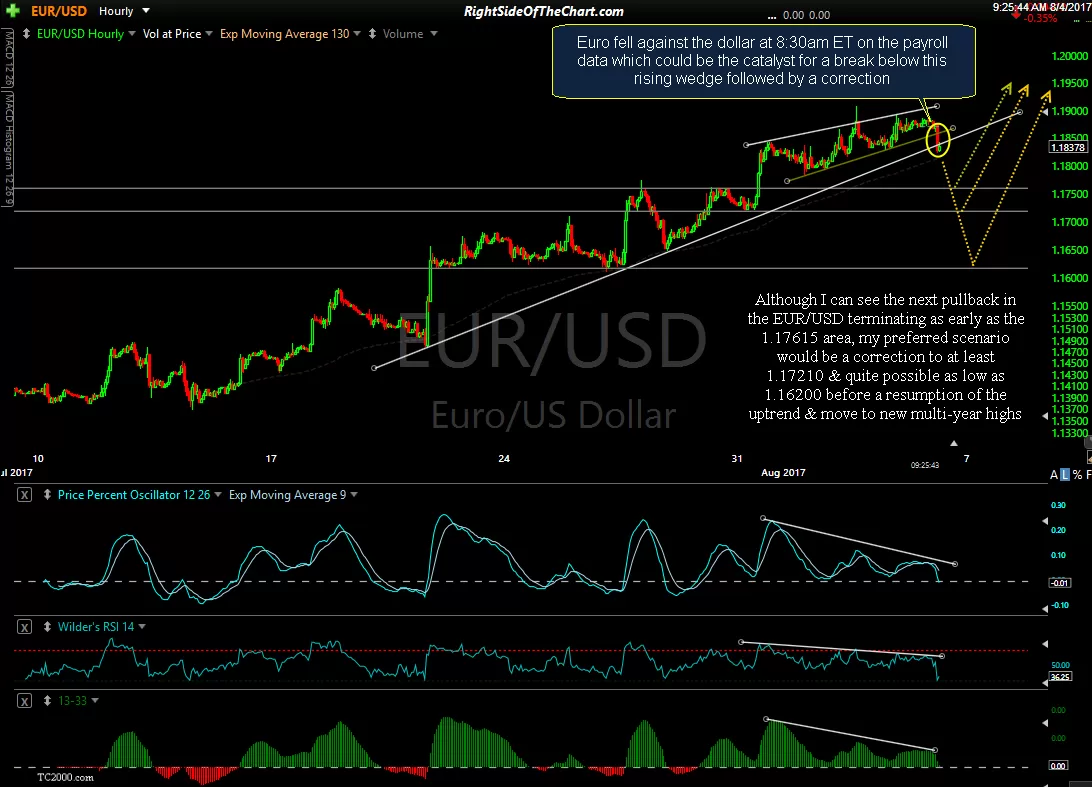
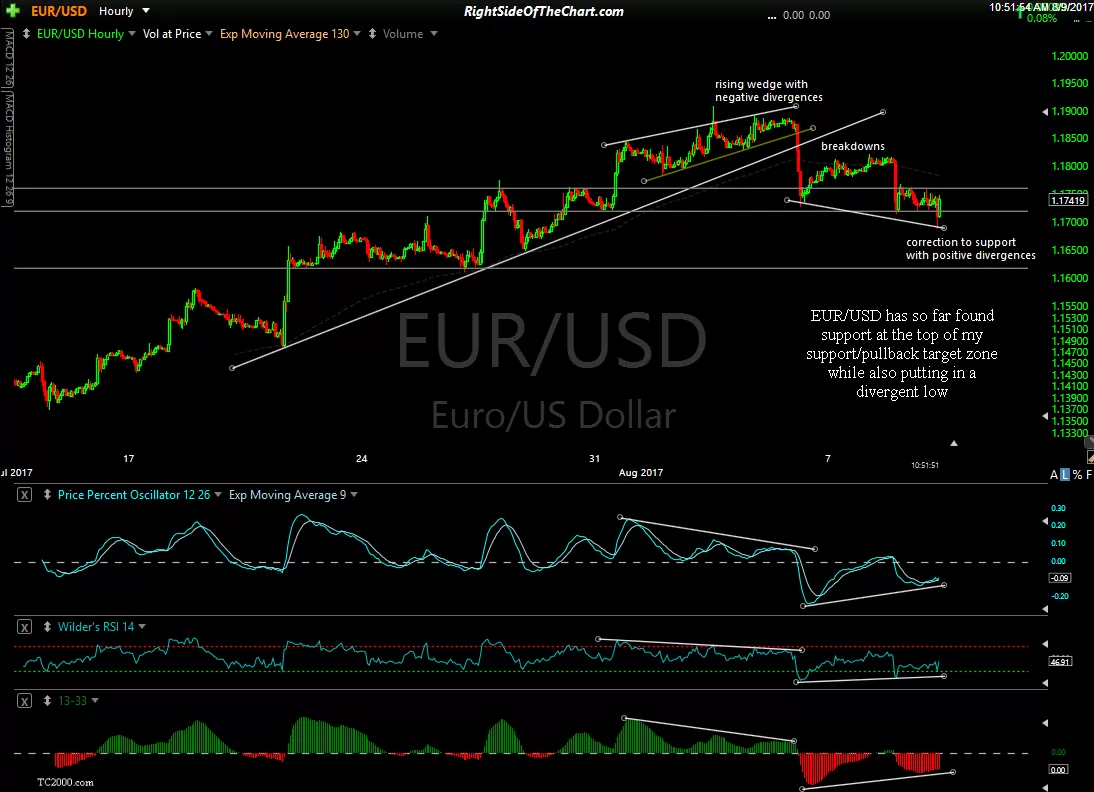
Starting with the Euro & US Dollar (as the Euro is by far the largest component of the US Dollar Index), EUR/USD has so far found support at the top of my support/pullback target zone while also putting in a divergent low on this 60-minute chart. (click on the first chart to expand, then click on right edge to chart to advance to the following chart. Expanded charts can be panned & zoomed)
-
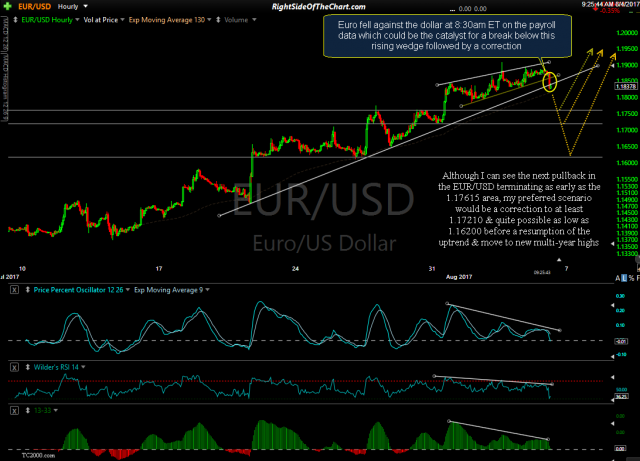
- EUR-USD 60 minute August 4th
-
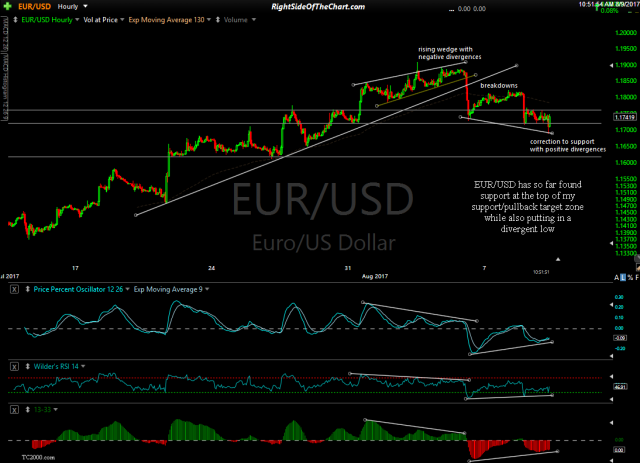
- EUR-USD 60-min Aug 9th
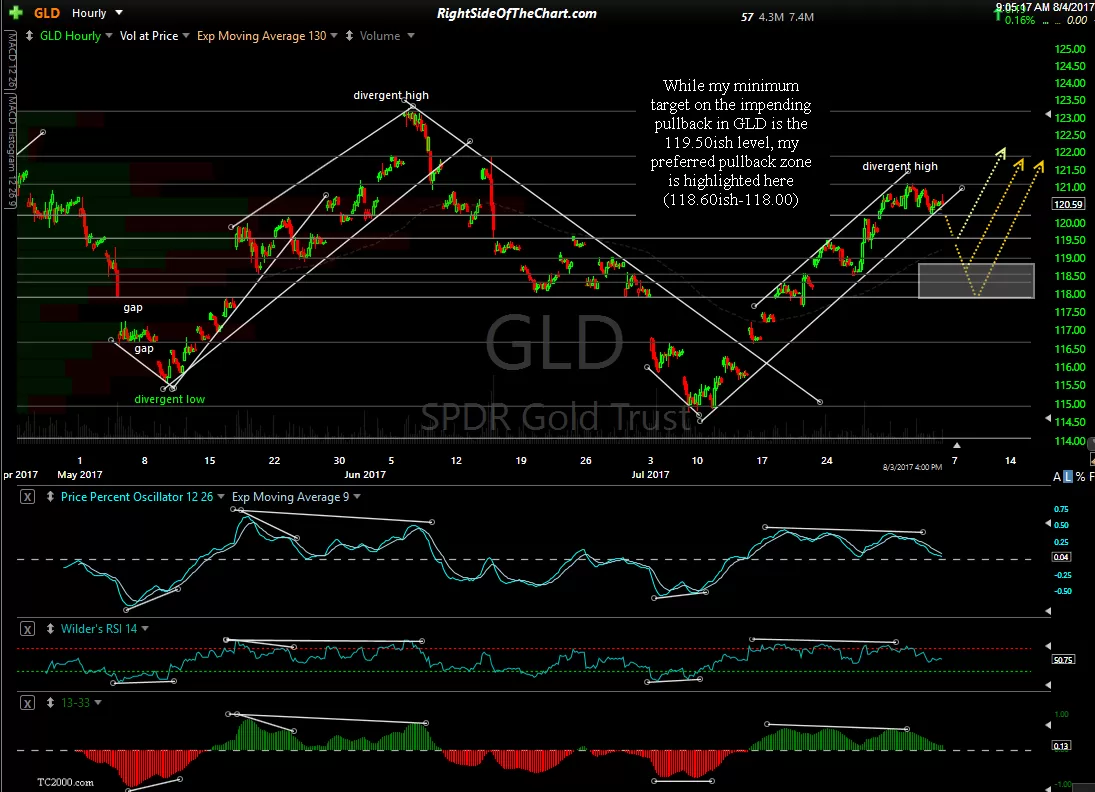
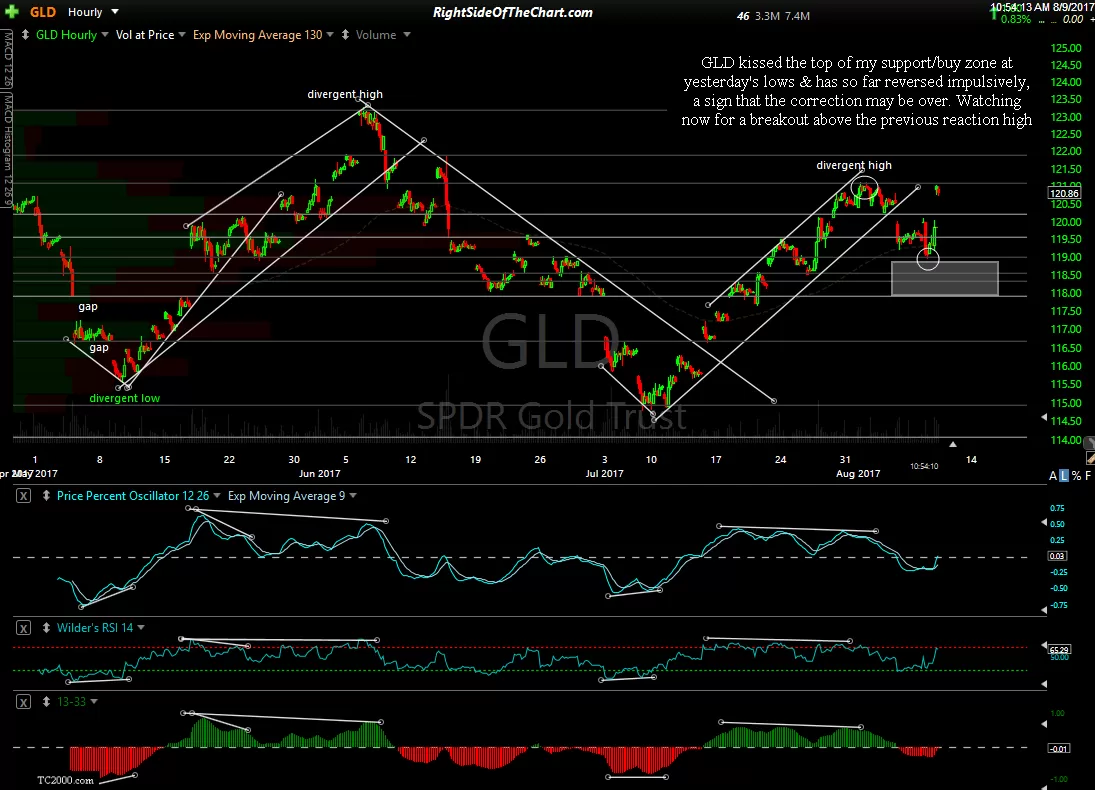
Far from coincidental, both gold & GDX reversed when the EUR/USD reversed, all 3 off support levels. GLD kissed the top of my support/buy zone at yesterday’s lows & has so far reversed impulsively, a sign that the correction may be over. Watching now for a breakout above the previous reaction high. Previous & updated 60-minute charts:
-

- GLD 60-minute August 4th
-
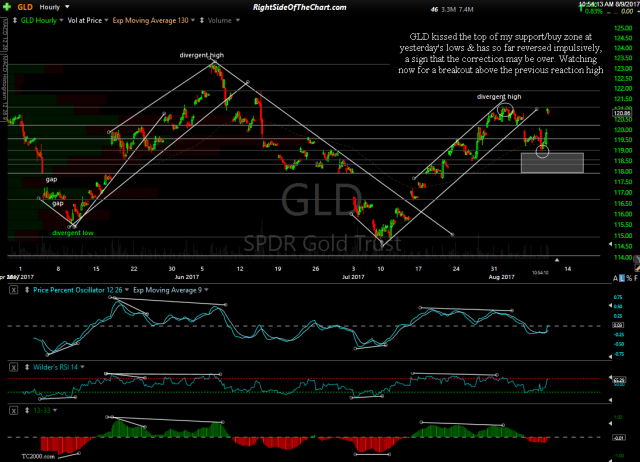
- GLD 60-minute Aug 9th
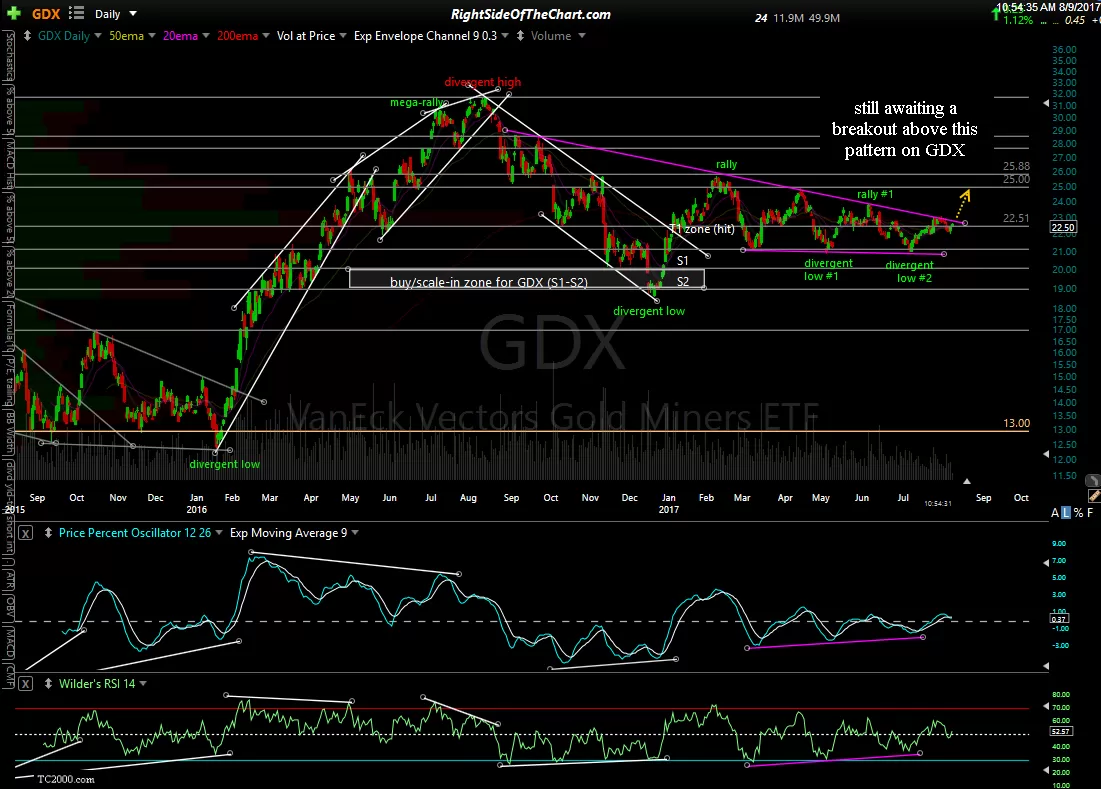
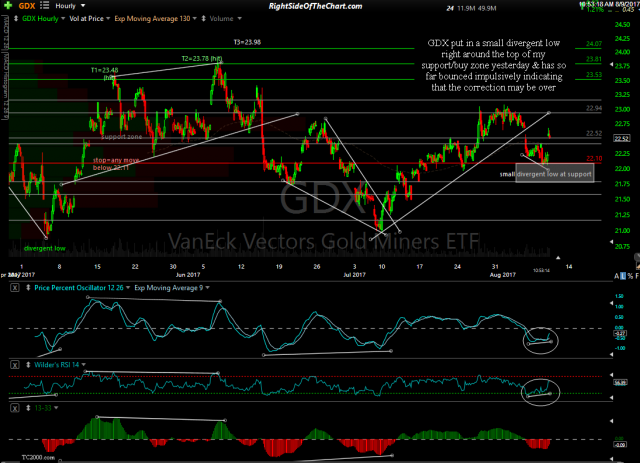
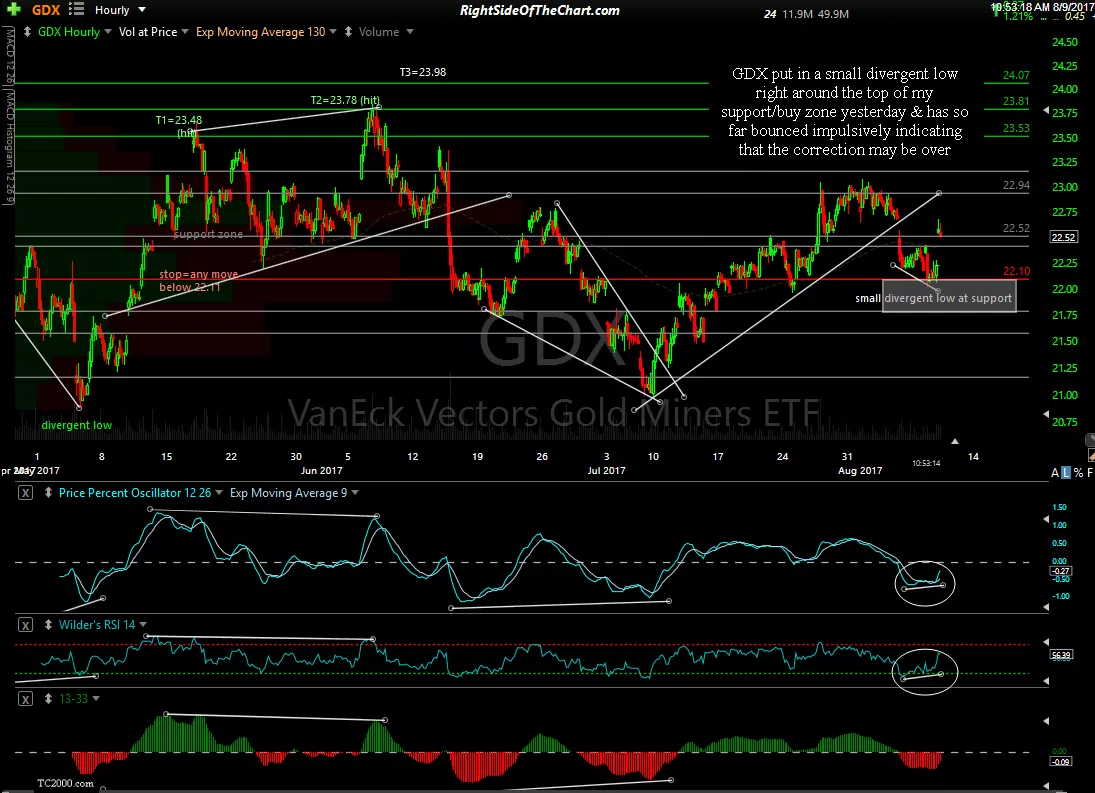
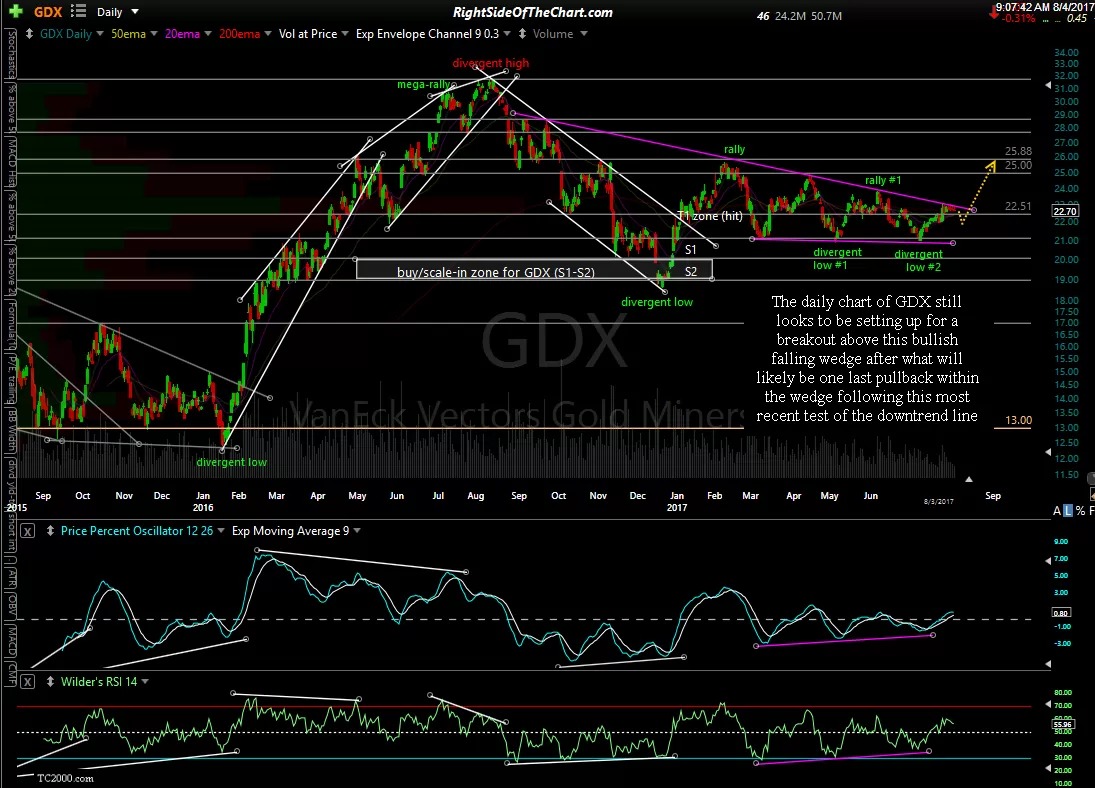
GDX put in a small divergent low right around the top of my support/buy zone on the 60-minute chart yesterday & has so far bounced impulsively indicating that the correction may be over. still awaiting a breakout above this pattern on GDX on the more significant daily time frame along with bullish confirmation on gold & EUR/USD. Previous & updated charts:
-
- GDX 60-minute August 4th
-
- GDX 60-min Aug 9th
-
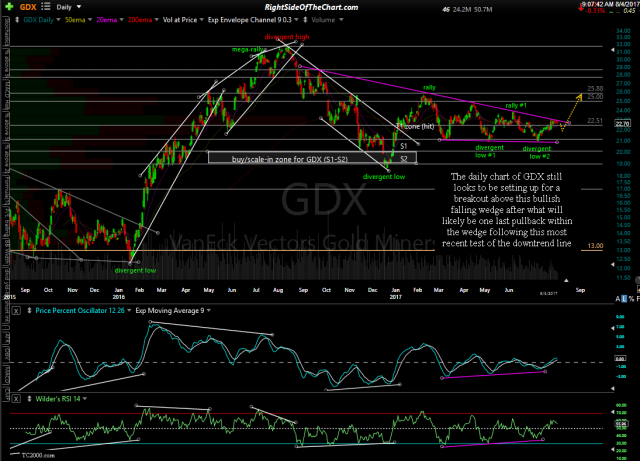
- GDX daily August 4th
-

- GDX daily Aug 9th