The dollar pulled back at 8:30am ET today on the payroll & wage data release. That impulsive but so far, relatively minor pullback might be enough to trigger a breakdown below this 60-minute bearish rising wedge pattern on the €EUR/$USD pair. When the EUR/USD moves down, that indicates the dollar falling against the Euro, which is by far the largest component in the $USD index. As gold tends to fall when the dollar is rising & rally when the dollar is falling, the ideal scenario that I’m watch for would be a pullback to any of these support levels on the USD/EUR, followed by a resumption of the previous rally.
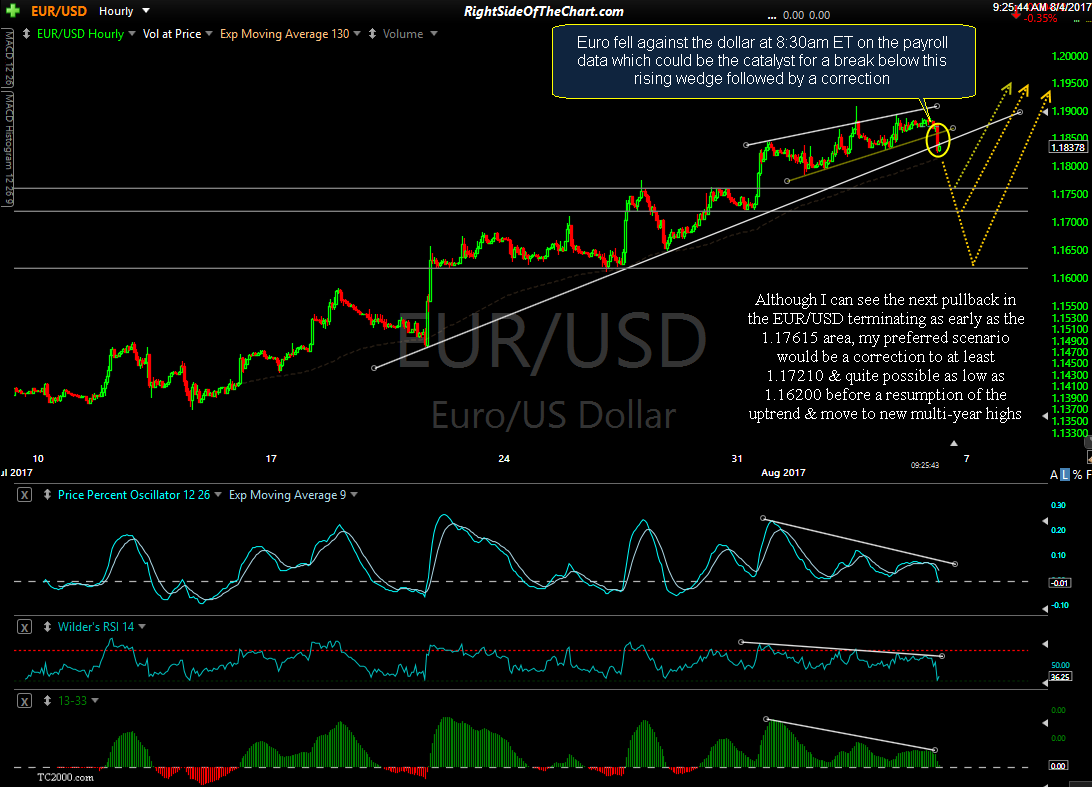
EUR-USD 60 minute August 4th
The primary reason that I expect the next pullback in the EUR/USD to be relatively minor is due to the fact that this currency pair just broke out of a massive 2½ year basing pattern along with putting in very large & powerful bullish divergences when the pair bottomed at the beginning of the year. Those bullish developments as well as additional analysis on the $USD (US Dollar Index), gold, silver, platinum & GDX were all covered last Friday the Gold, Silver, Platinum & US Dollar Analysis video. 1o-year weekly chart of EUR/USD below:

EUR-USD weekly August 4th
As always, I prefer to confirm any trades on gold & the miners with the outlook for the US Dollar, hence the commentary, charts & scenarios posted above. While I favor a break below this most recent minor uptrend line in GLD soon, unlike the previous, similar minor uptrend lines in 2017, all of which resulted in significant corrections when broken, GLD does NOT have negative divergences nor is it overbought as it was preceding each of those TL breaks as shown on the daily chart below (note: I started to compose this post before the opening bell today. As such, these charts reflect prices as of yesterday’s close).
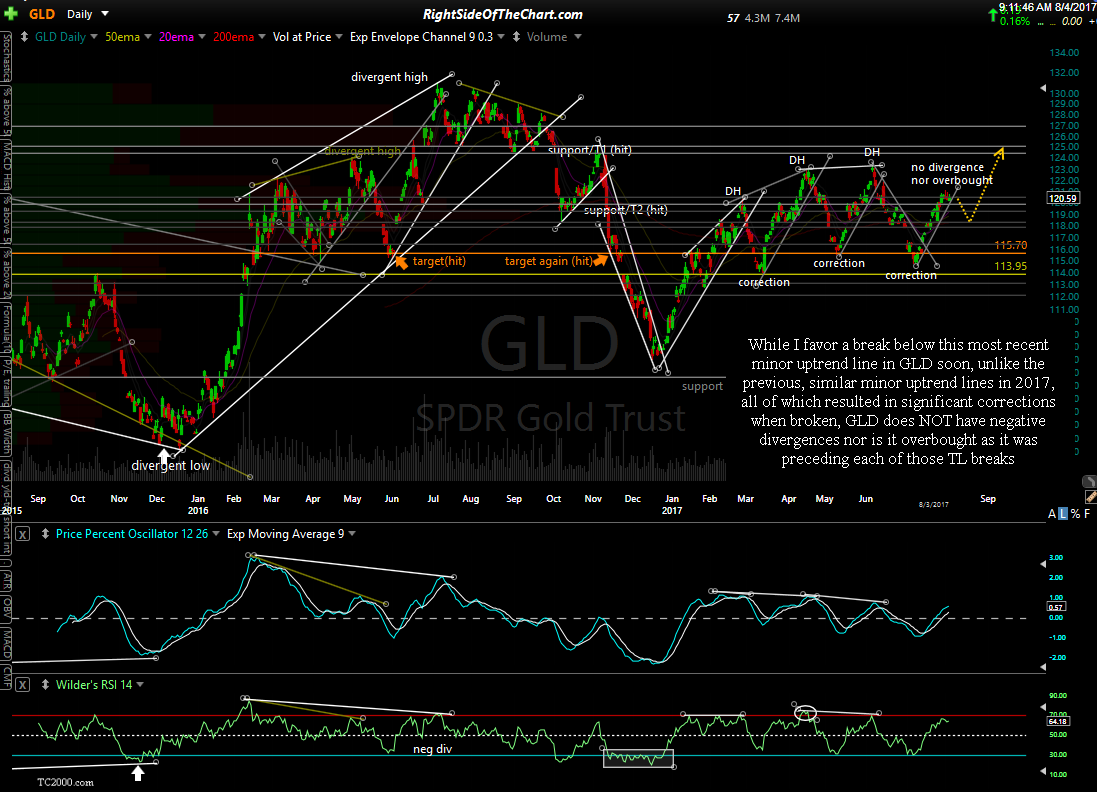
GLD daily August 4th
Zooming down to the 60-minute chart of GLD in order to help zero in on the potential pullback targets, while my minimum target on the impending pullback in GLD is the 119.50ish level, my preferred pullback zone is highlighted here (118.60ish-118.00).

GLD 60-minute August 4th
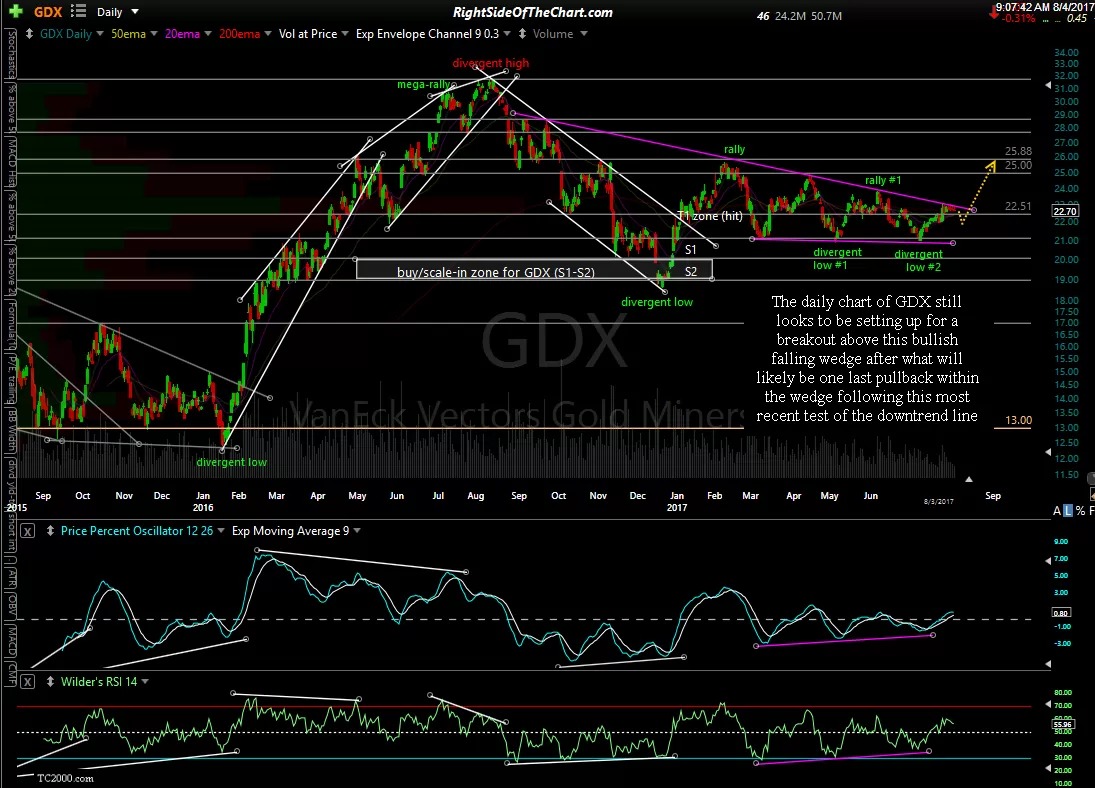
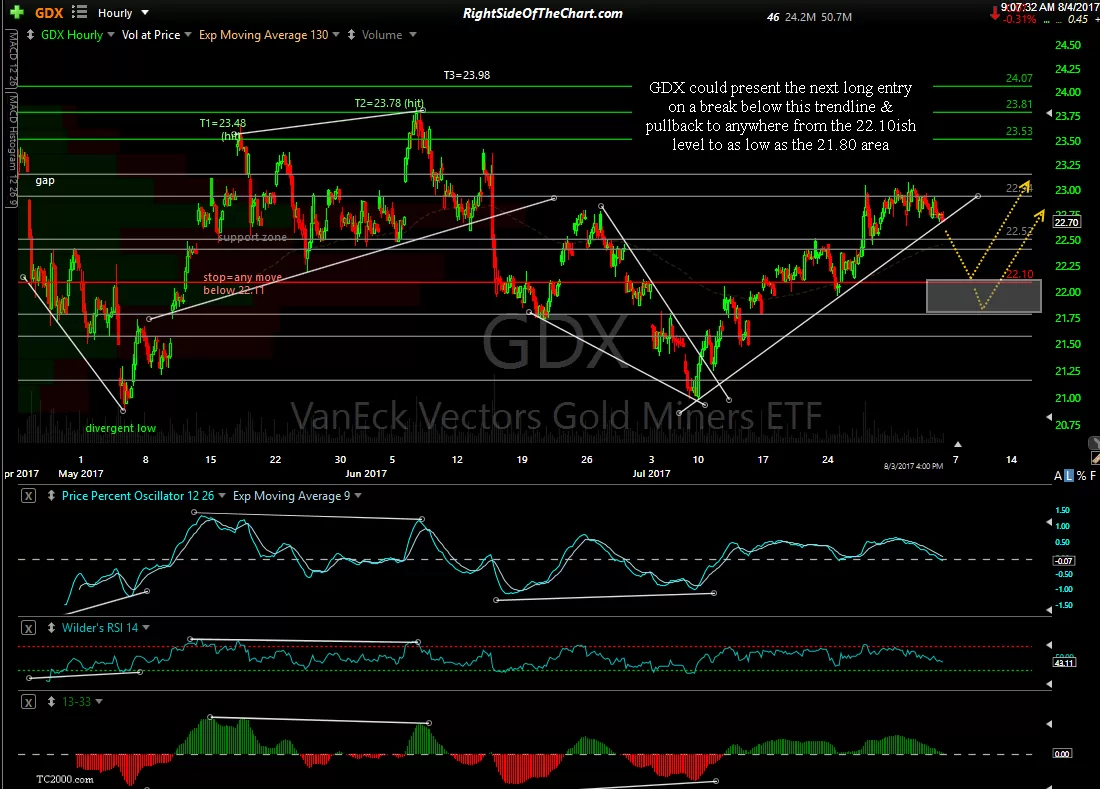
I’ve shaded my current preferred pullback target zone on GDX but I put a higher weighting on what both gold & the $USD are doing at the time as the miners will ultimately follow the metals. GDX could present the next long entry on a break below this trendline & pullback to anywhere from the 22.10ish level to as low as the 21.80 area as shown on the 60-minute (first chart) below. The daily chart of GDX (second chart) still looks to be setting up for a breakout above this bullish falling wedge after what will likely be one last pullback within the wedge following this most recent test of the downtrend line.
-
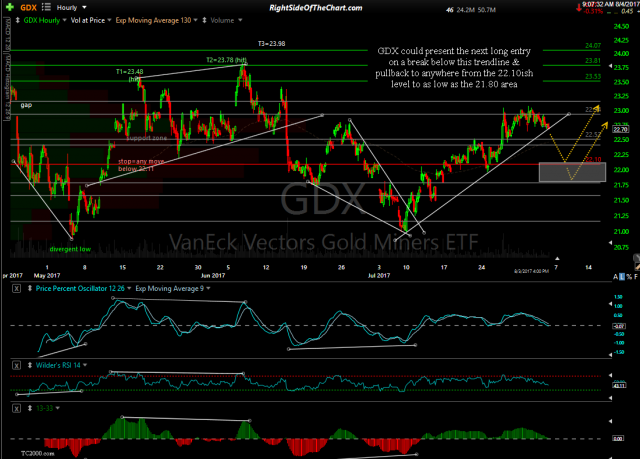
- GDX 60-minute August 4th
-
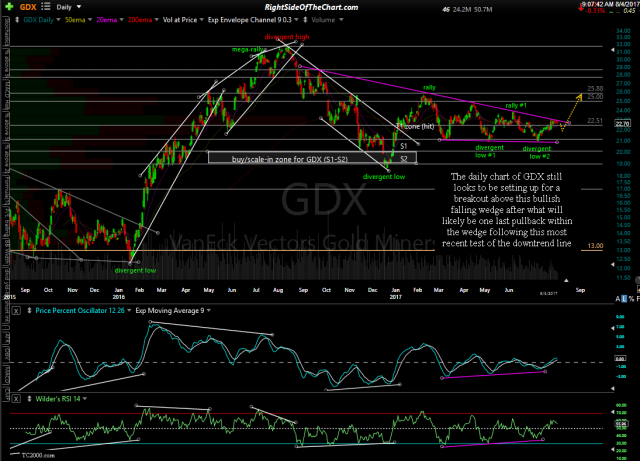
- GDX daily August 4th