
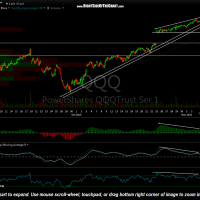
The near-term trend remains on a sell signal/bearish. Based on both the extended length of the previous bullish (green) trend as well as the scope of the bearish rising wedge that prices recent broke down below, I continue to expect AT LEAST a backfill of the 10/22 -10/23 gap.
-
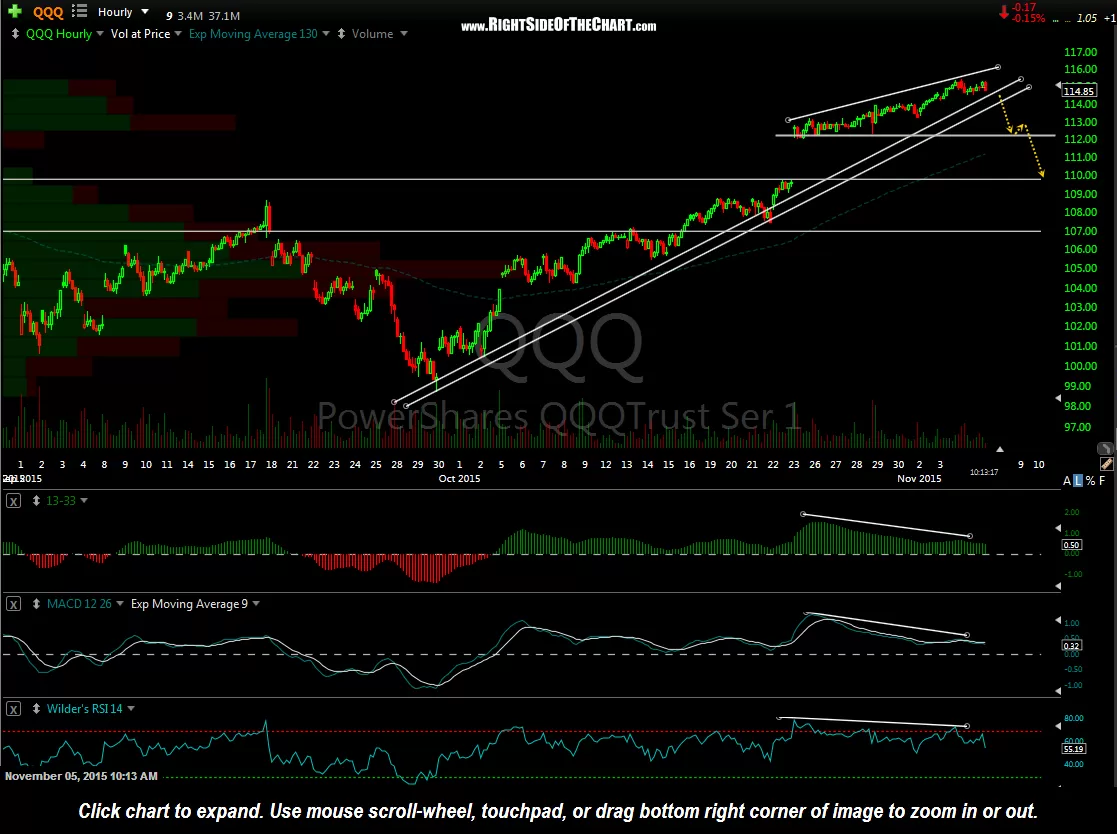
- QQQ 60 minute Nov 5th
-

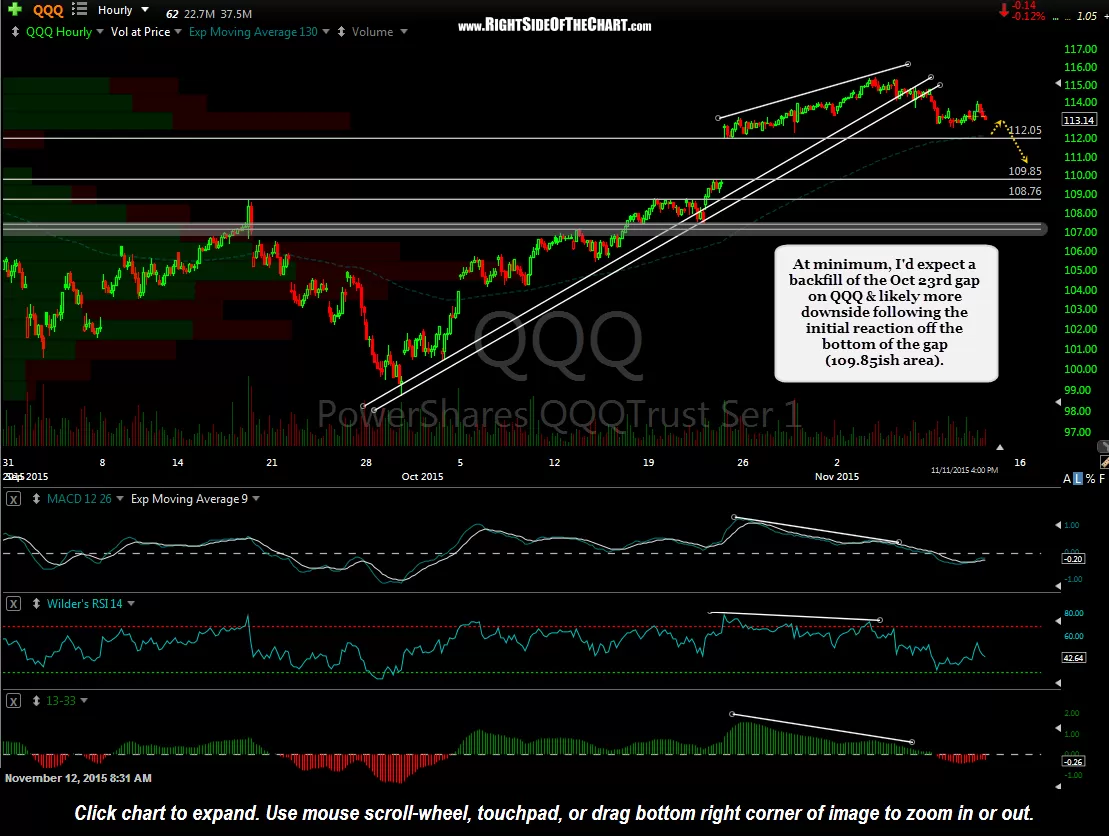
- QQQ 60 min Nov 11th
-
- QQQ 60 minute Nov 12th
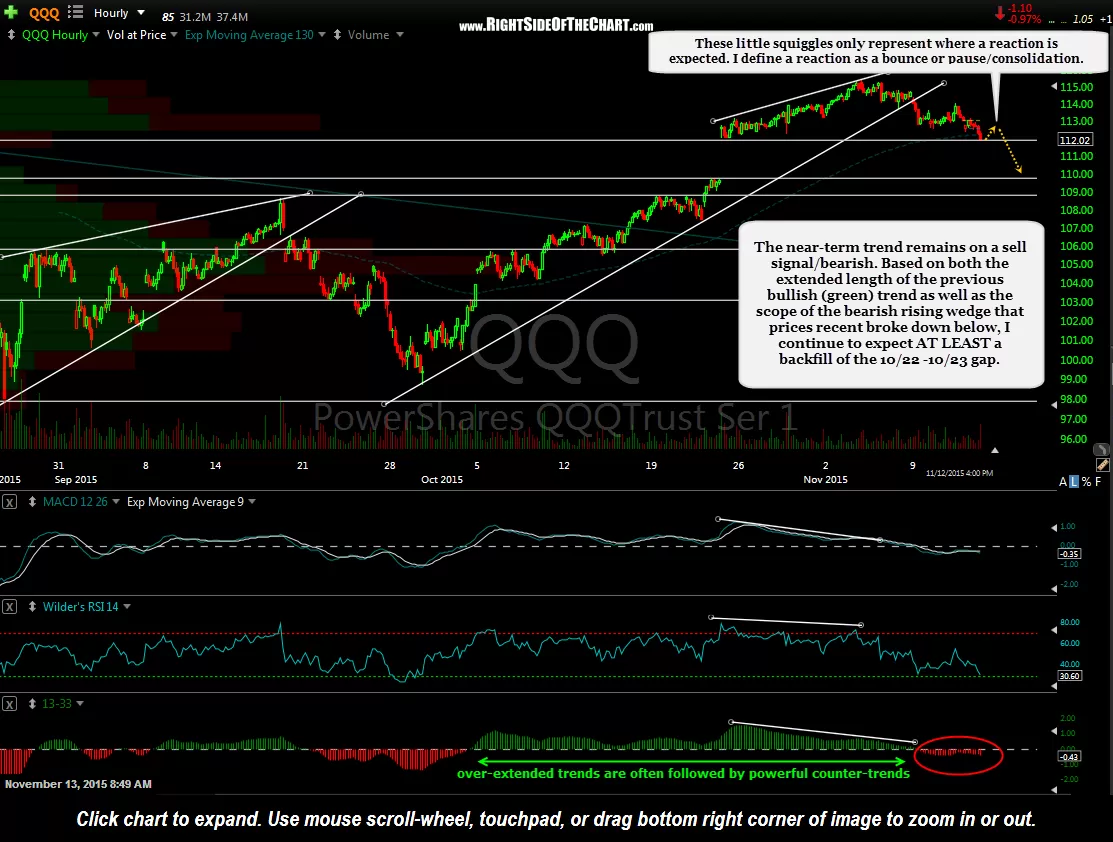
These little squiggles only represent where a reaction is expected. I define a reaction as a bounce or pause/consolidation. With prices closing right at the top of that gap yesterday, we essentially have that “reaction”. As I type in pre-market, the Q’s are trading slightly below that level so they will either most likely either recover the top of that gap before or shortly after the open, in which case I could see a rally that might go as high as the 113ish level and if not, prices will likely continue lower towards the bottom of the gap (my preferred scenario), as gaps are often backfilled.
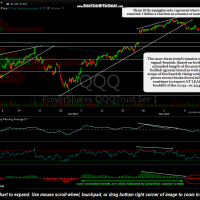
Now assuming that we do a get a gap backfill, that is where it gets interesting. Even all but the most ardent bulls would most likely welcome a gap backfill, as that would help to alleviate the recent overbought conditions plus, as I stated, gaps are commonly backfilled. Therefore, a bullish scenario would be a backfill of that gap followed by a reversal & the $NDX blasting off to new highs in the comings days/weeks.
Should prices move much below the bottom of that gap, more than just a relatively brief & minor overshoot, which is more than common when gaps are backfilled, that would be a bearish technical event as it would should a lack of buyers stepping in to buy the gap backfill, indicating that the supply/demand dynamics have now shifted in favor of the bears. The latter is my preferred scenario based not only on my analysis of the short-term charts but the longer-term chart & many other factors as well.
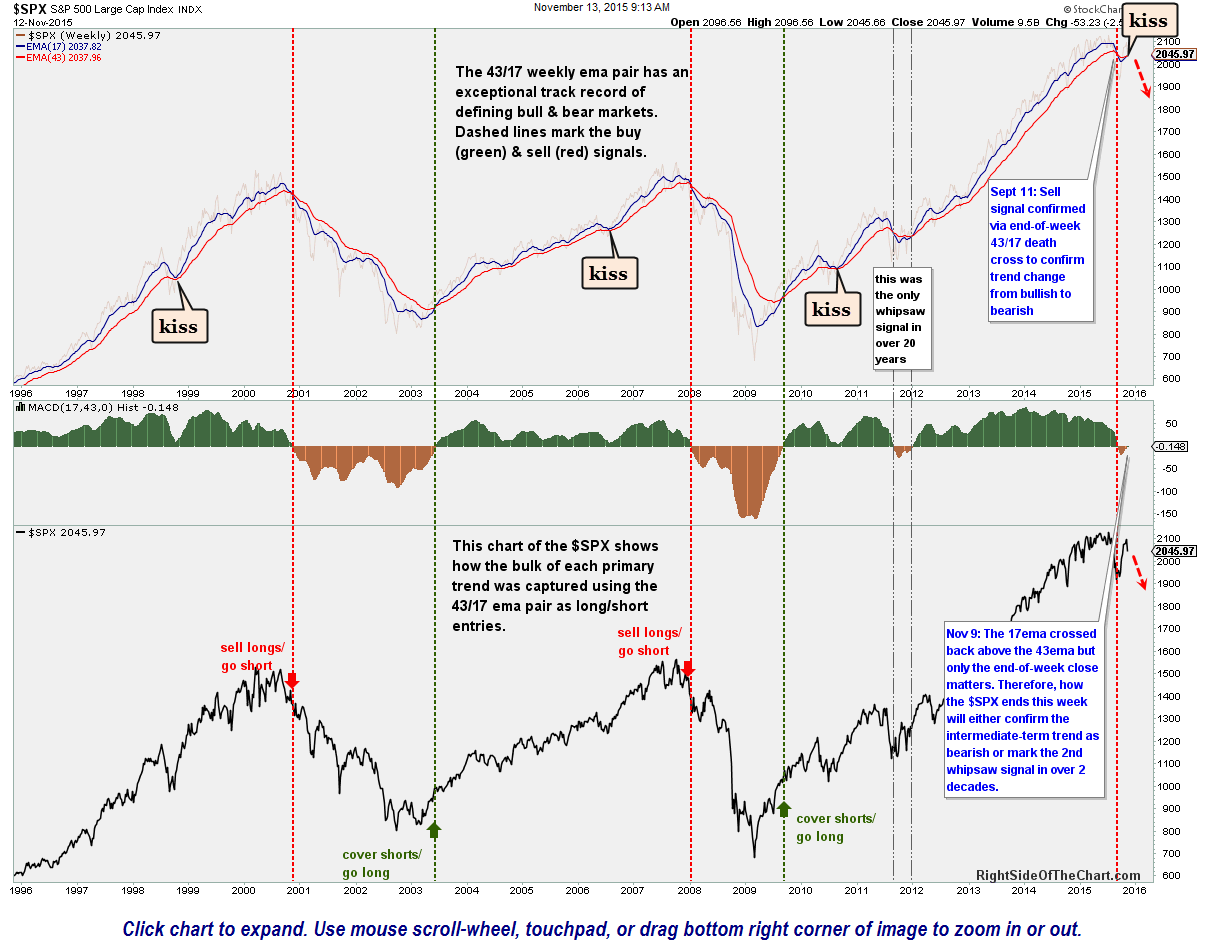
$SPX 43-17 weekly ema trend Nov 12th
It is still too early to engage this market aggressively short IMO but with each break of support, assuming that these bearish rising wedge pattern breakdowns on the $NDX & $SPX continue to play out, the strong the bearish case becomes…and rather quickly at that. Keep in mind that 43/17 weekly ema trend chart that I posted here the other day. Barring a very strong close on the $SPX today, that very reliable intermediate to long-term trend indicator will have failed on this week’s attempt at a bullish cross (the 17-ema had crossed back above the 43-week ema earlier in the week). Such failed breakouts or golden crosses on ema pairs are often followed by very sharp selloffs (just glance at how strong the price moves in the $SPX were following the previous “kisses” of this ema pair in the past).