
The charts below help to illustrate that, at least as this point, the recent rallies in the major US stock indices have so far been nothing more than typical oversold, counter-trend bounces off support with every major US stock index still well within the typical Fibonacci retracement levels. All major indices, other than the Nasdaq Composite & 100, peaked back on March 1st have have been in clear downtrends since then.
-
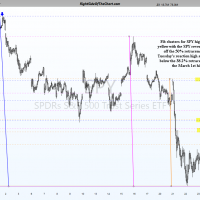
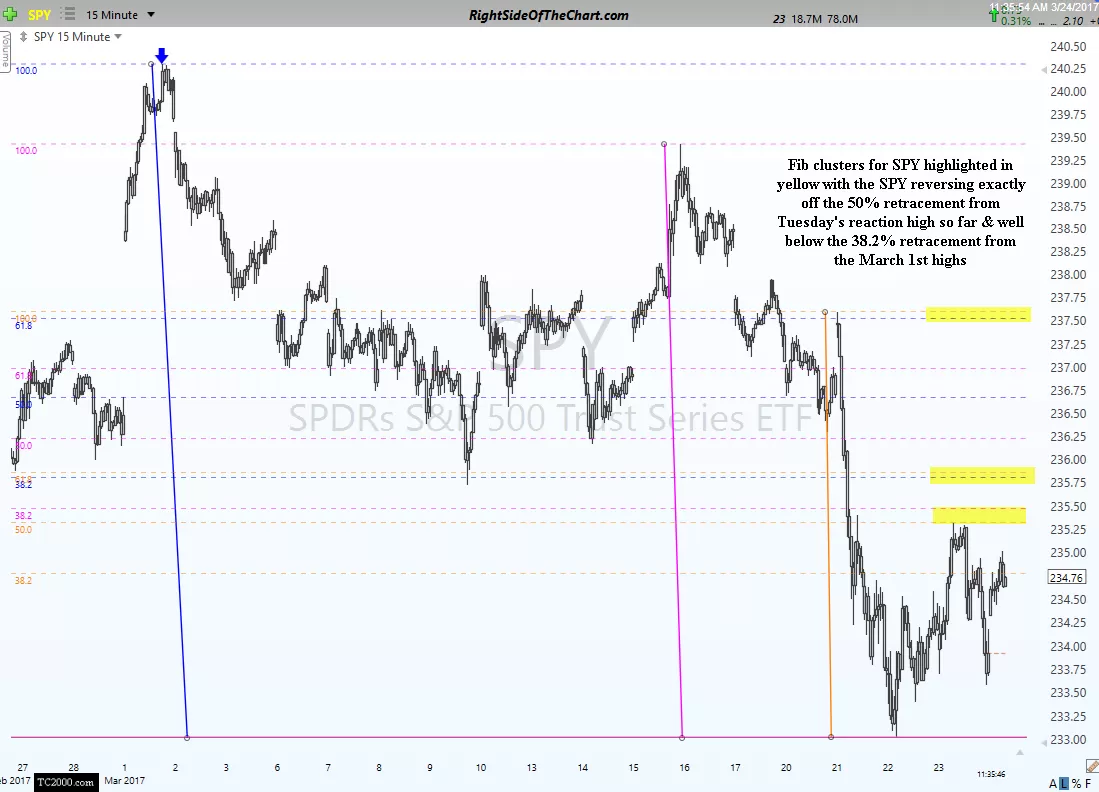
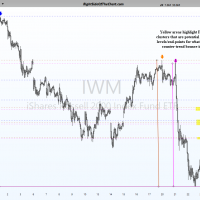
- SPY Fibonacci Clusters March 24th
-
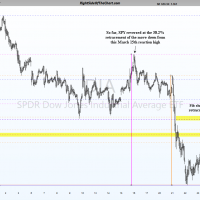
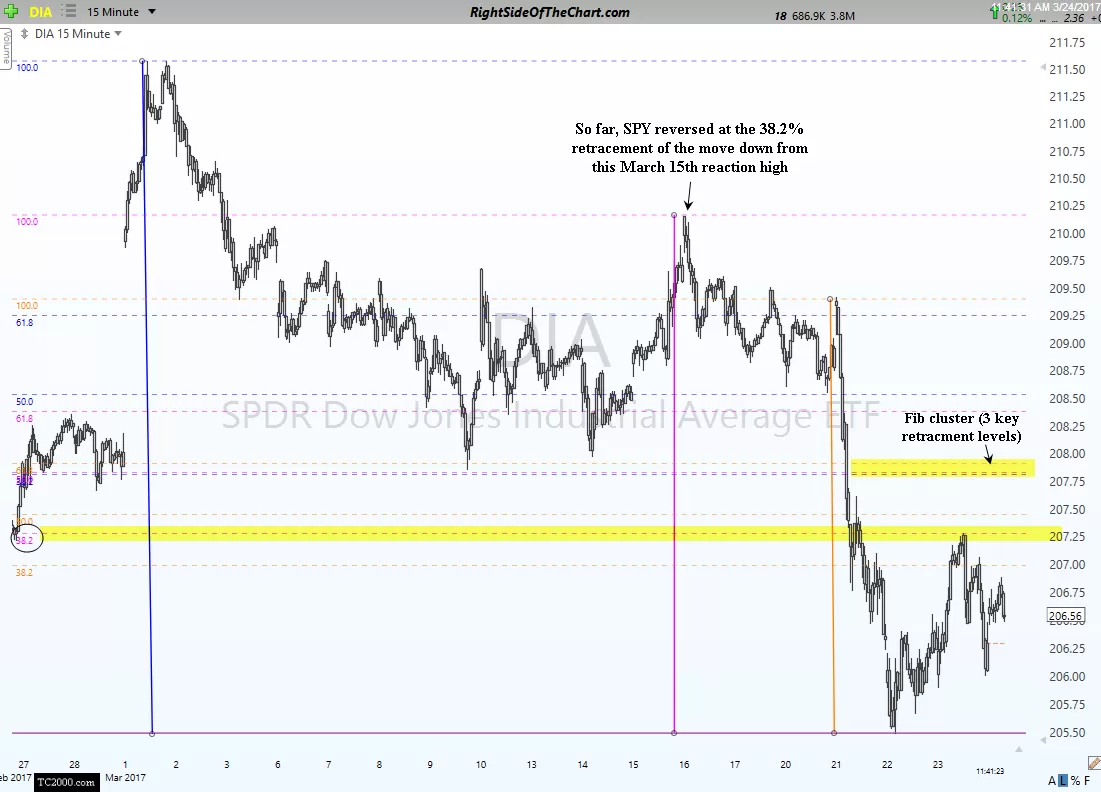
- DIA Fibonacci Retracements March 24th
-
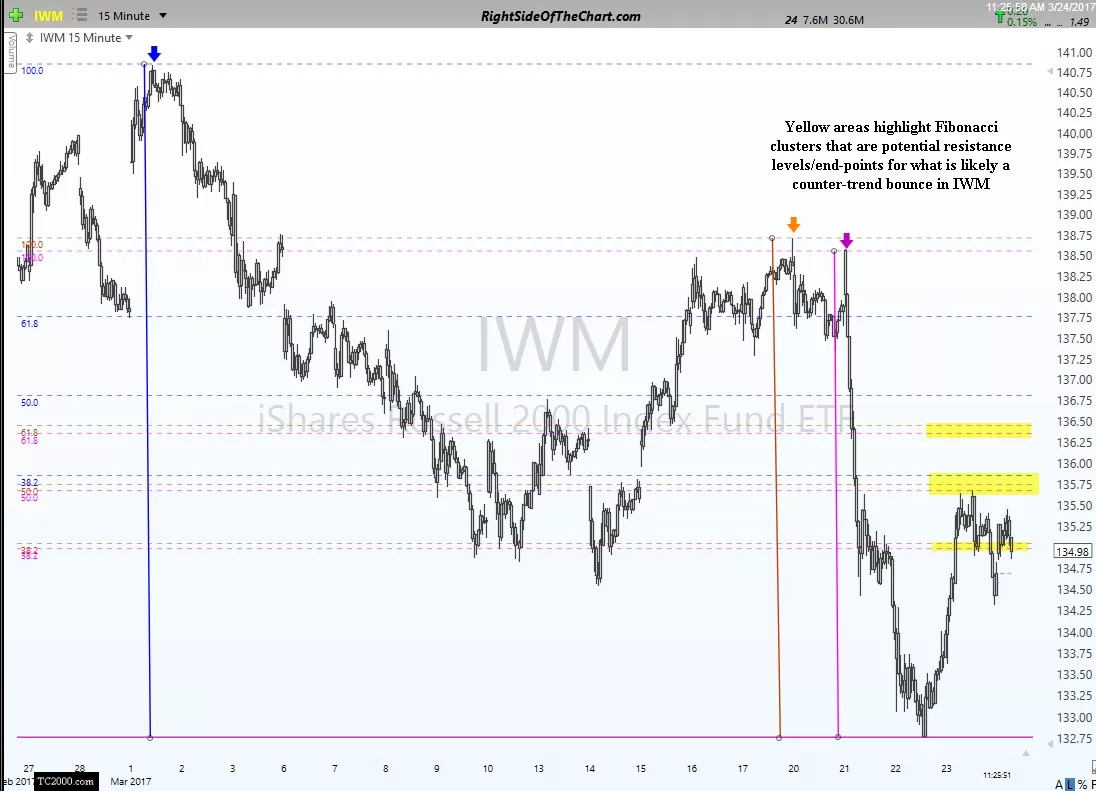
- IWM Fib Clusters March 24th
-
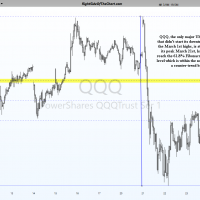
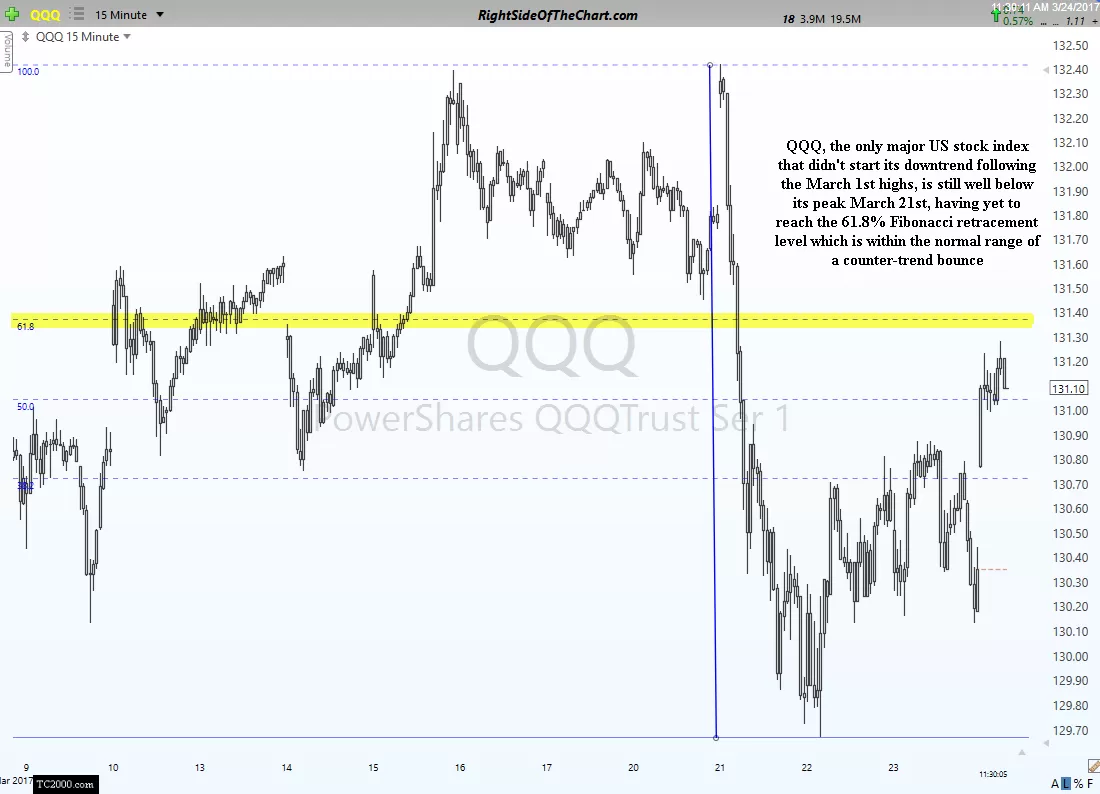
- QQQ 15-min March 24th
-
- $COMPQ Fib retracement March 24th
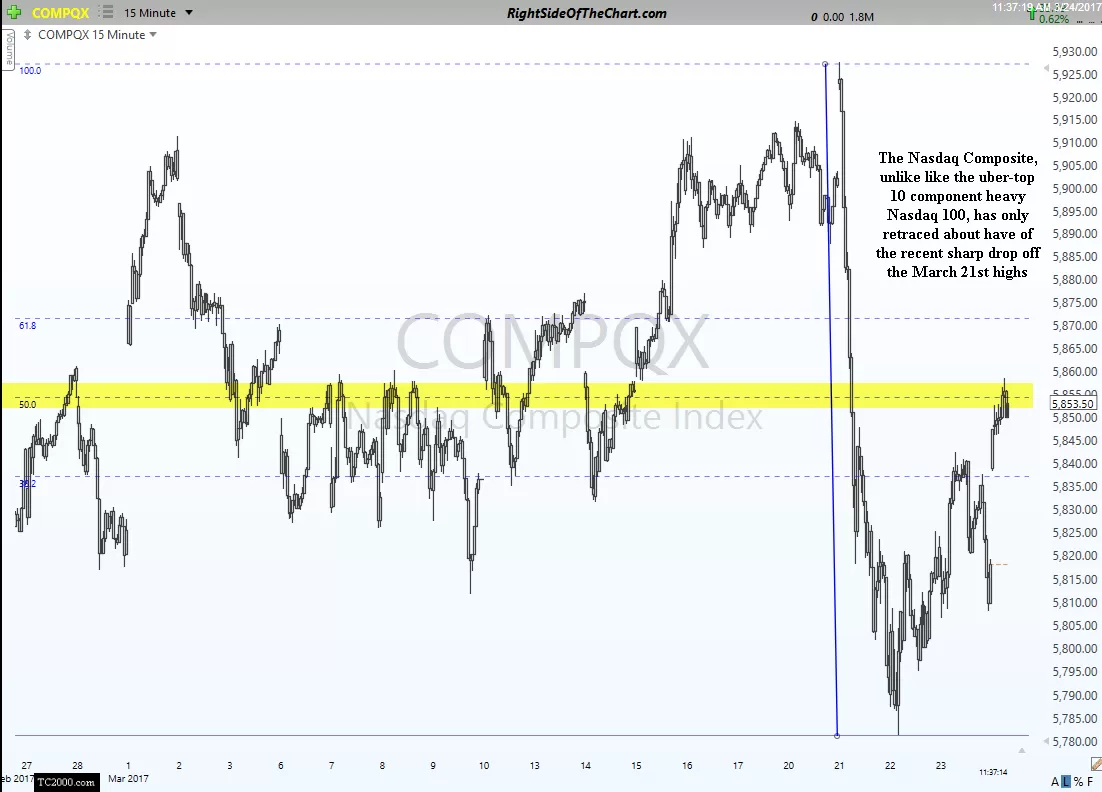
A down trend is simply defined as a series of lower lows & lower highs. Fibonnaci clusters; areas where multiple key Fibonacci retracement levels from various key inflection points in the market come together in close proximity, often act as support or resistance when tested from above or below. As all of the major US stock indices other than the Nasdaq Comp & Nasdaq 100 (which is simply the 100 largest companies within the Nasdaq Composite) have a series of three distinct reaction highs that define their current near-term downtrends, I’ve used the drops from those peaks to add Fibonacci retracement levels, highlighting any key Fib clusters and/or individual retracement levels in prices have reversed off of so far. FWIW, I find Fibonacci retracmement levels most effective as potential reversal points when they align with horizontal price, gaps and/or trendline resistance.
Some of the things that would call the current downtrend into question would be a move of the previous reaction highs from this Tuesday & especially over the reaction highs from last Thursday (in SPY, DIA, MDY & IWM) as well a move above 61.8% & especially the 78.6% Fibonacci retracement level of the drop from the March 1st highs down to Wednesday’s lows (note: I did not list the 78.6% retracement levels on these charts in order to minimize clutter). Another huge blow to the near-term bearish case would be to see any or all of the major stock indices to move back above the top of Tuesday’s large bearish engulfing candlesticks, especially on a closing basis.
So how to trade this? Well, if you are of the mindset that the pullback in the market ended at Wednesday’s lows, I can’t see any reason not to already be long with a stop below. Those who are bullish & looking for new highs could also add long exposure if/when each of the overhead resistance levels & key Fib clusters are taken out.
Personally, I’m still expecting another leg down & will use any rallies into resistance as well as a break below Wednesday’s lows to strategically add short exposure. If the aforementioned recent reaction highs & upper-most Fib retracement levels are taken out, then I will begin reducing short exposure (covering) as the bearish case will begin to rapidly dissipate at that point. Until then, I view any rallies, particularly those into price resistance and/or key Fib clusters as objective levels to add short exposure for what will likely be the next thrust down in the US equity markets.