
The daily charts below highlight (in yellow) the key nearby support levels on the 5 market-leading FAAMG stocks which need to be taken out on a solid intraday break and/or solid daily close to help confirm the recent sell signals on the major stock indices. For stocks with recently intersecting price & trendline support (yellow), a solid break below both support levels is needed. The more FAAMGs that break support & the lower they drop (and close) below those levels, the better the chance that the breakdowns will stick and not prove to be whipsaw signals.
-
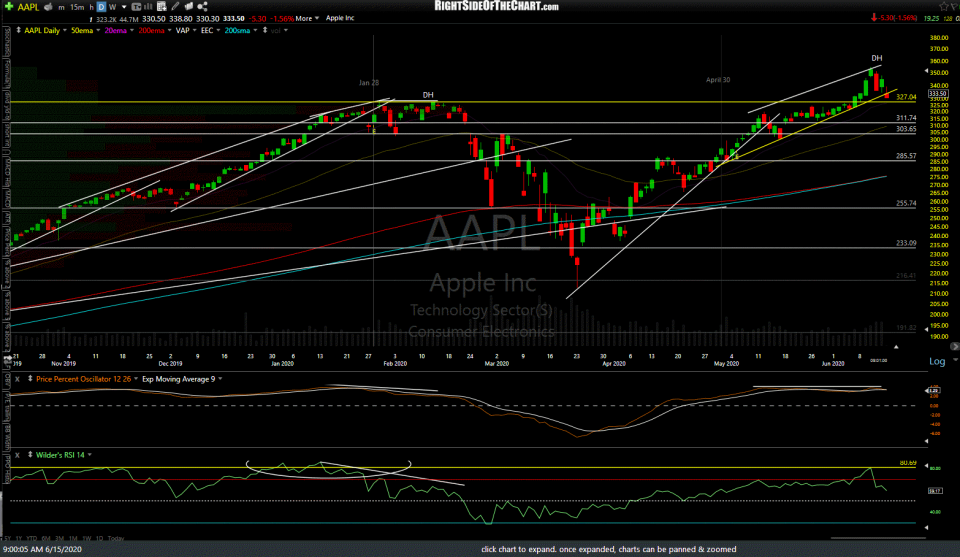
- AAPL daily June 15th

-
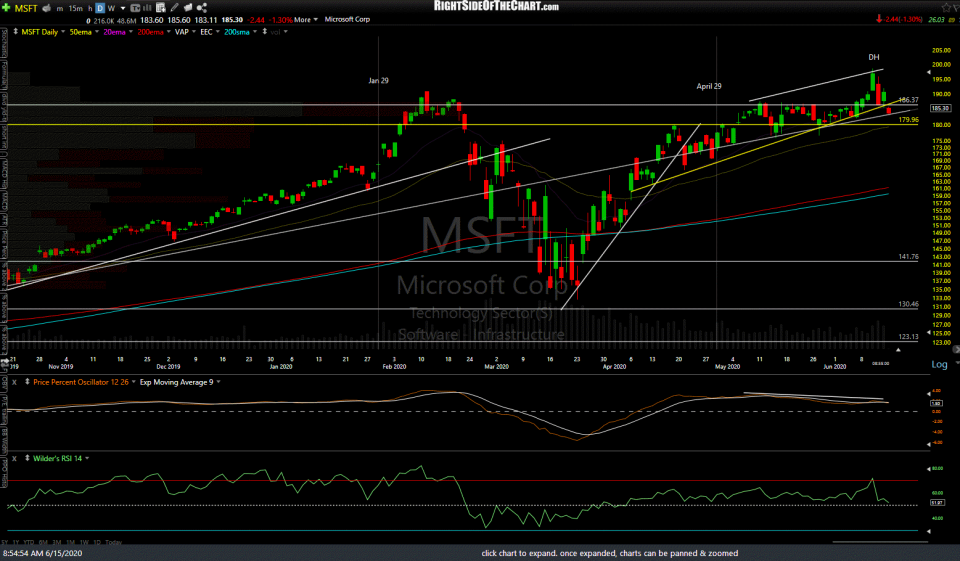
- MSFT daily June 15th

-
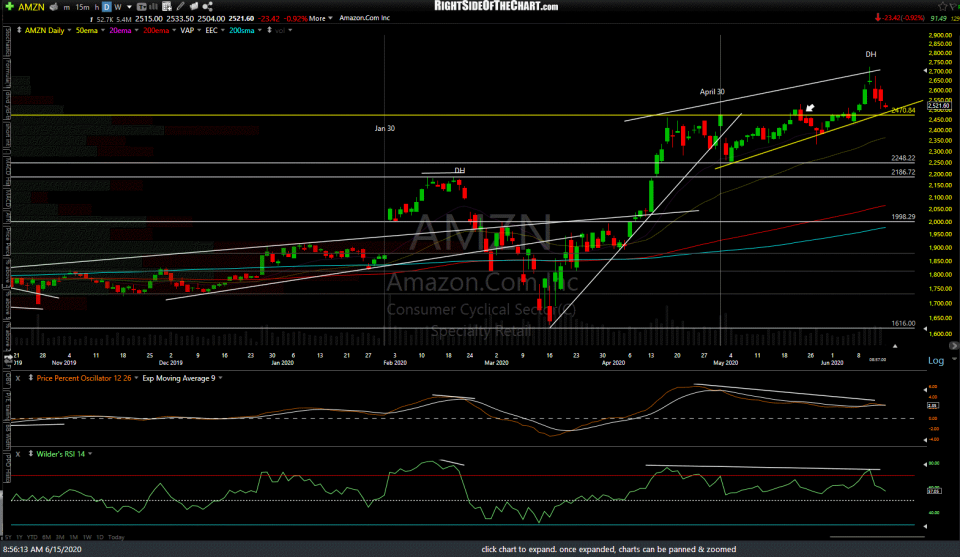
- AMZN daily June 15th

-
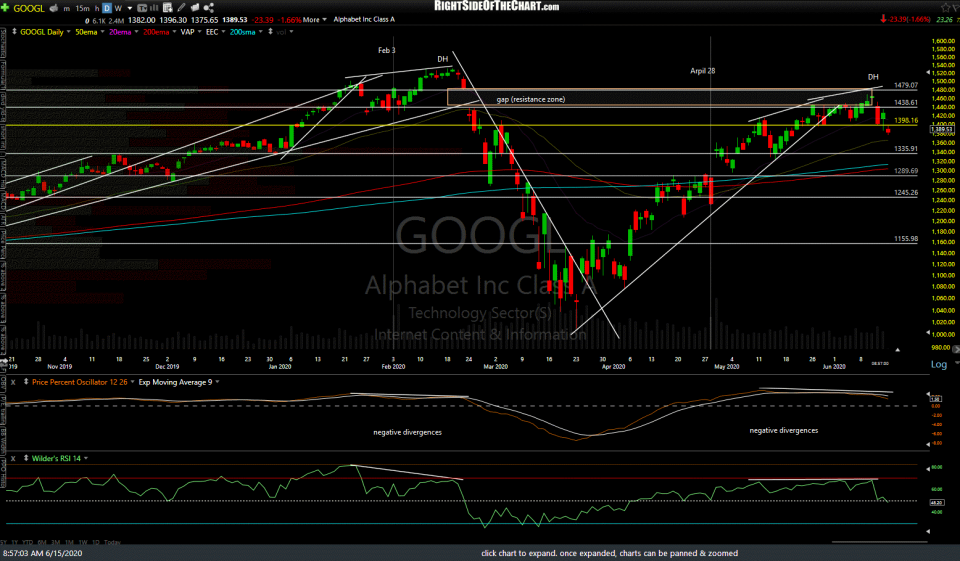
- GOOGL daily June 15th

-
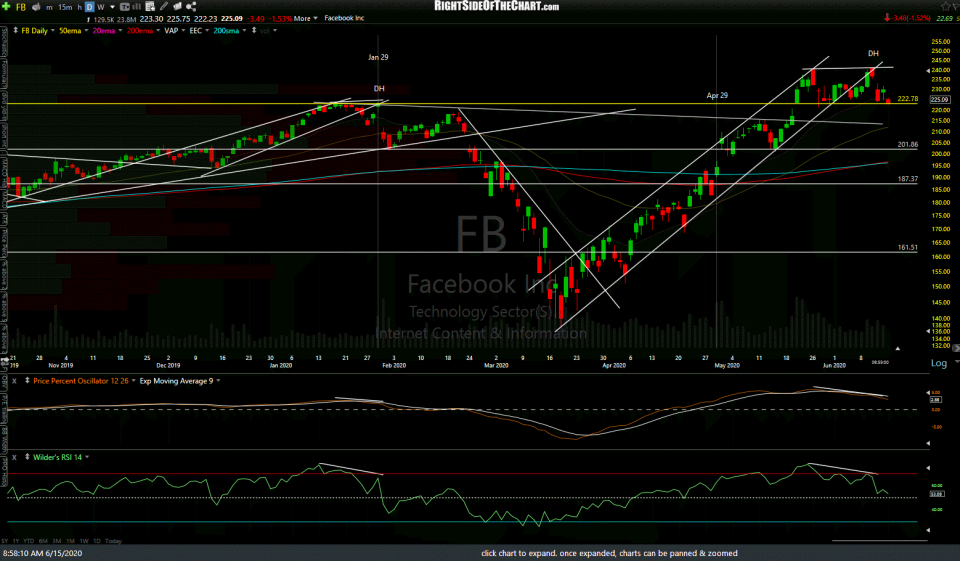
- FB daily June 15th

These charts are in a gallery format, which will not appear on the subscriber email notifications. To view the charts, visit rsotc.com & click on the first chart to expand. Once expanded, the charts can be panned & zoomed. Click the arrow to the right to advance to the next expanded chart. Note: These charts include today’s candlesticks from the pre-market trading session.