
The EUR/USD looks poised for a upside breakout from this bullish falling wedge pattern (60 min chart). Overlaid in purple is SH, the inverse S&P 500 ETF, clearly illustrating the inverse correlation to the EUR/USD and the US stock market. (i.e.- Euro up/dollar down = S&p 500 down).
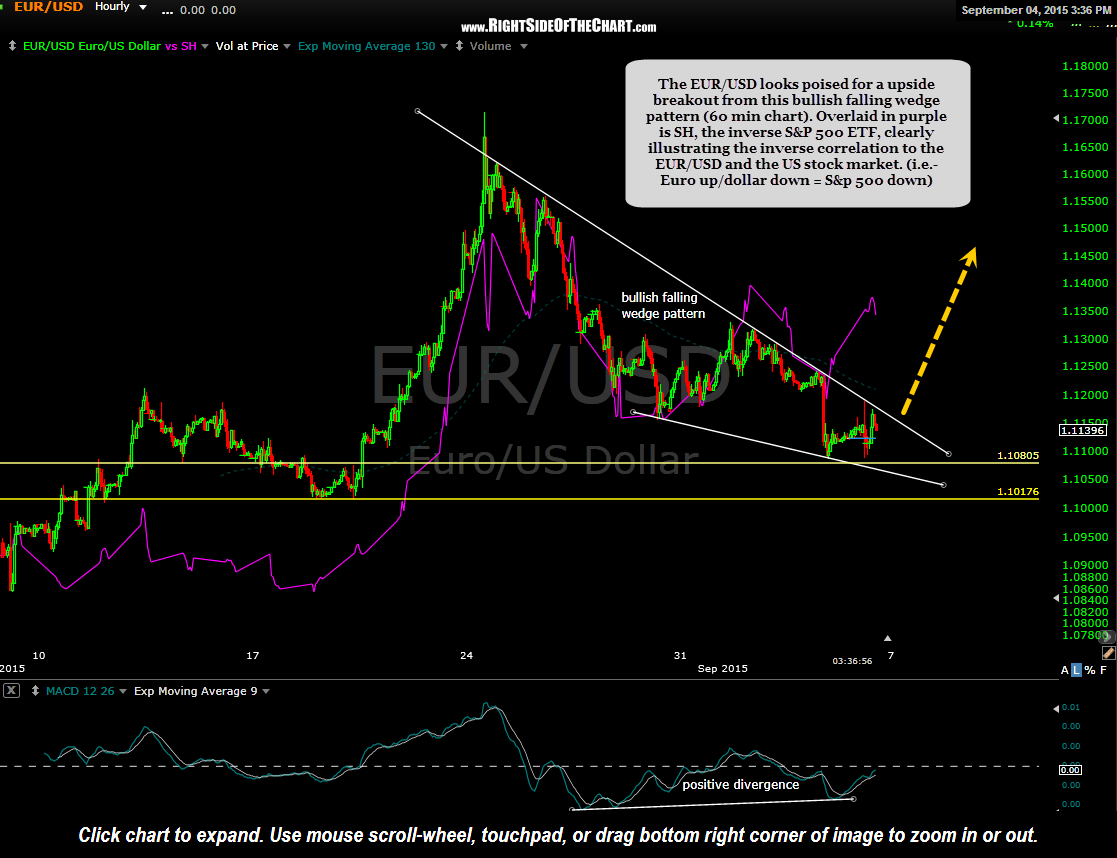
EUR-USD 60 minute Sept 4th