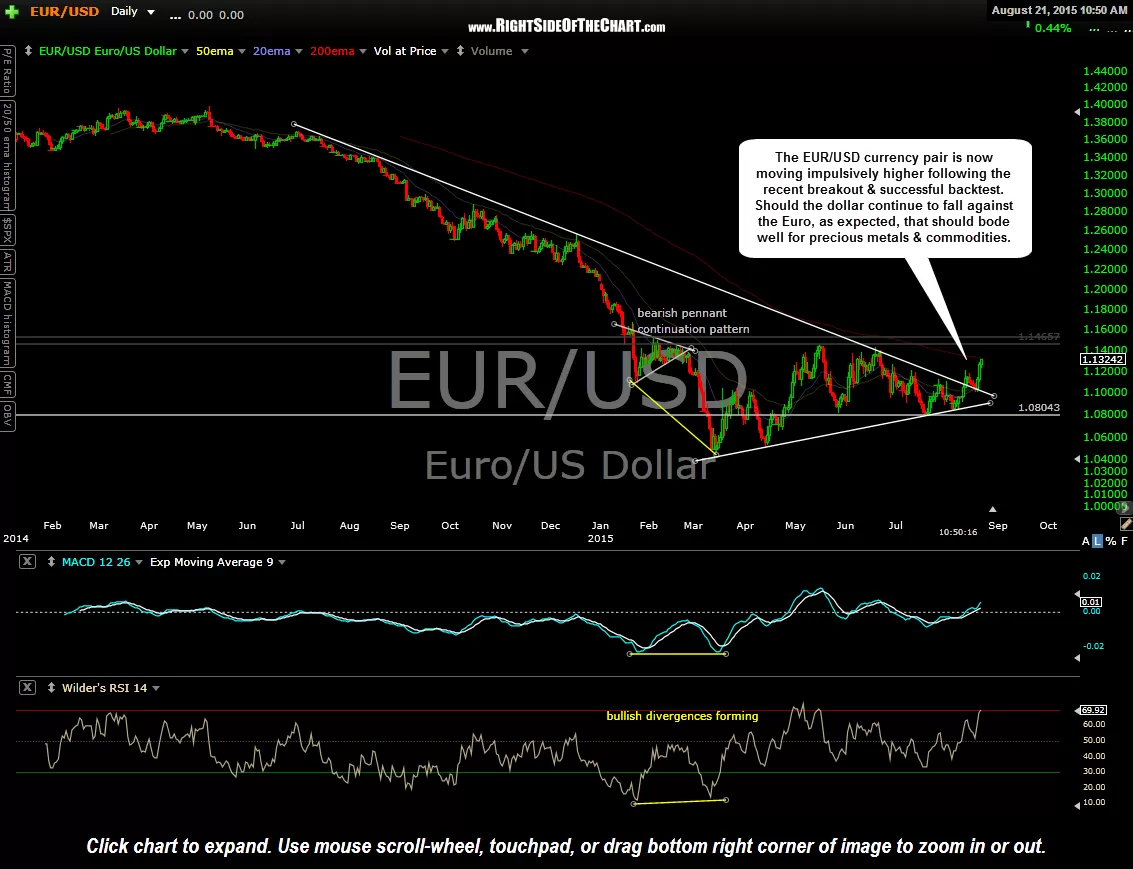
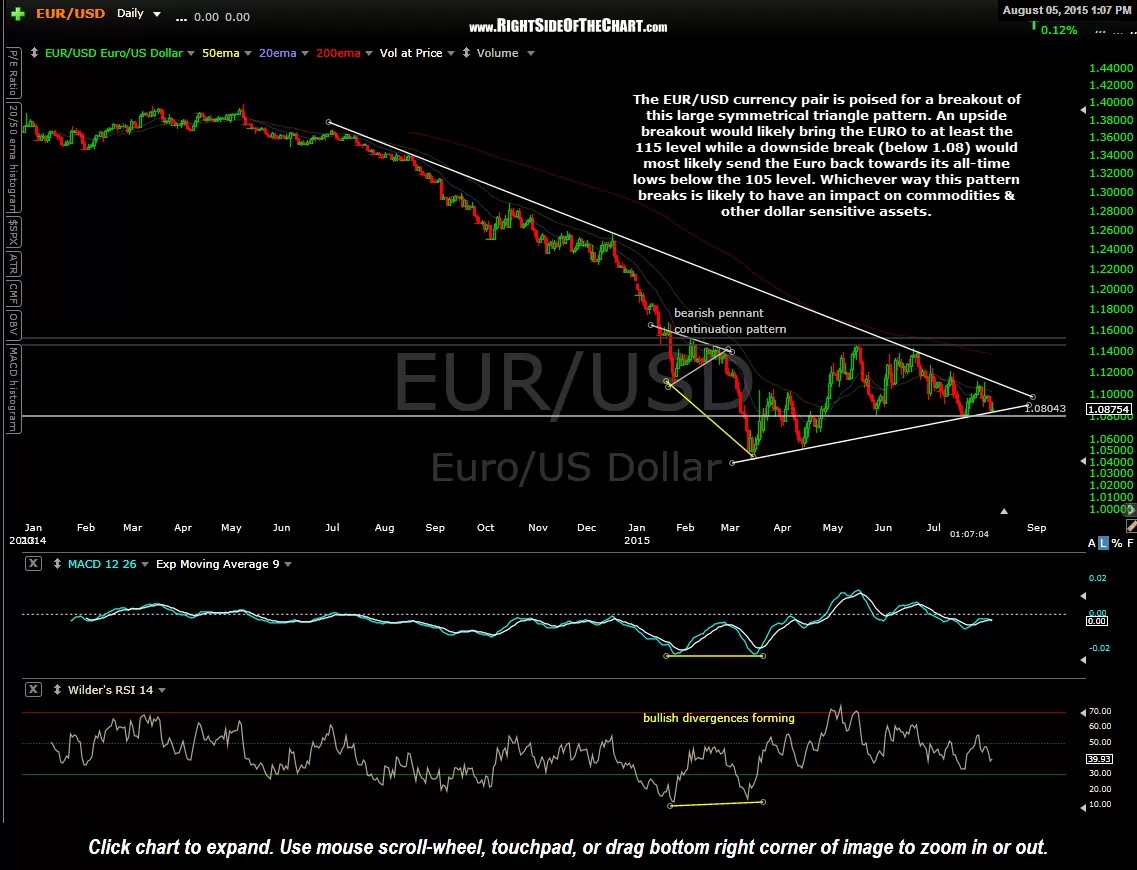
In this post from August 5th, I pointed out a large symmetrical triangle pattern that had formed in the EUR/USD (Euro vs. US Dollar) currency pair. It was stated that a breakout of the pattern was likely to occur within two weeks. Exactly one week later, the pair did go on to make a solid breakout above the top of the triangle pattern, going on to backtest the pattern (which was defined by a year+ long downtrend line) from above for the next week or so with prices then starting to move impulsively higher since Wednesday of this week & showing no signs of abating so far.
All-in-all, solidly bullish price action for the Euro & equally bearish price action for the US Dollar. Based on the magnitude of that symmetrical triangle pattern, it would indicate that the $USD will likely continue to fall against the Euro in the weeks & months to come. If so, that would strengthen the bullish case for gold, silver & other dollar sensitive assets including the beaten down commodity sector.
-
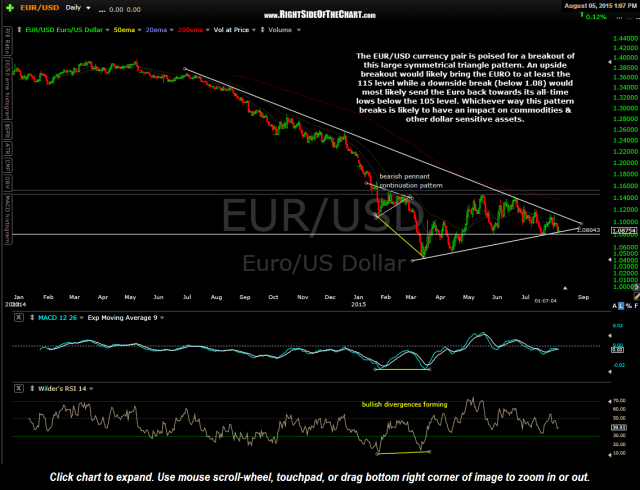
- EUR-USD daily Aug 5th
-
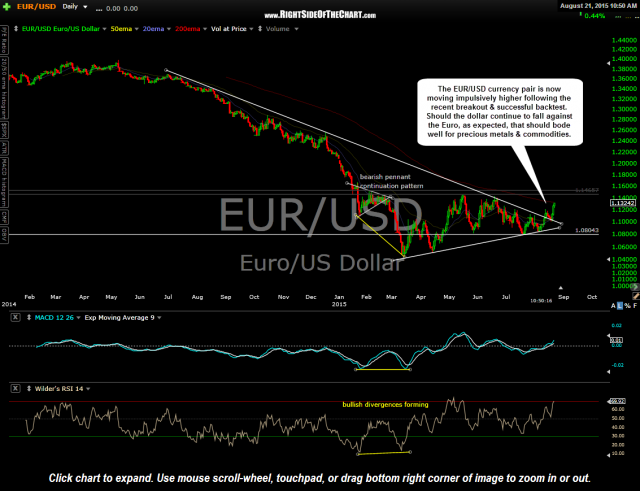
- EUR-USD daily Aug 21st