
As per last week’s scenario, a rejection & reversal off the 1.09375 resistance will most likely result in a correction in gold, silver, & equities with the tech-heavy QQQ & SOXX likely outperforming to the downside. Previous (Thursday’s) and updated daily charts of EUR/USD below.
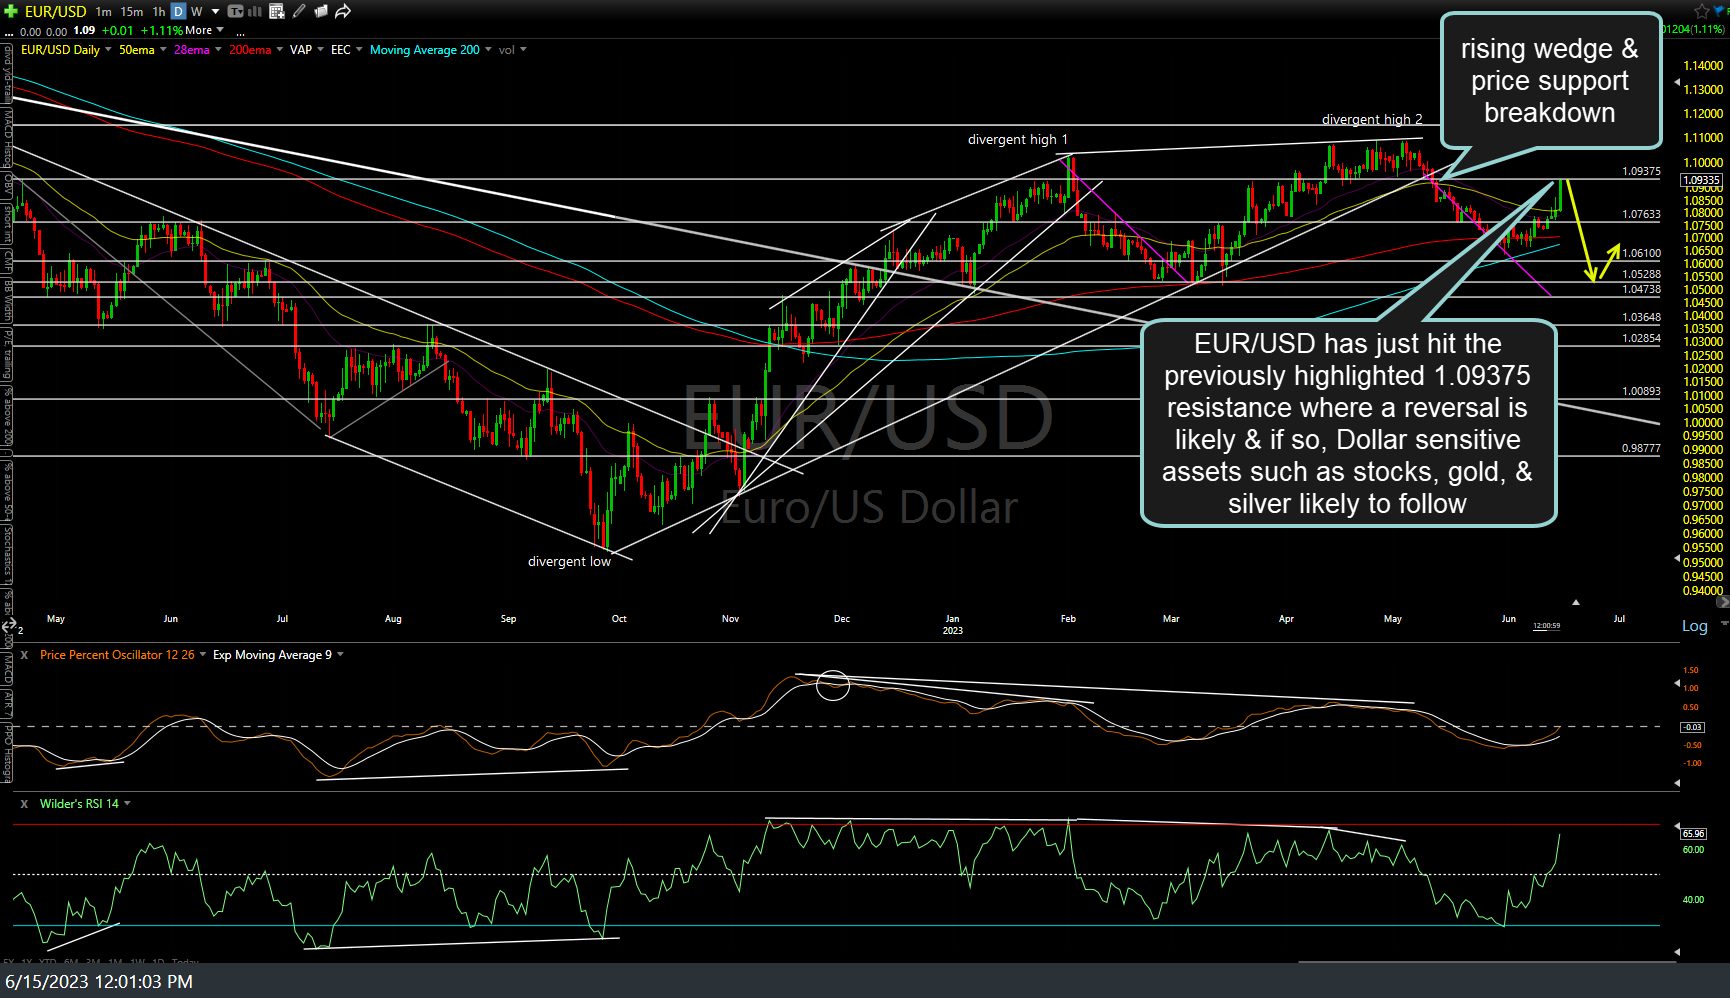
EUR-USD daily June 15th
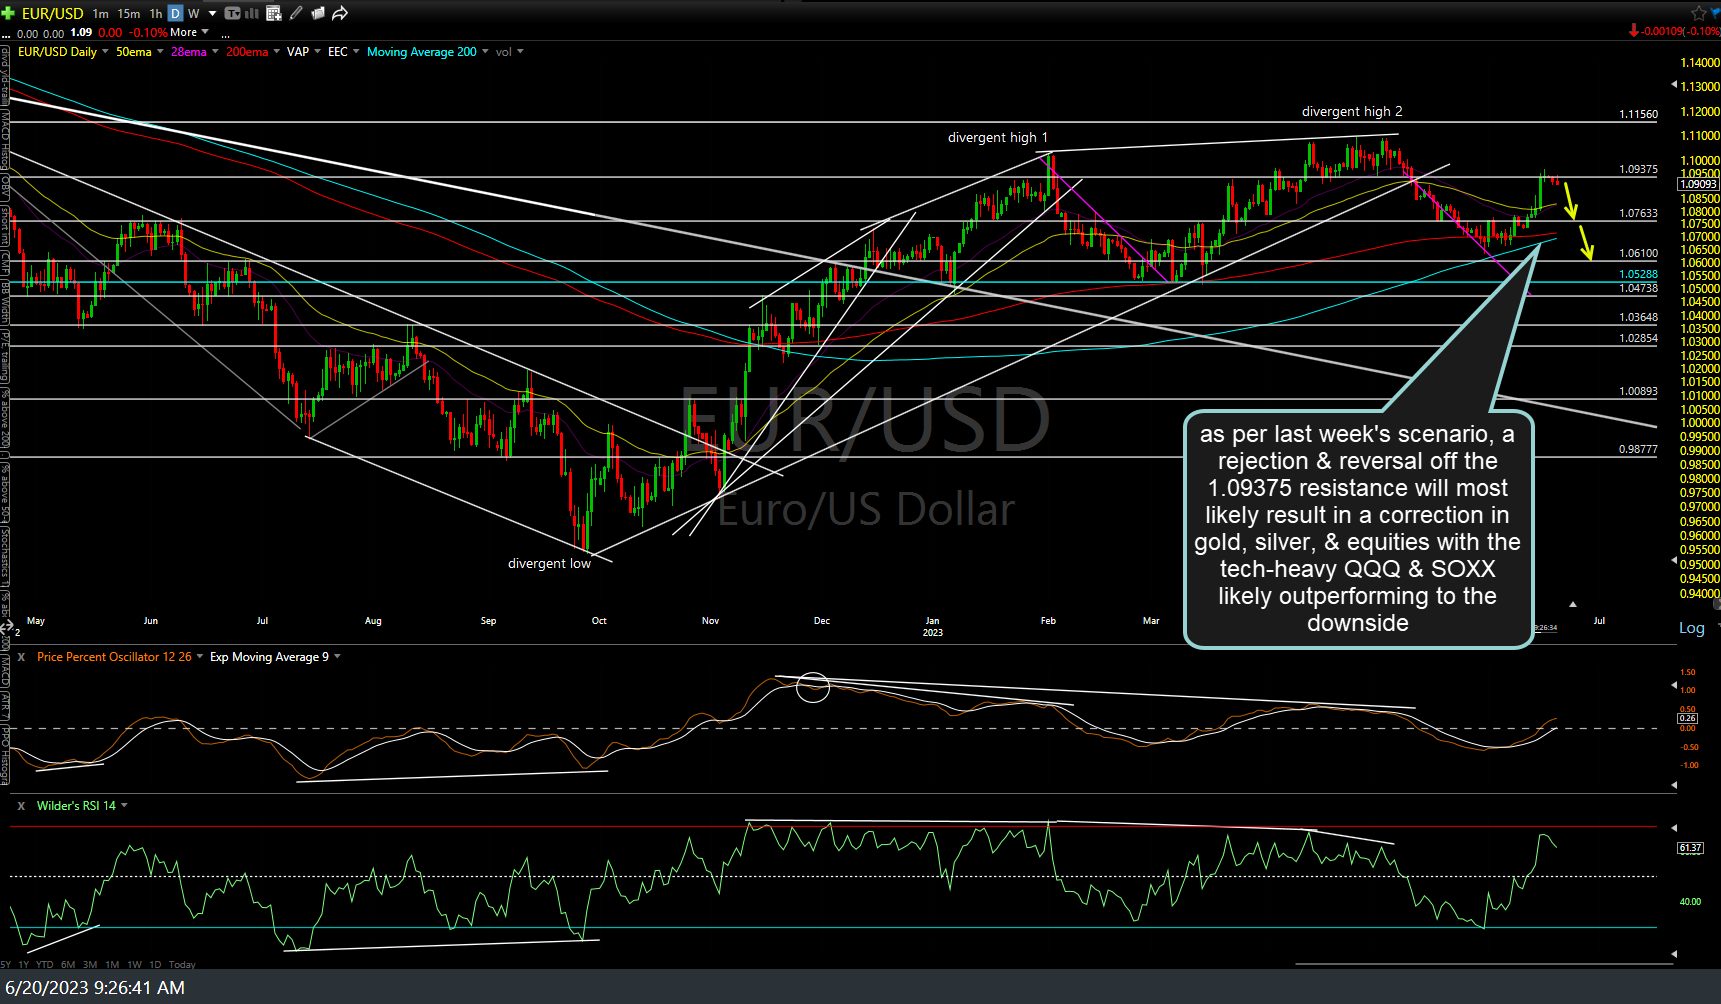
EUR-USD daily June 20th
The SOXX (semiconductor sector ETF) short trade is currently testing the S2 support level while below the rising wedge pattern with the next sell signal to come on a solid break below S2. I view an snapback rallies up to but not above a backtest of the recently broken minor uptrend lines in both QQQ & SOXX as objective add-ons or new short entries. Updated 60-minute chart below.
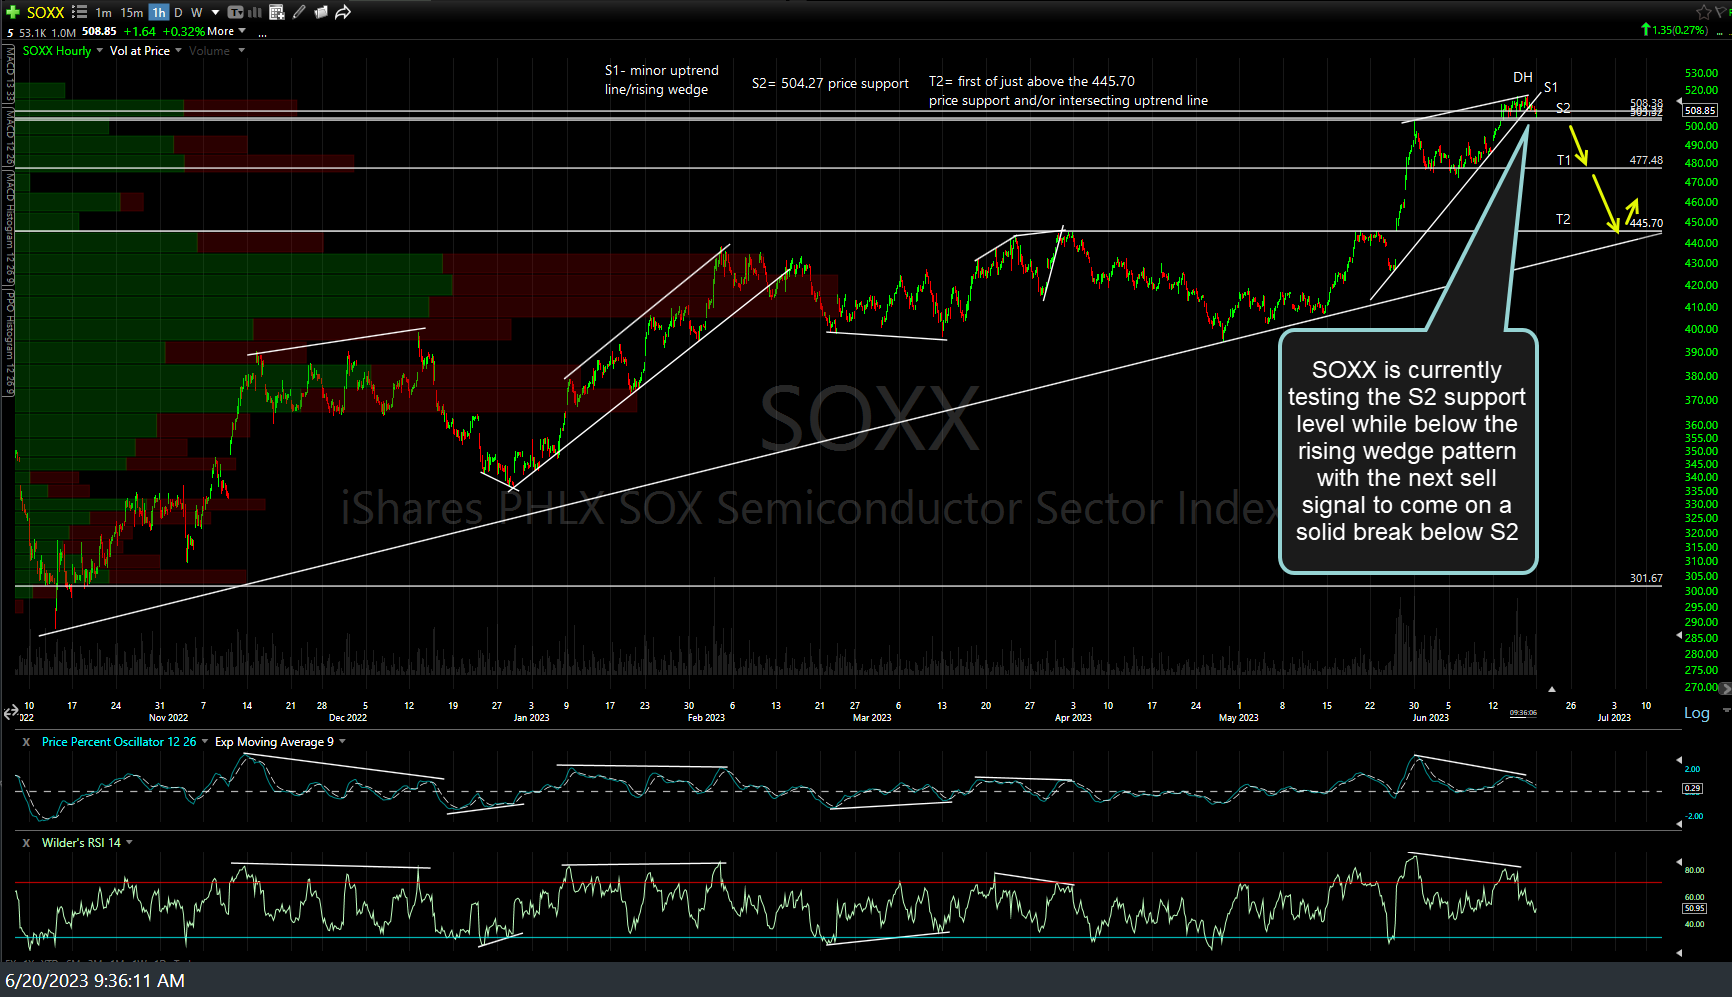
SOXX 60m June 20th
/ZN (10yr T-note futures) will offer an objective long entry on a break above this 60m bullish falling wedge or today’s high of 113’105. T1 at just below the 114’235 resistance level is the first & currently sole target with the potential for additional targets (T2 & T3 on the 60-minute chart below) to be added, depending on how the charts develop going forward.
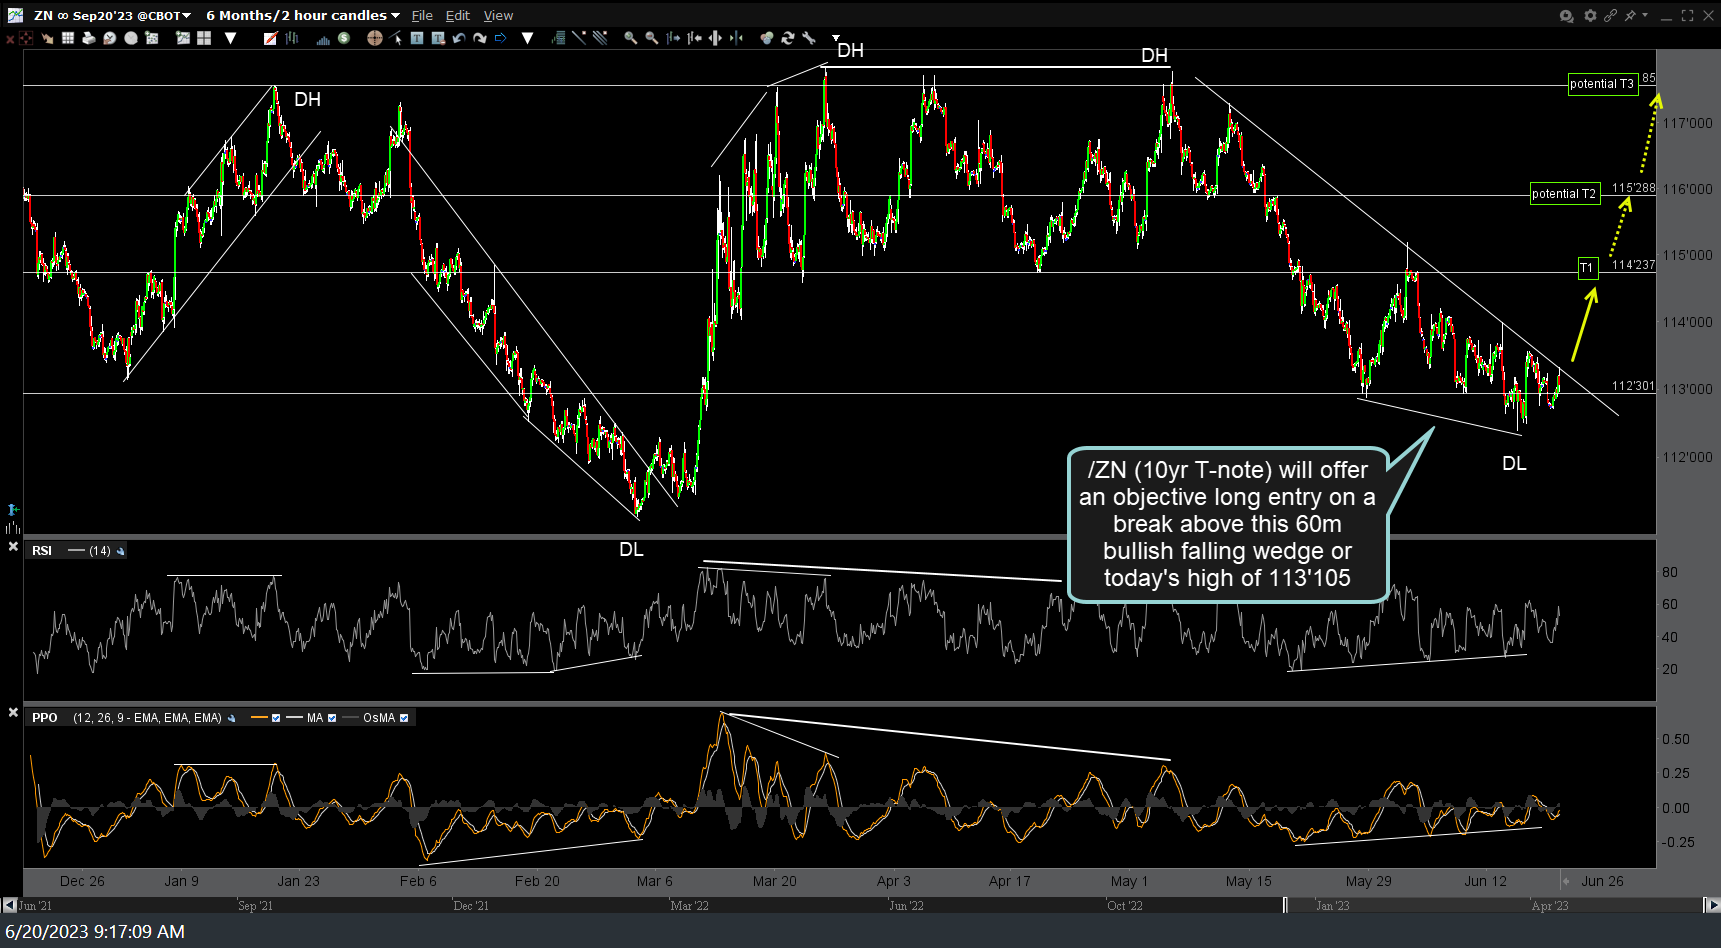
ZN 60m June 20th
For ETF traders, IEF (7-10 Treasury note ETF) will offer an objective long entry if/when /ZN breaks out above its comparable 60-minute bullish falling wedge pattern. Due to the inherently low volatility & below average gain/loss potential in medium-term Treasury bonds, the suggested beta-adjusted position size for IEF is 2.0-3.0 & suggested stops based on one’s preferred price target(s).
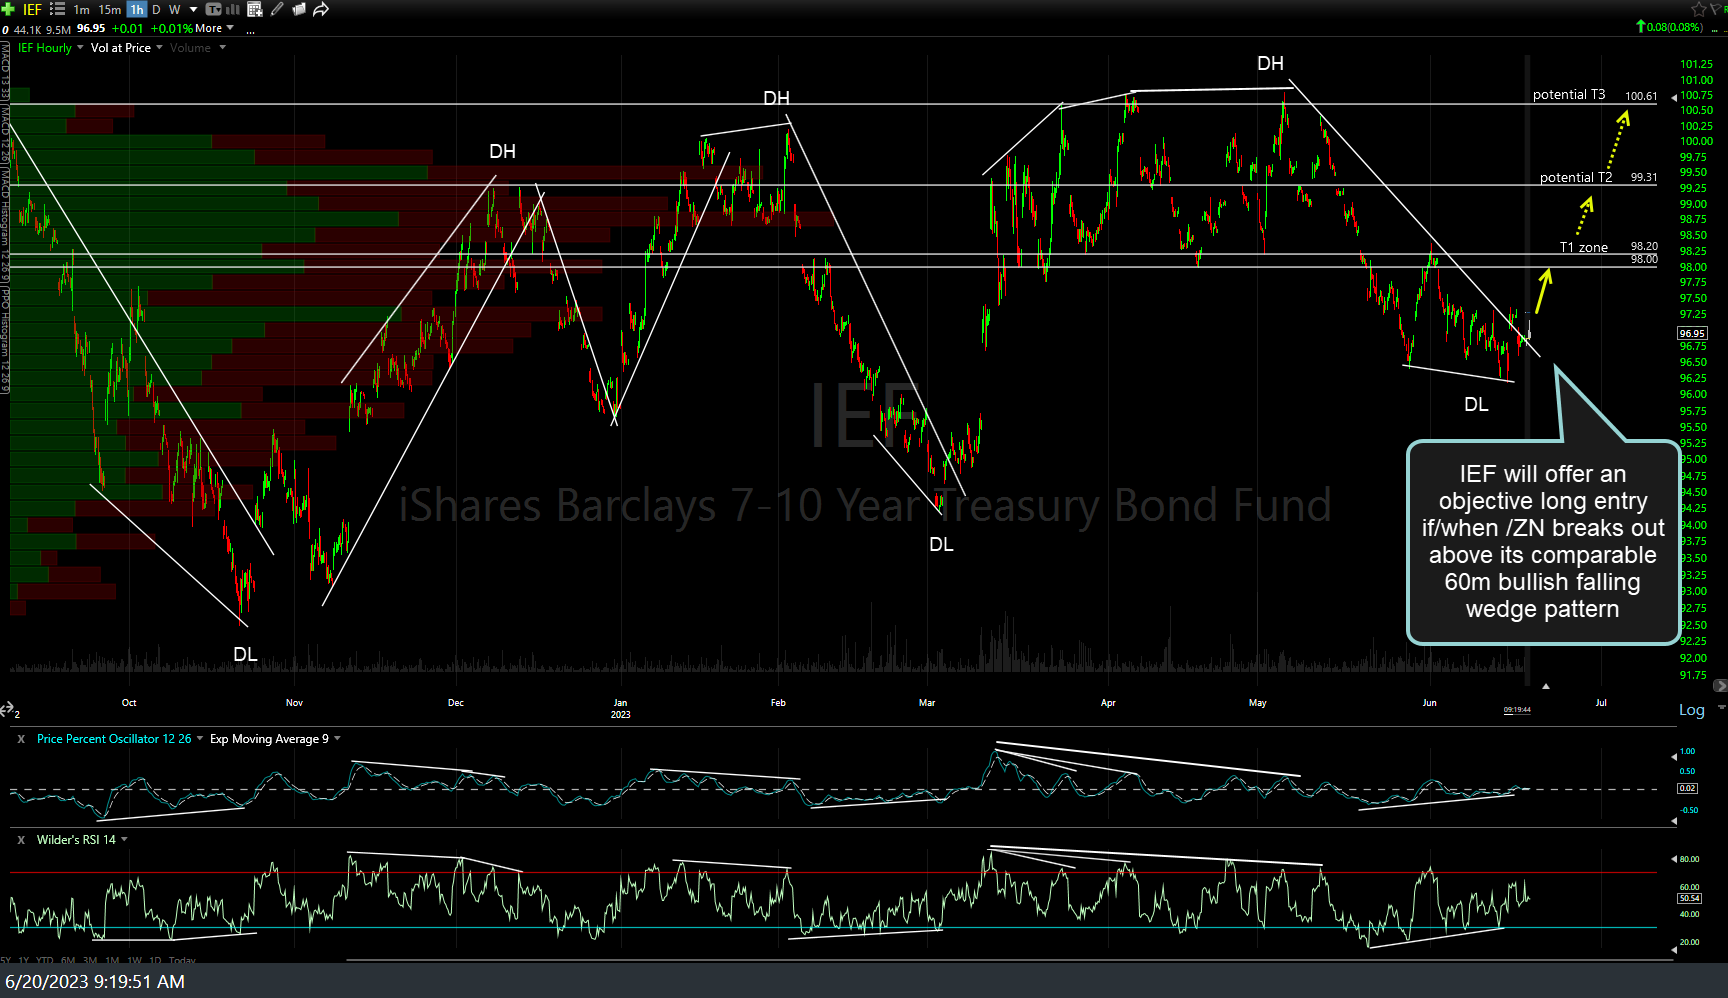
IEF 60m June 20th