
I’ve struggled to find any timely & actionable trades worth highlighting that weren’t already covered this week & I’d also like to remind everyone that today marks the end of a monthly, quarterly, and yearly accounting period. As such, I would take anything that happens today (breakouts, breakdowns, etc..) with a big grain of salt. As today seems to be about as good a day to refrain from trading as it gets, I plan to cut out early today to spend time with my family & want to wish everyone a safe, happy, & prosperous new year!
I figured that I’d leave you with at least one chart that helps to highlight the fact that despite the recent rally, which has recouped most (but not all) of the 8.34% drop in the Nasdaq Composite Index, not only have the market internals not improved, as one might expect when the stock market rallies, but the divergences that I’ve highlighted in recent weeks have only grown larger. While I’ve seen divergences build over a longer period of time on one of my favorite breadth indicators, the $NAAD (Nasdaq Advancing vs. Declining Issues), such as the divergences leading up to the start of the great bear market of 2007-2009, I can’t recall another period where the divergence has been so pronounced, with a continued & very steep drop in the $NAAD as the Nasdaq Composite powers to withing spitting distance of its all-time high.
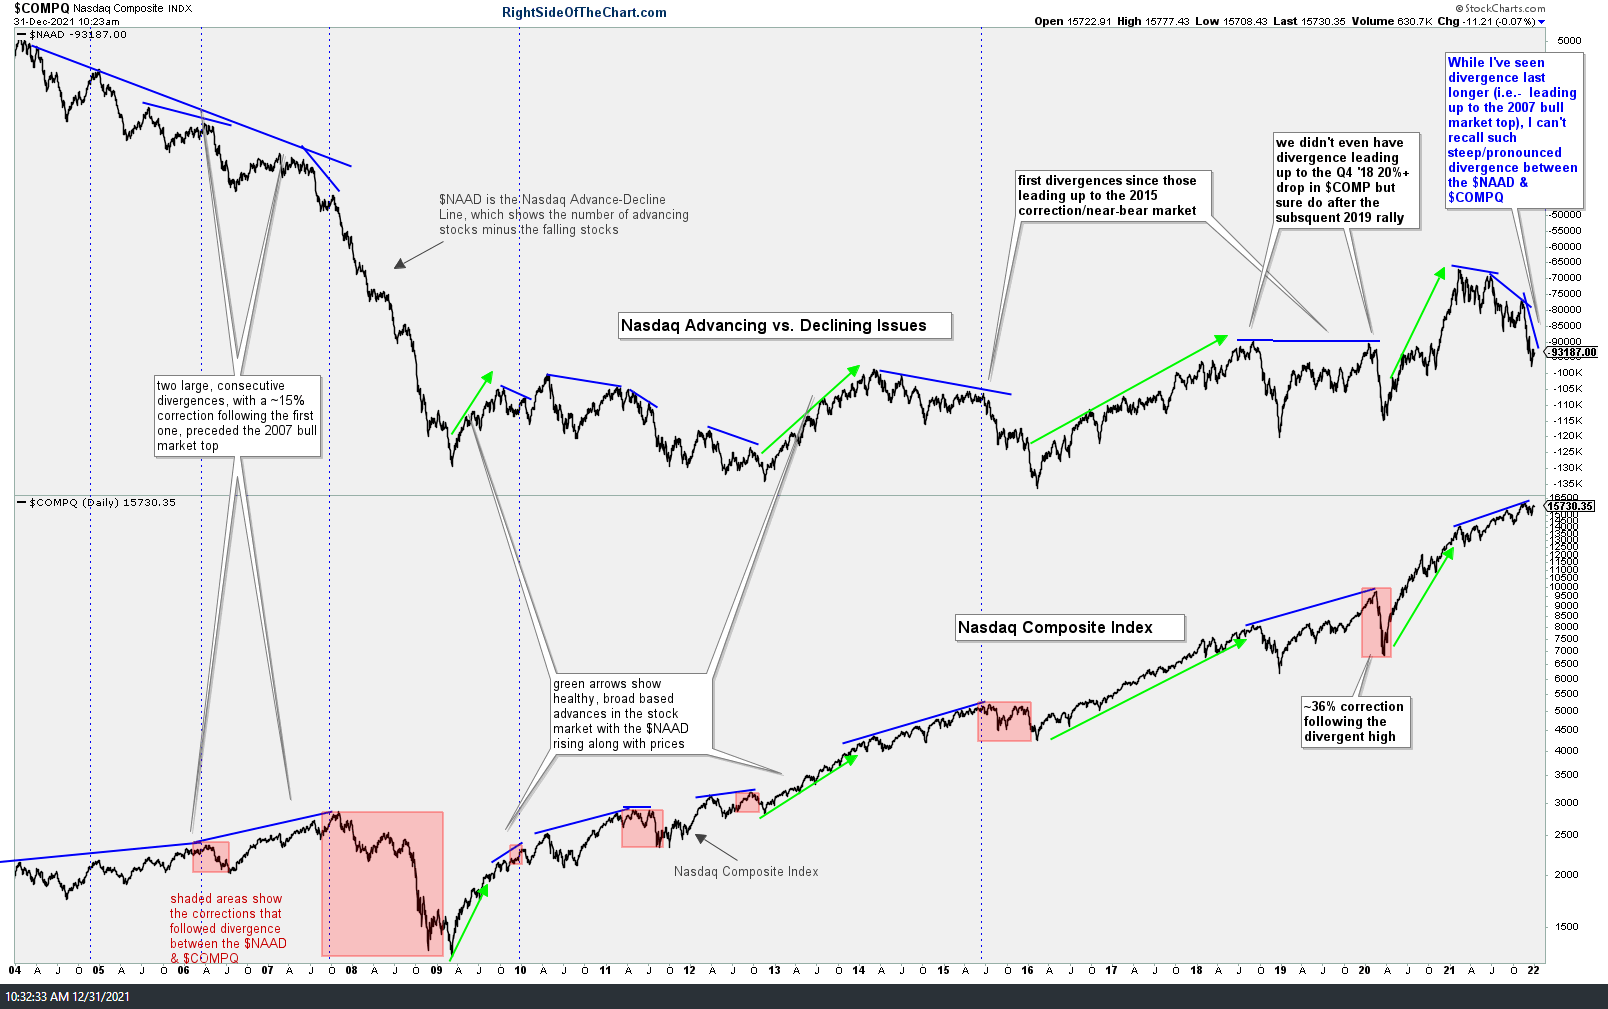
$NAAD vs $COMPQ Dec 31st
As I like to say, market breadth deterioration, just like negative divergences & overbought conditions, is not a sell signal, merely an indication or caution sign that the odds for a substantial correction and/or more significant trend reversal are elevated. As such, we’ll continue to monitor the price action on the 60-minute, daily, weekly, & even monthly charts to help guide our positions on any stock index-related trades as we head into 2022.
Happy New Year
-rp