
/CL (crude futures or USO, crude oil ETN) will offer an objective short entry, including an indirect hedge to the QQQ swing short, on a solid break below this 60-minute bearish rising wedge pattern.
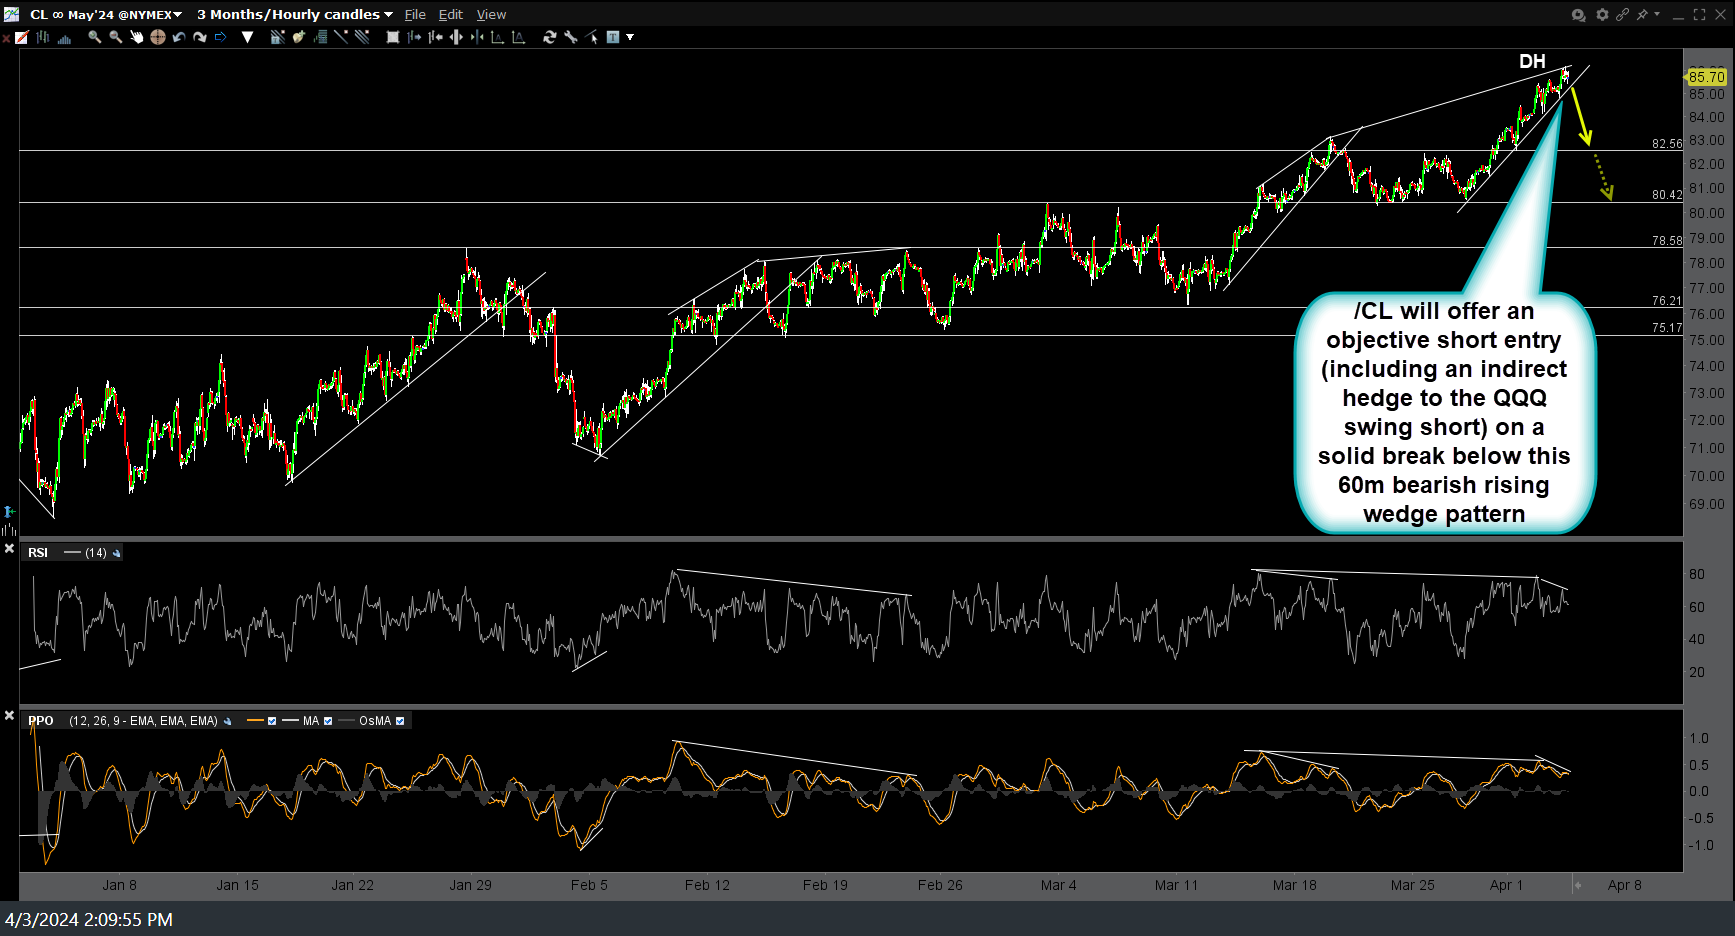
CL 60m April 3rd
On a very much related note & as pointed out in recent videos, both the 10 & 30 yr Treasuries have positive divergences on the 60-minute chart which have the potential to spark the next counter-trend rally with IEF (7-10 yr Treasury bond ETF) currently backtesting the YELLOW ZONE from below. Net bullish for the stock market IF these divergences play out for a rally, especially if IEF regains the GREEN ZONE, very bearish if IEF is rejected here at resistance & takes out the divergences on another leg down.

IEF 60m April 3rd
Again, IEF is currently testing the bottom of the YELLOW ZONE (which is price resistance around 93.50) from below. As I like to say, resistance is resistance until & unless taken out. Therefore, there are two “plays” here:
- Short here (or add to a short position) Treasuries here with a stop somewhat above …or…
- Wait for a solid breakout back into the YELLOW ZONE to go long IEF or /ZN (or /ZB, TLT, etc..). TLT 60-minute chart for reference below.
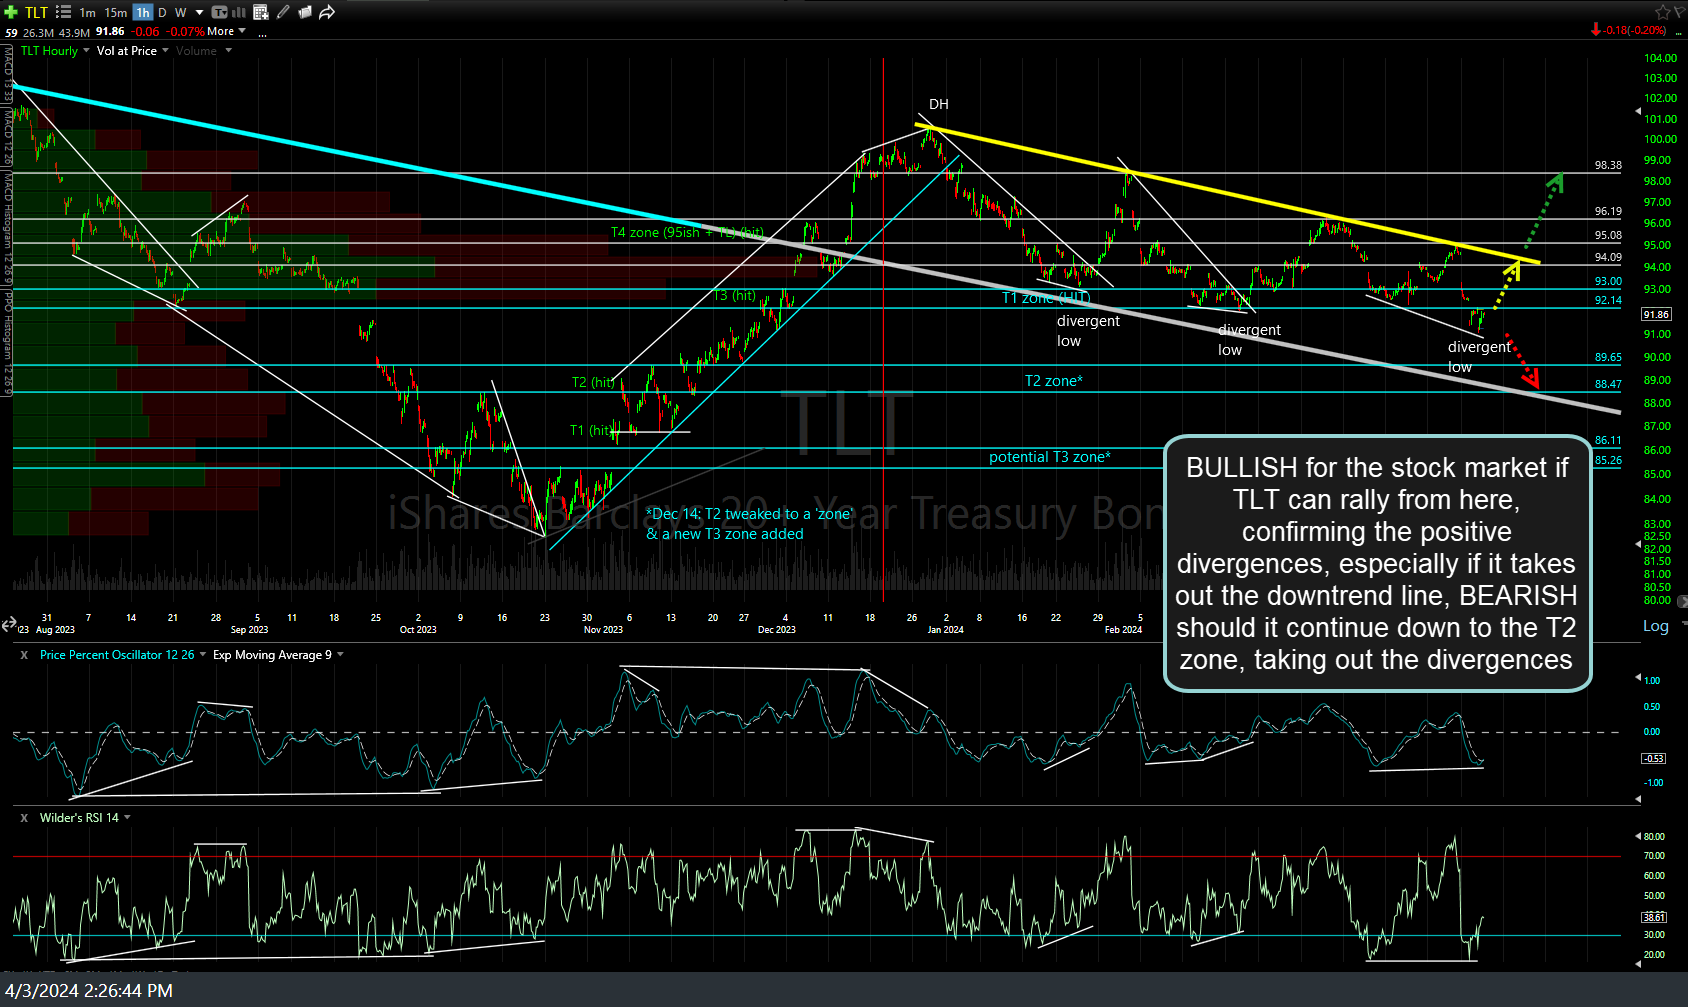
TLT 60m April 3rd
A long on Treasuries could also serve as an indirect hedge to the active QQQ swing short position as a solid rally back into the yellow zone, & especially back into the green zone, would be net bullish for equities as long-term rates fall (*unless that rally is due to a flight-to-safety bid due to QQQ breaking down below my key 433 support). As always, I like to make an upwards beta-adjustment to my position size on Treasuries of 2.0+ (i.e.- twice or more the size of a typical position on SPY or QQQ) due to the relatively lower volatility & price moves.
Likewise, a short on crude oil, should the setup above trigger an entry, could also provide an indirect hedge to a QQQ short as the price of crude oil pretty much single-handedly drives inflation & as such, the yield on the 10-yr Treasury bond as the extremely tight positive correlation between the two on the chart below shows. (Remember, yields ($TNX) move directly inversely to bond prices (IEF) so a comparison between USO & IEF would show an inverse correlation).
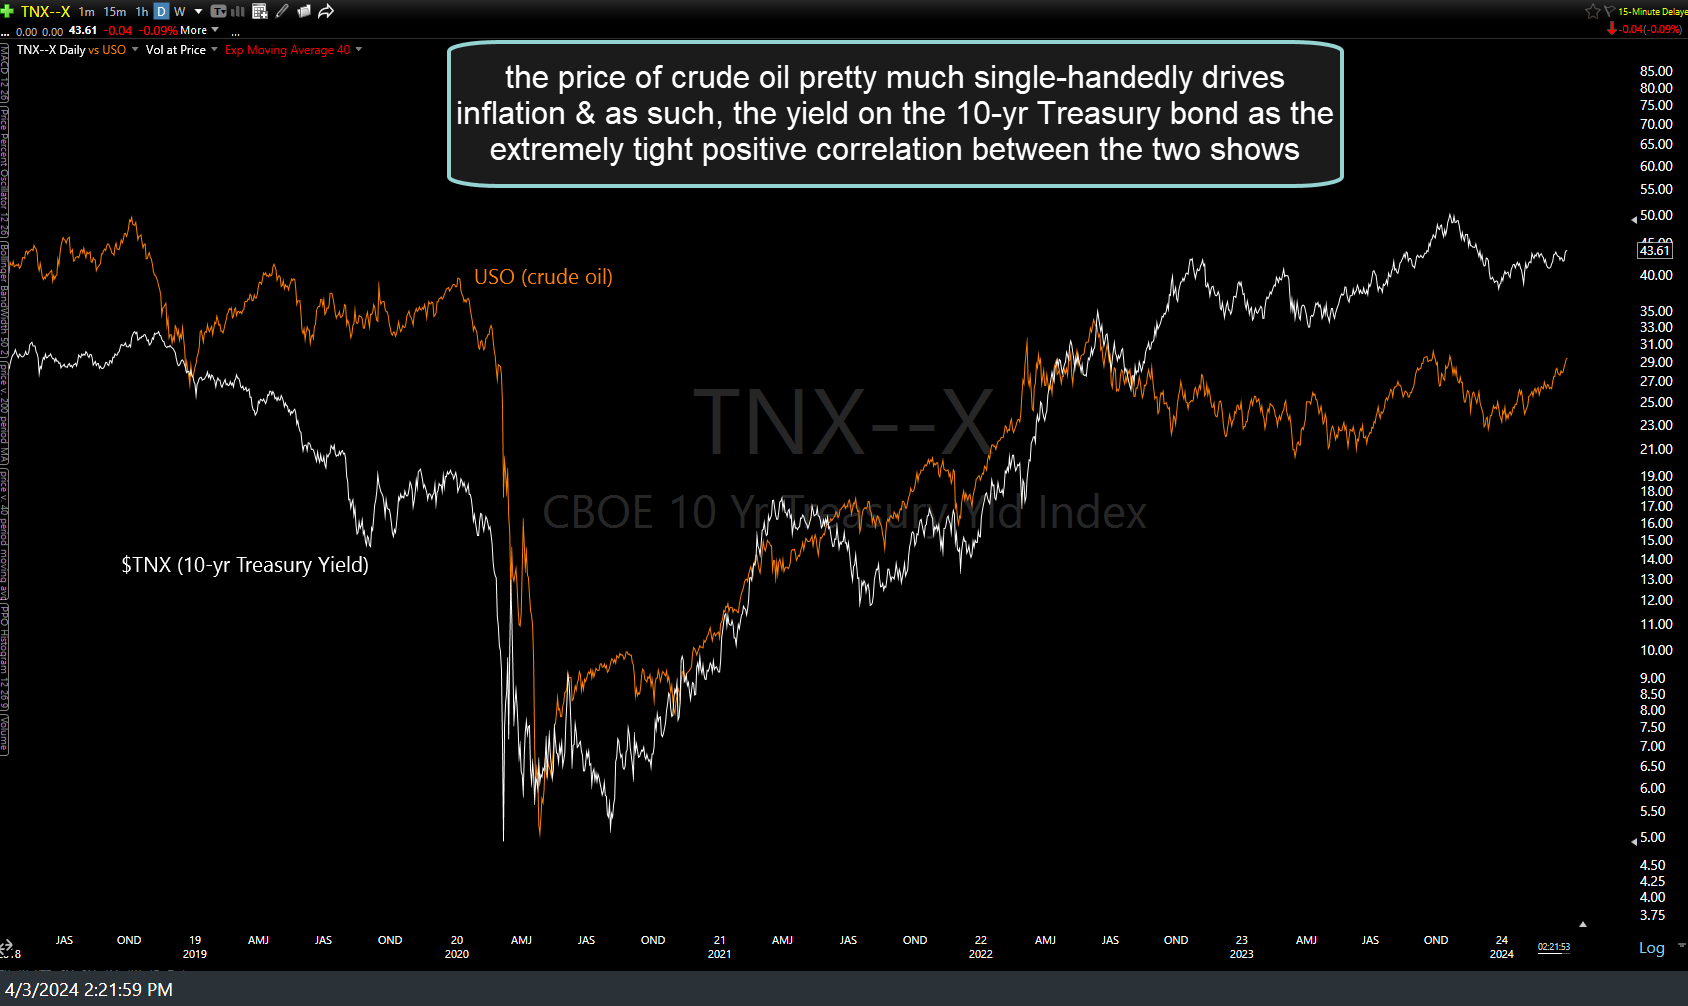
$TNX vs USO April 3rd