/NQ is currently backtesting dual trendlines (resistance) from below where at least a minor pullback is likely while /NQ remains comfortably above the key 8200 support level for now. 60-minute chart below.
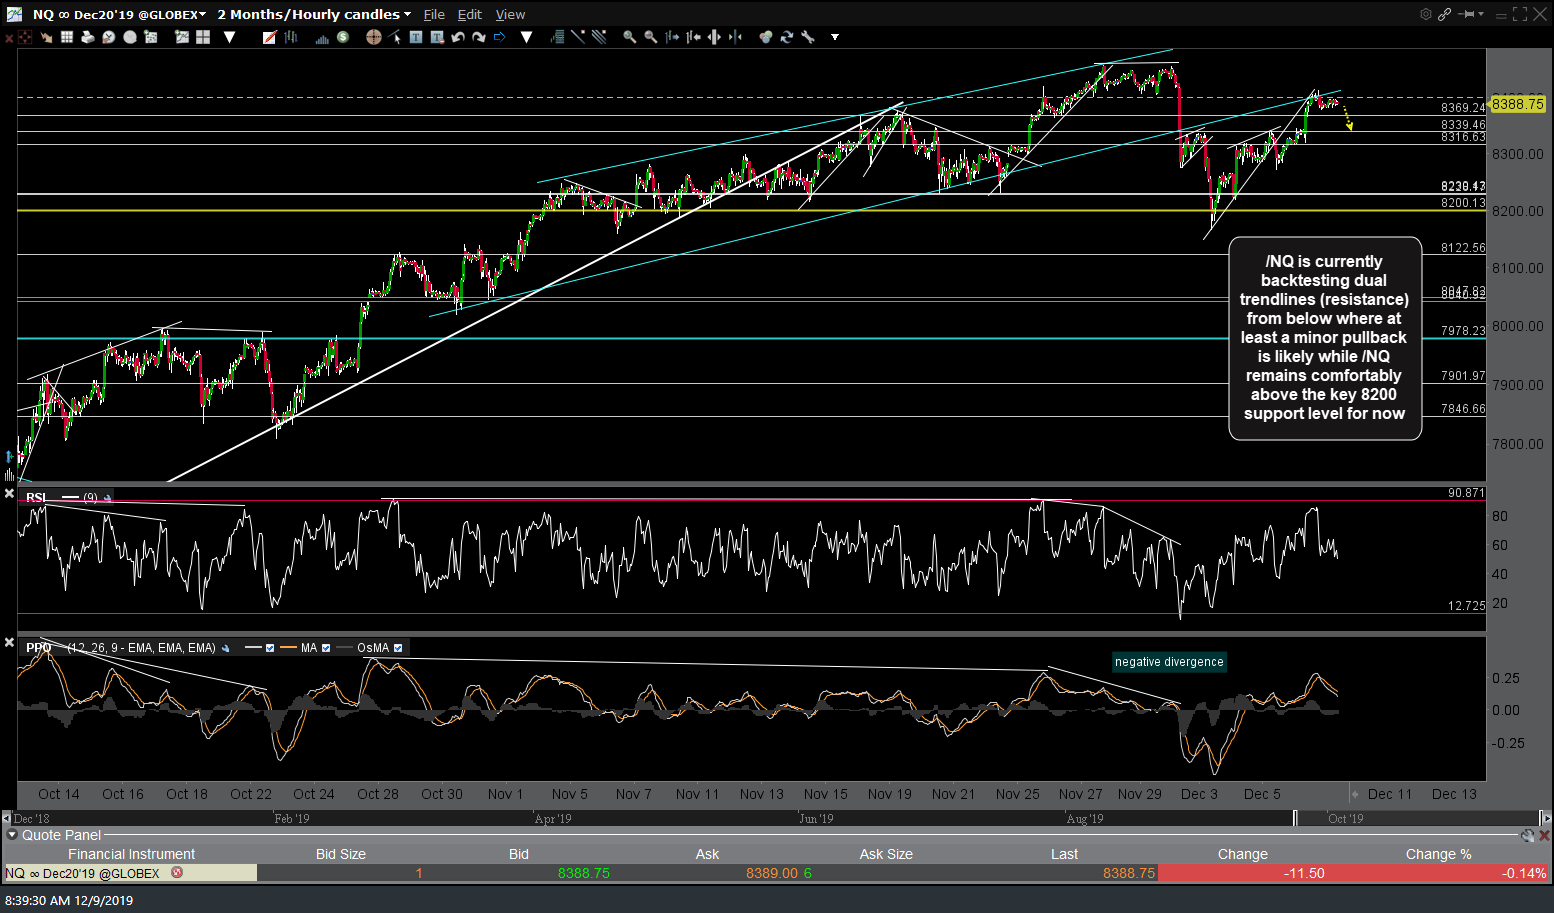
NQ 60m Dec 9th
/ES just backtested the recently broken blue uptrend line from below & is currently testing the white minor uptrend line with a near-term sell signal to come on a break below it. This extreme overbought reading indicates that any near-term upside is most likely limited at this point before at least a minor pullback or sideways consolidation (see previous circles & subsequent arrows).
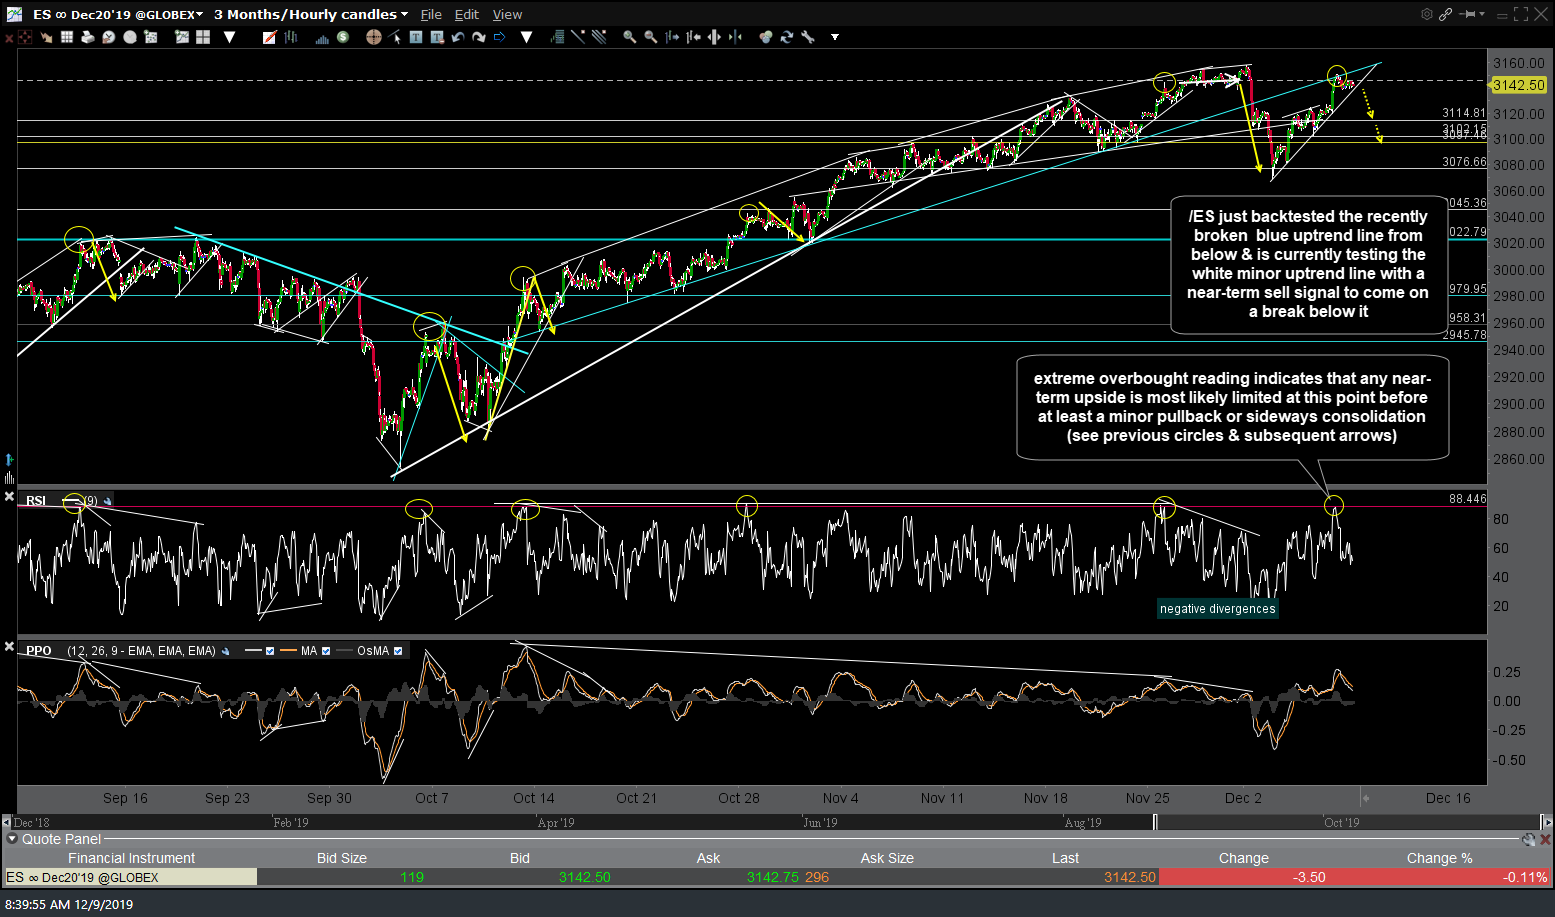
ES 60m Dec 9th
/ZB 30-yr Treasury bond futures remain above the 157’055 support following Friday’s successful test of that level which also put in a divergent low (bullish). 60-minute chart below.
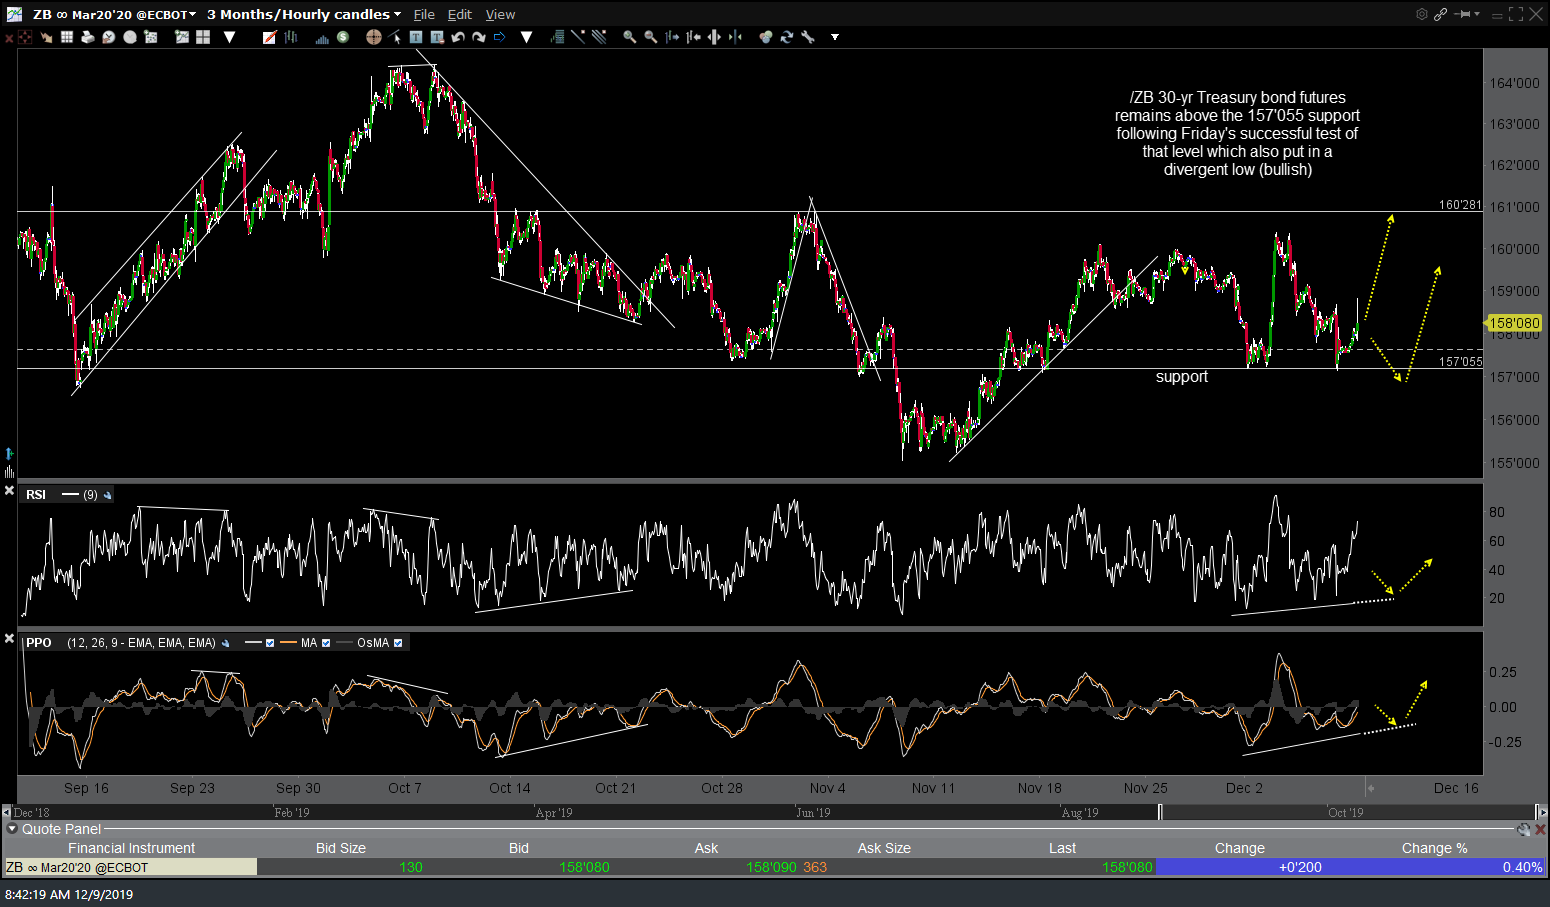
ZB 60m Dec 9th
The ‘other’ risk-off asset, /GC gold, continues to hold above the 1458 support level while gold remains within a larger 4-month consolidation range on the daily chart. 60-minute chart below.
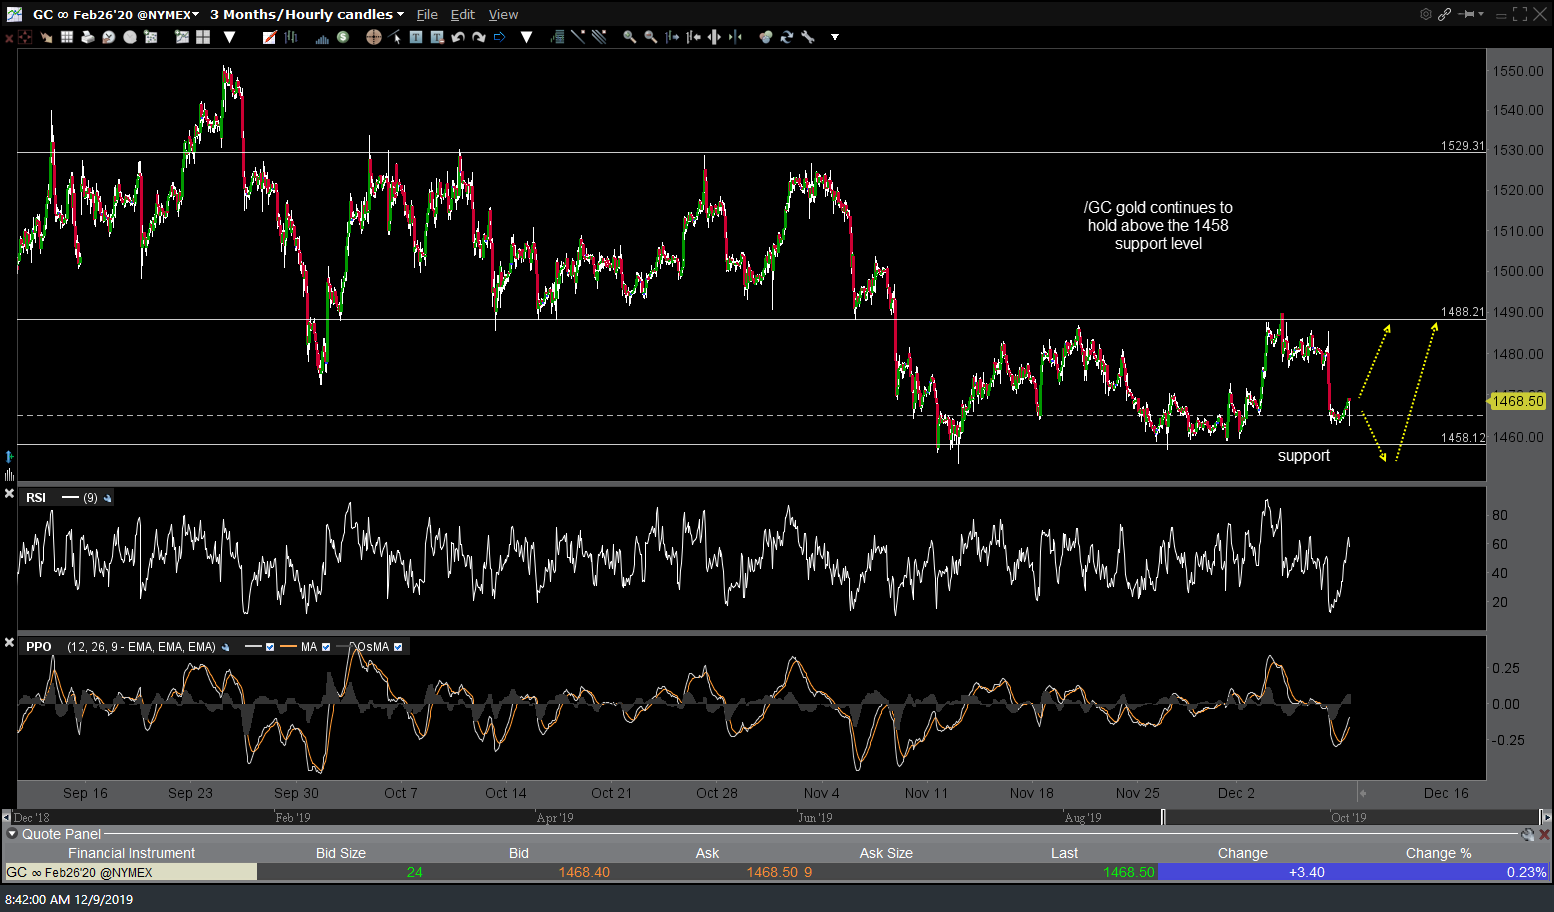
GC 60m Dec 9th
The recent break below the channel midpoint will prove to be a whipsaw if /PA prints a solid 60-minute candlestick close back into the top half of the channel although the negative divergences continue to build & are now larger than those preceding the 8.7% correction in early November. Regardless of whether or not /PA (palladium) can make a solid recovery of the top of the channel this week or not, the near-term upside appears limited due to the extreme overbought conditions.
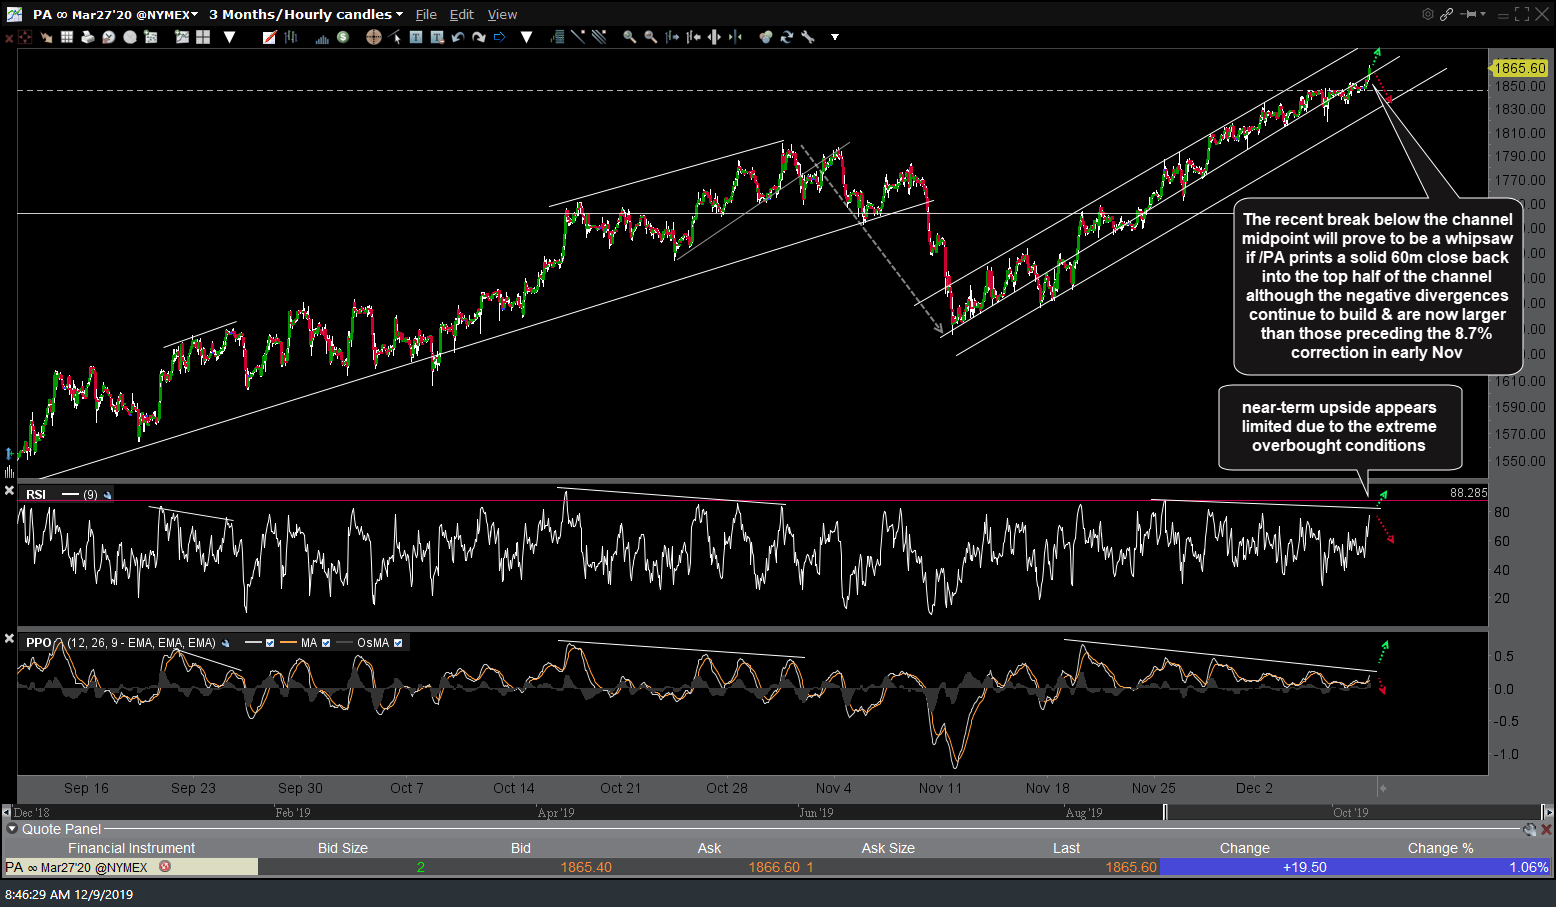
PA 60m Dec 9th
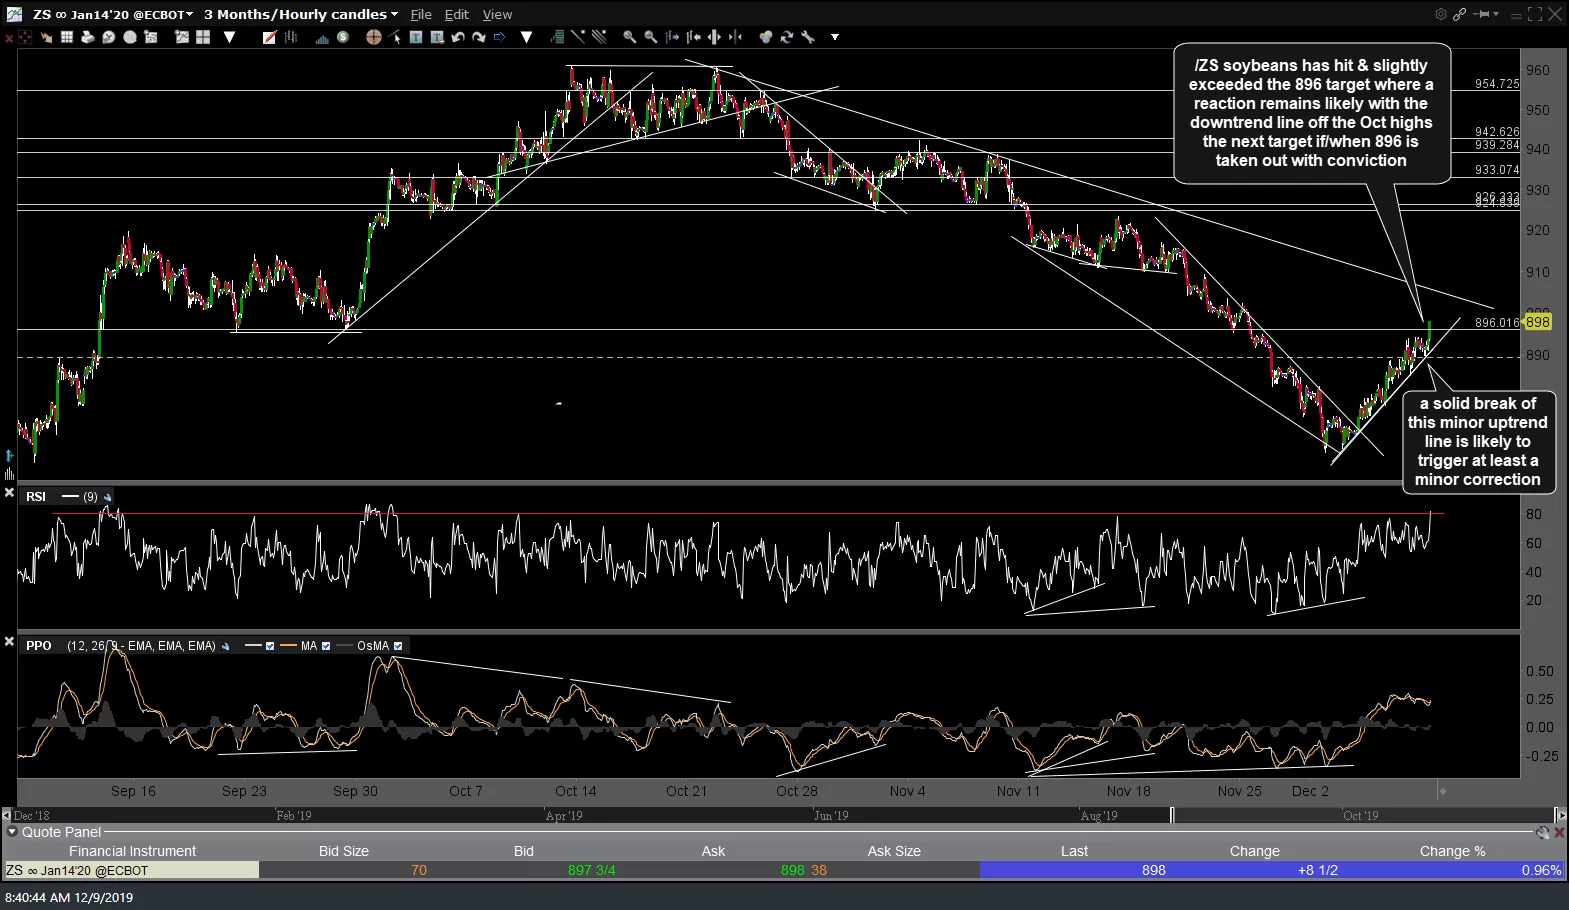
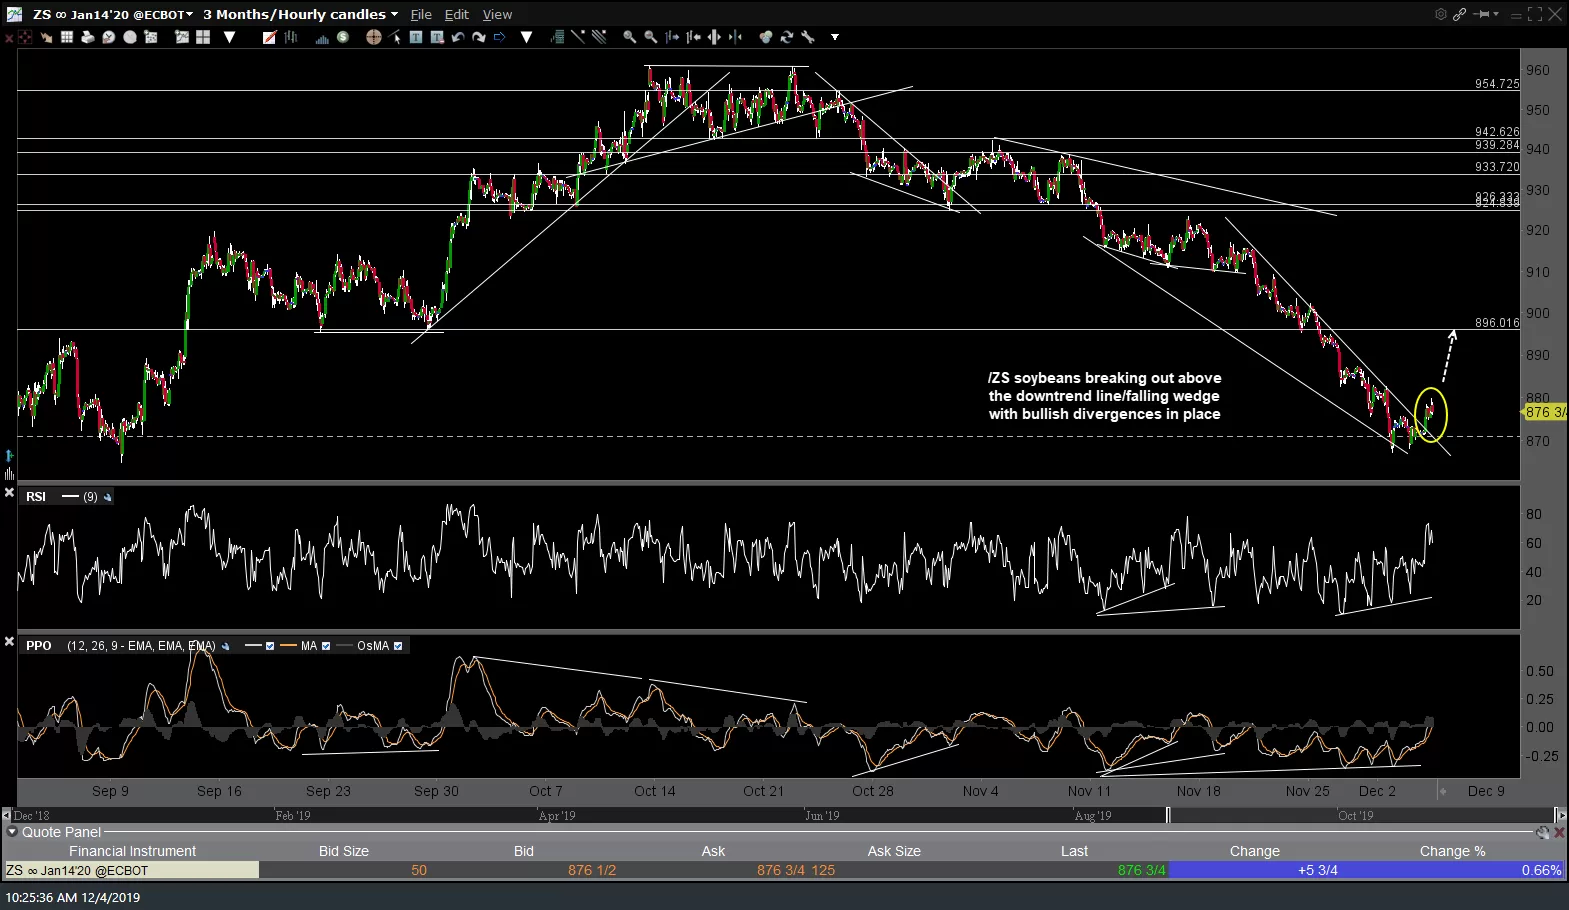
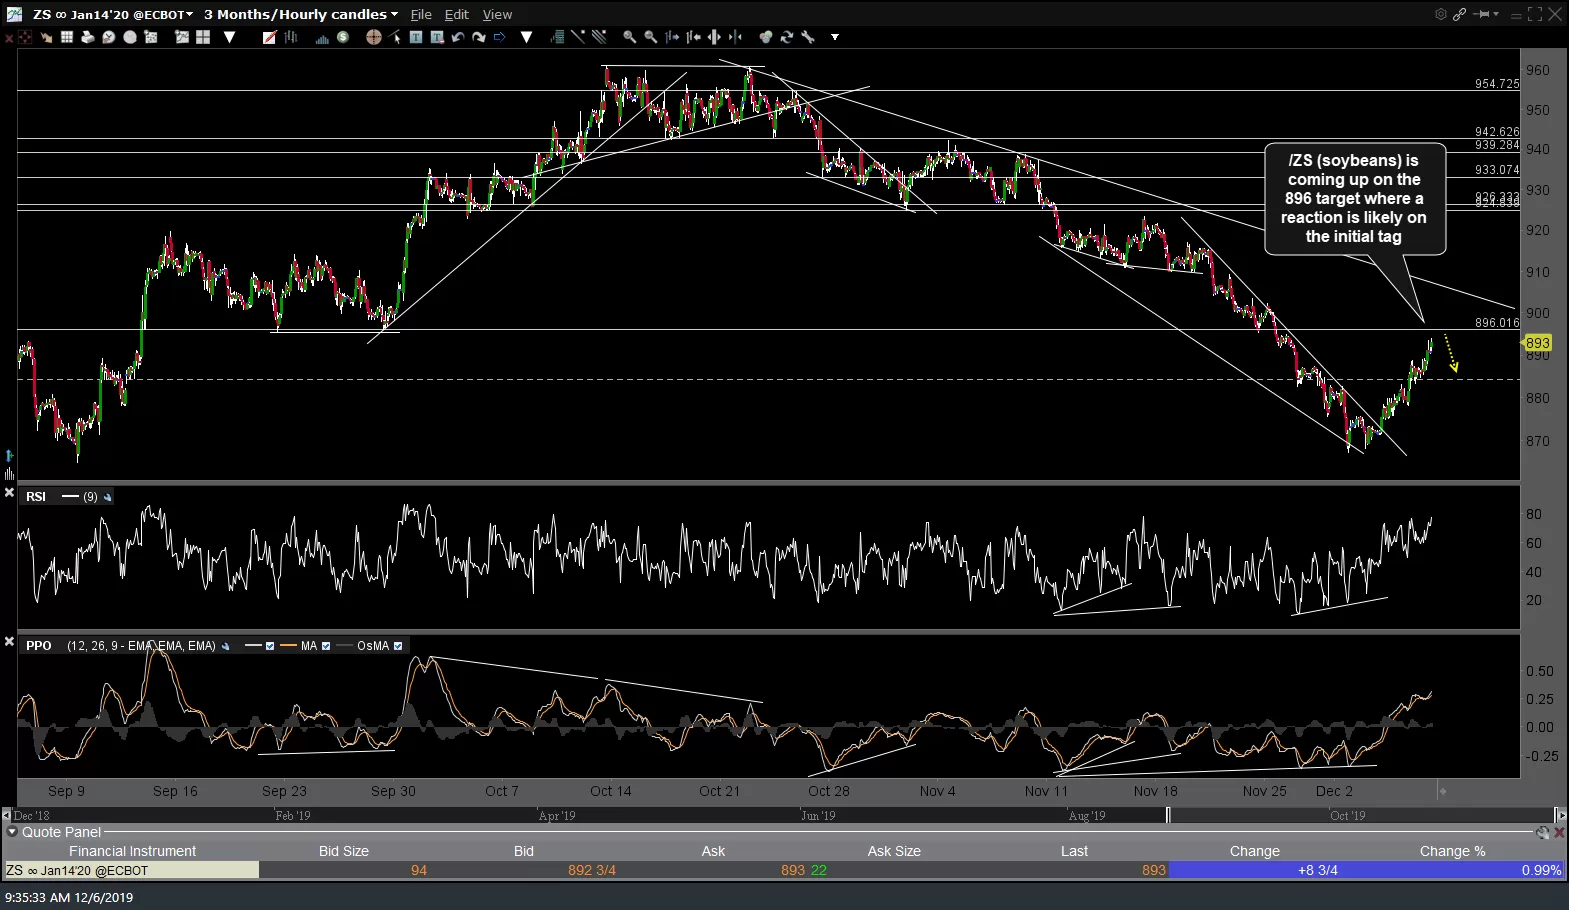
/ZS soybeans has hit & slightly exceeded the 896 target where a reaction remains likely with the downtrend line off the Oct highs the next target if/when 896 is taken out with conviction while a solid break of this minor uptrend line is likely to trigger at least a minor correction. Previous & updated 60-minute charts.
-
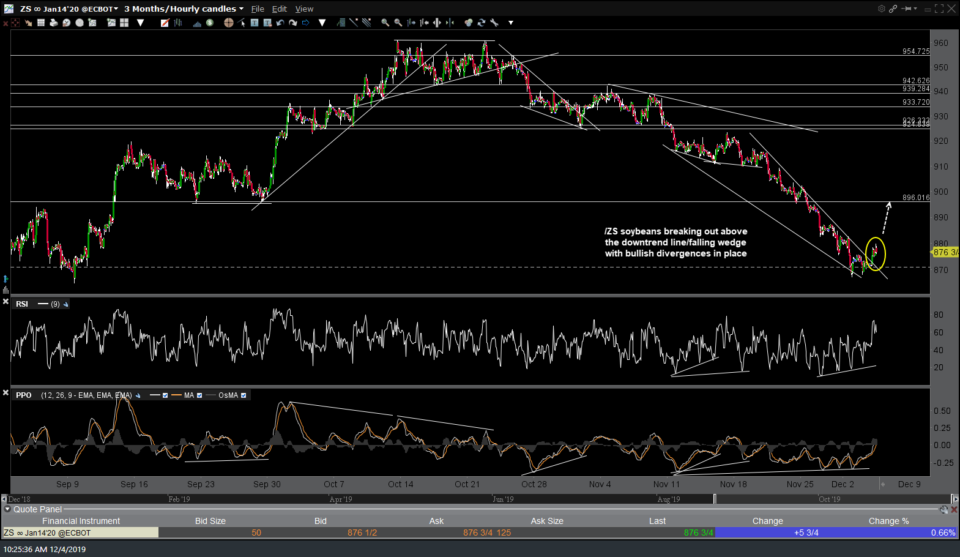
- ZS 60m Dec 4th
-
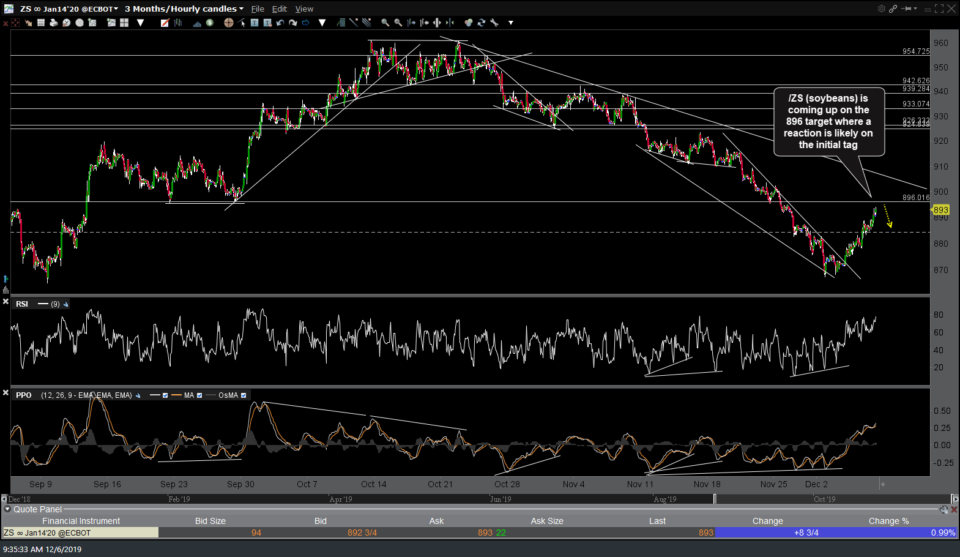
- ZS 60m Dec 6th
-
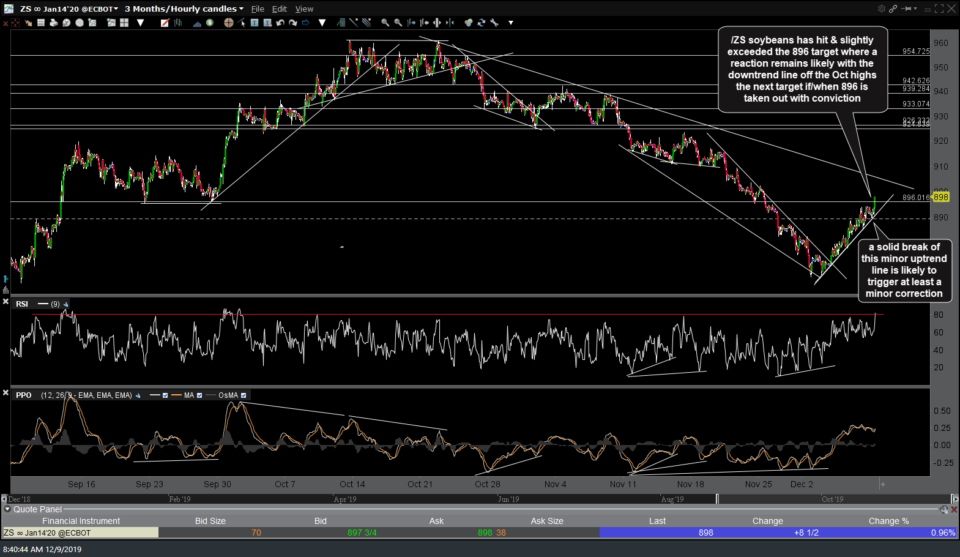
- ZS 60m Dec 9th