
As usual, I’ll start out with a quick look at the major stock indices although my primary focus remains on more attractive trading opportunities elsewhere with larger profit potential & more favorable R/R profiles, at least for the time being. /NQ (Nasdaq 100 futures) is cracking below the trendlines once again although the more important level for a near-term sell signal remains a solid break below 8200.
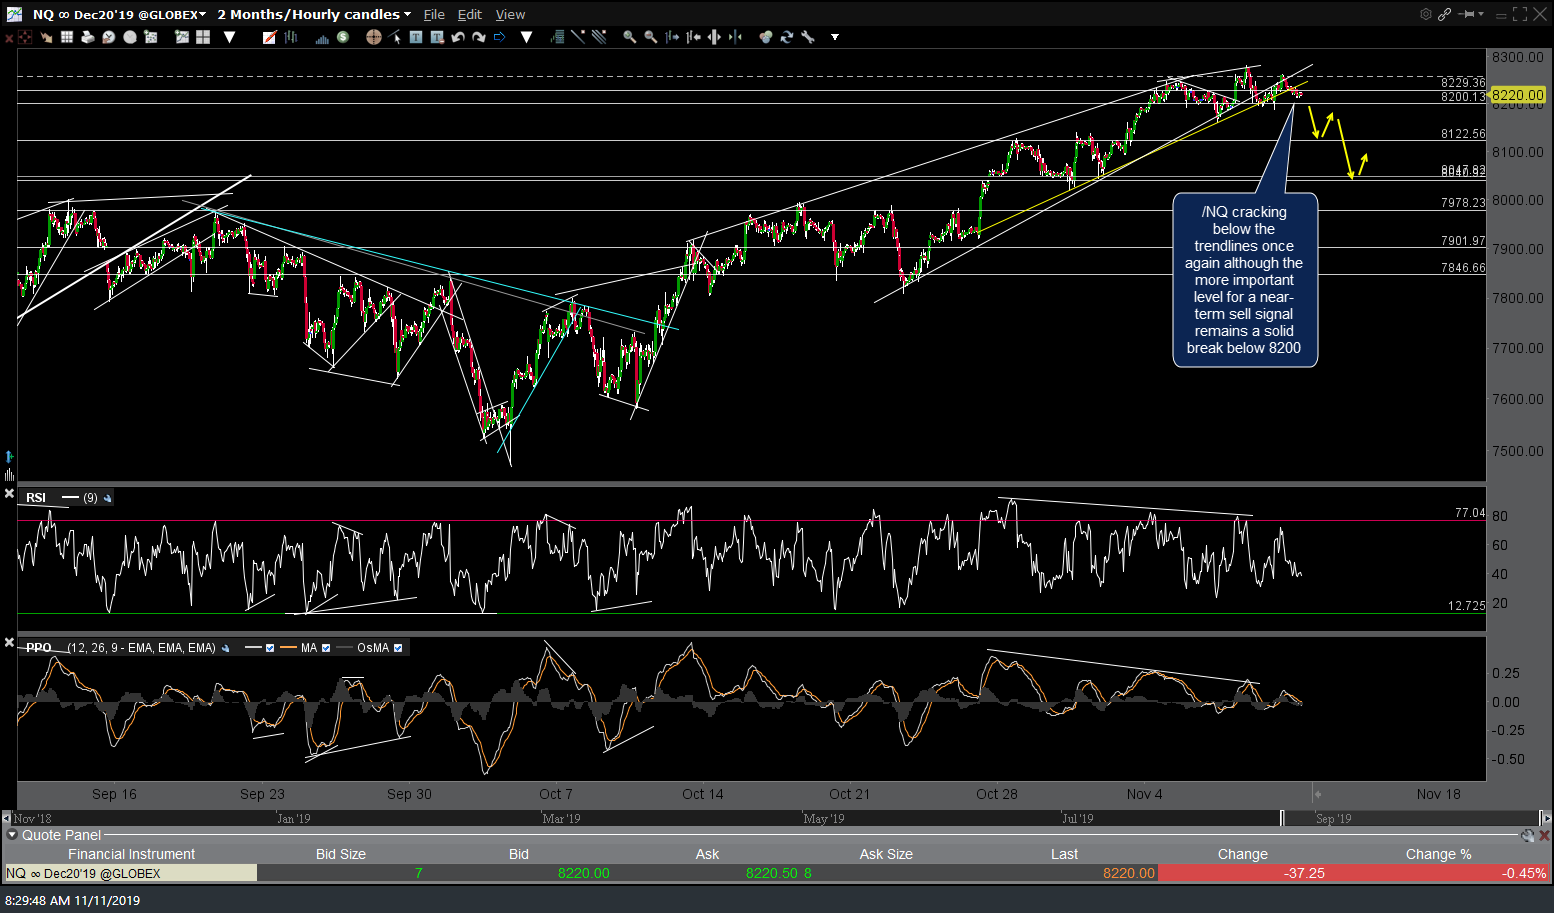
NQ 60m Nov 11th
The negative divergences are still very much intact on /NQ & /ES (shown here) with 3023 still a likely pullback target, should both /NQ & /ES trigger sell signals soon.
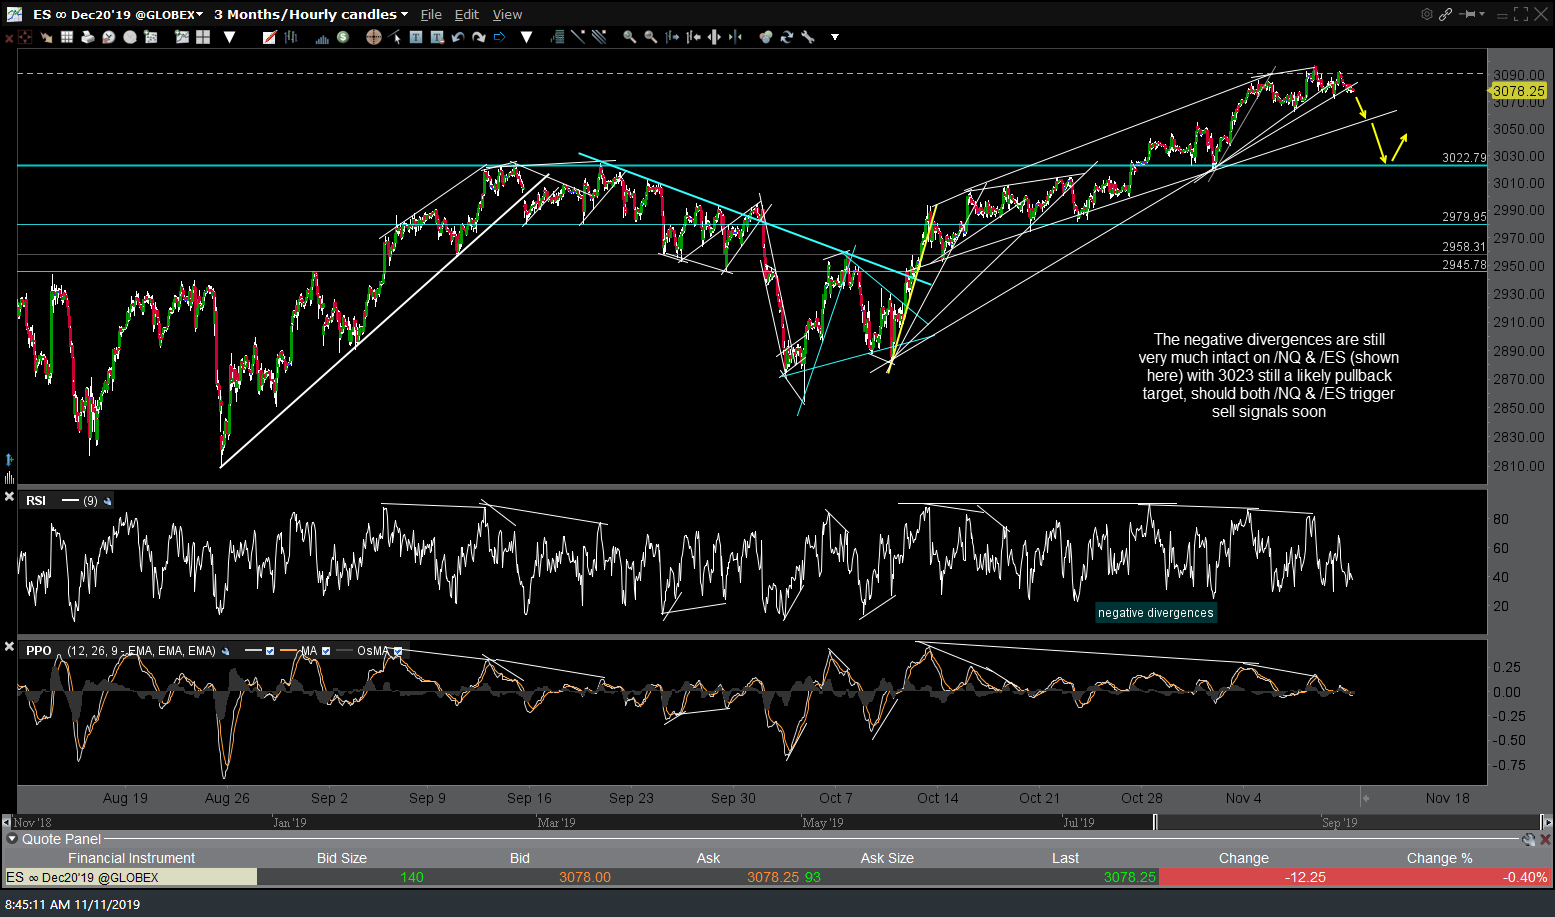
ES 60m Nov 11th
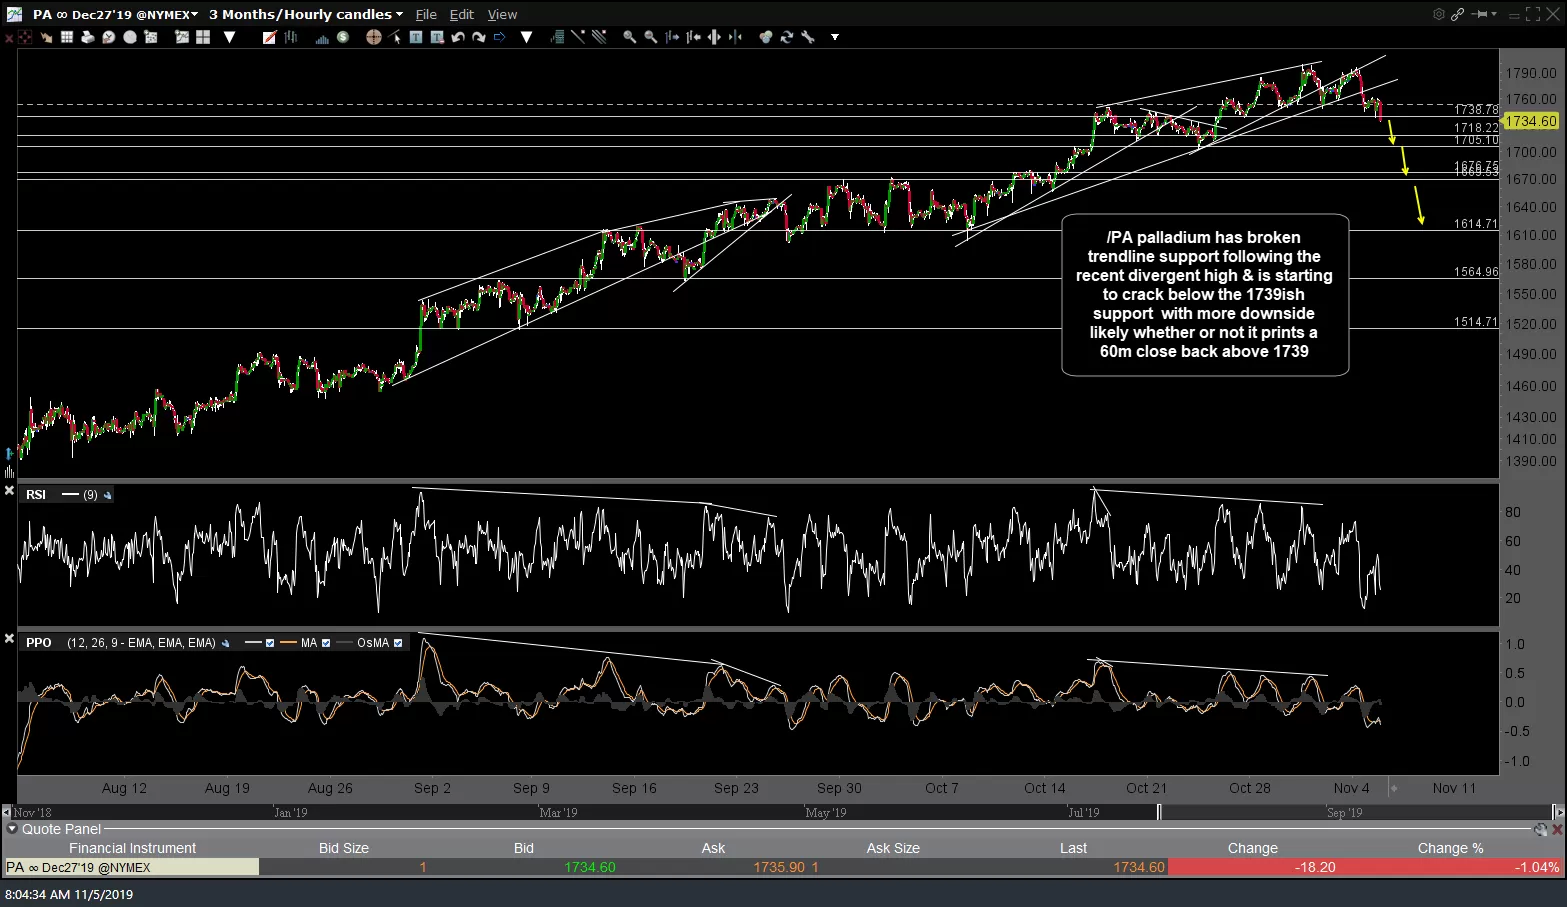
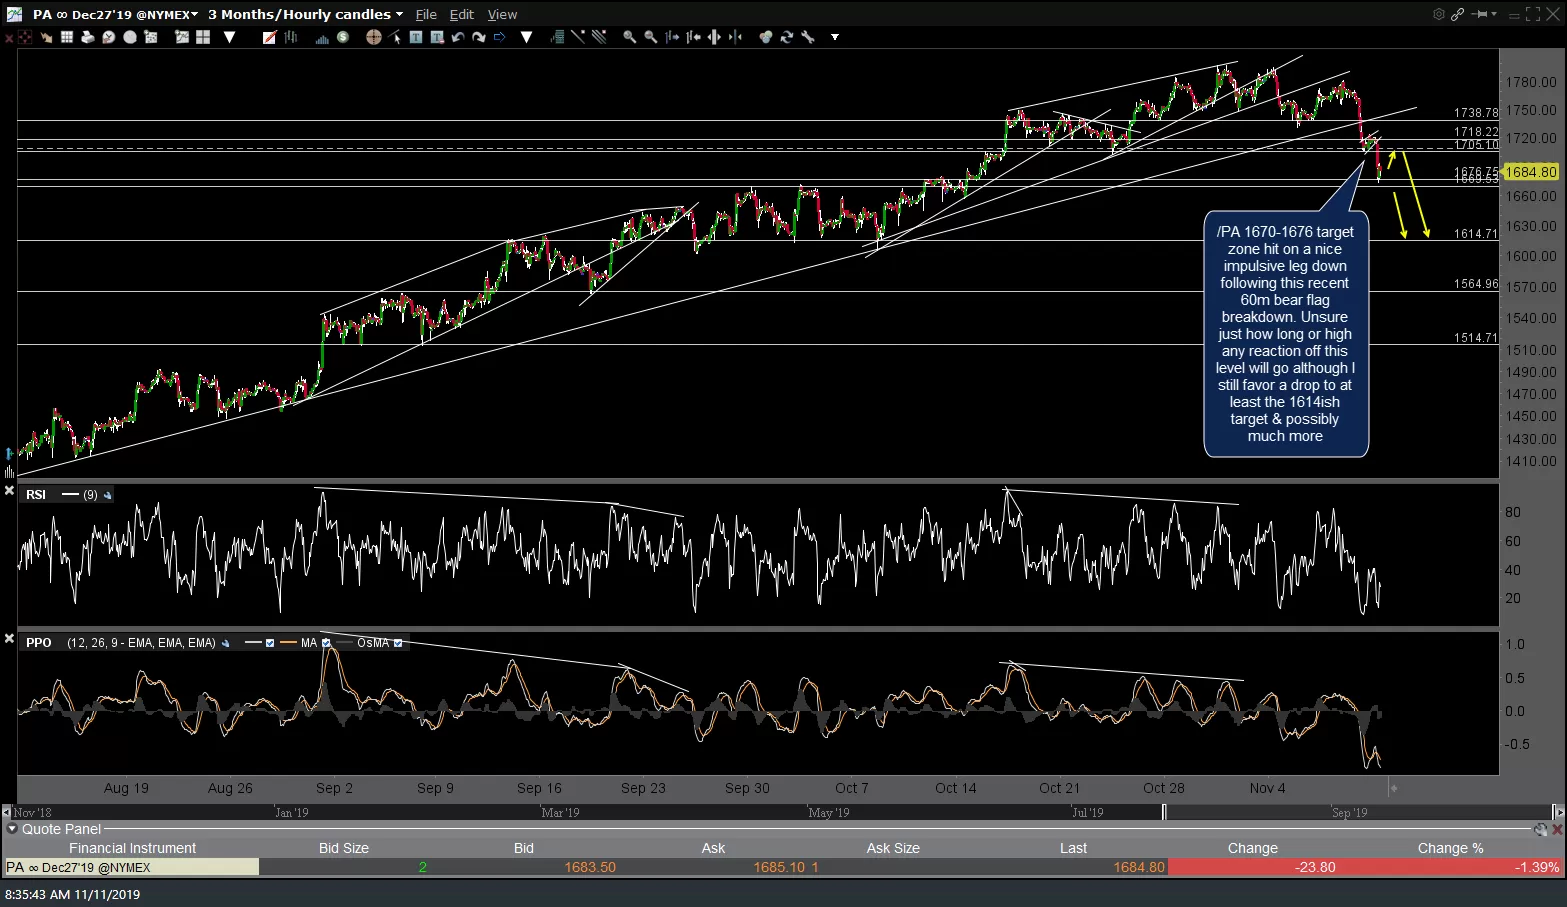
The /PA (palladium futures) 1670-1676 target zone has now been hit on a nice impulsive leg down following this recent 60-minute bear flag breakdown. I’m unsure just how long or high any reaction off this level will go although I still favor a drop to at least the 1614ish target & possibly much more. The 60-minute chart from the PALL & /PA short setup post from last Tuesday & updated 60-minute charts below.
-
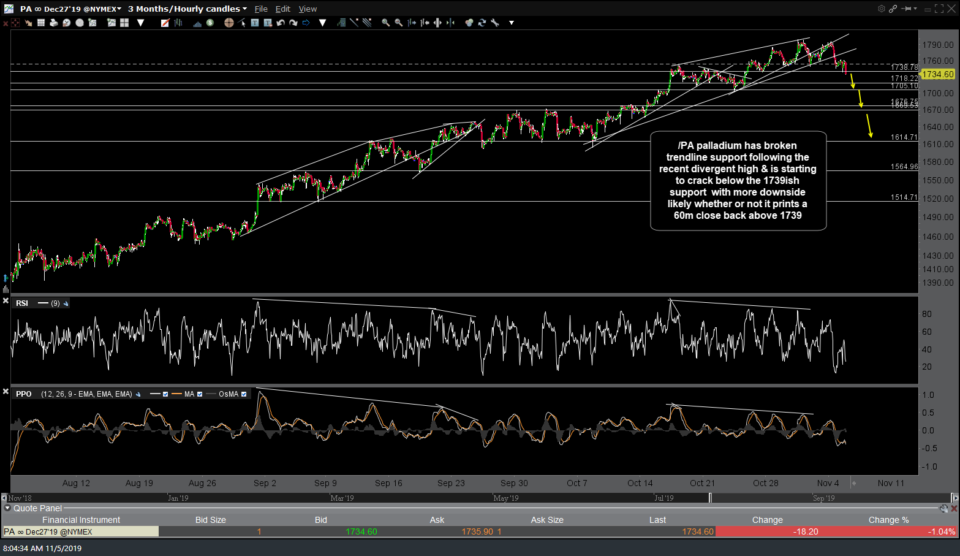
- PA 60m Nov 5th
-

- PA 60m Nov 11th
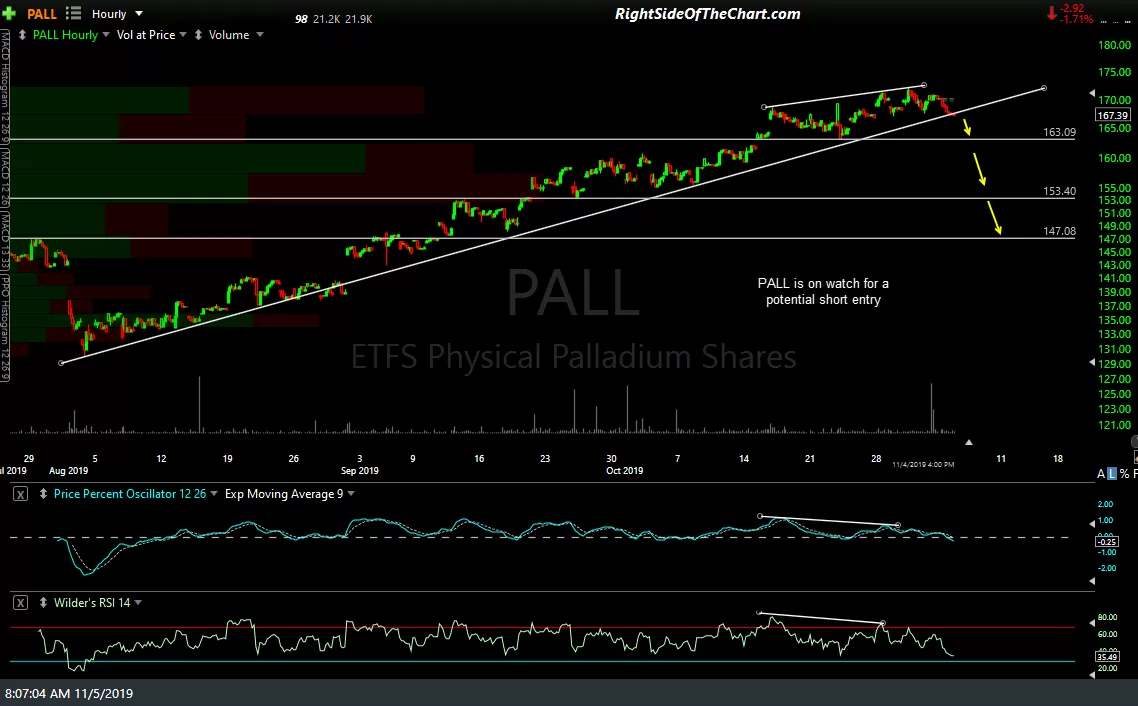
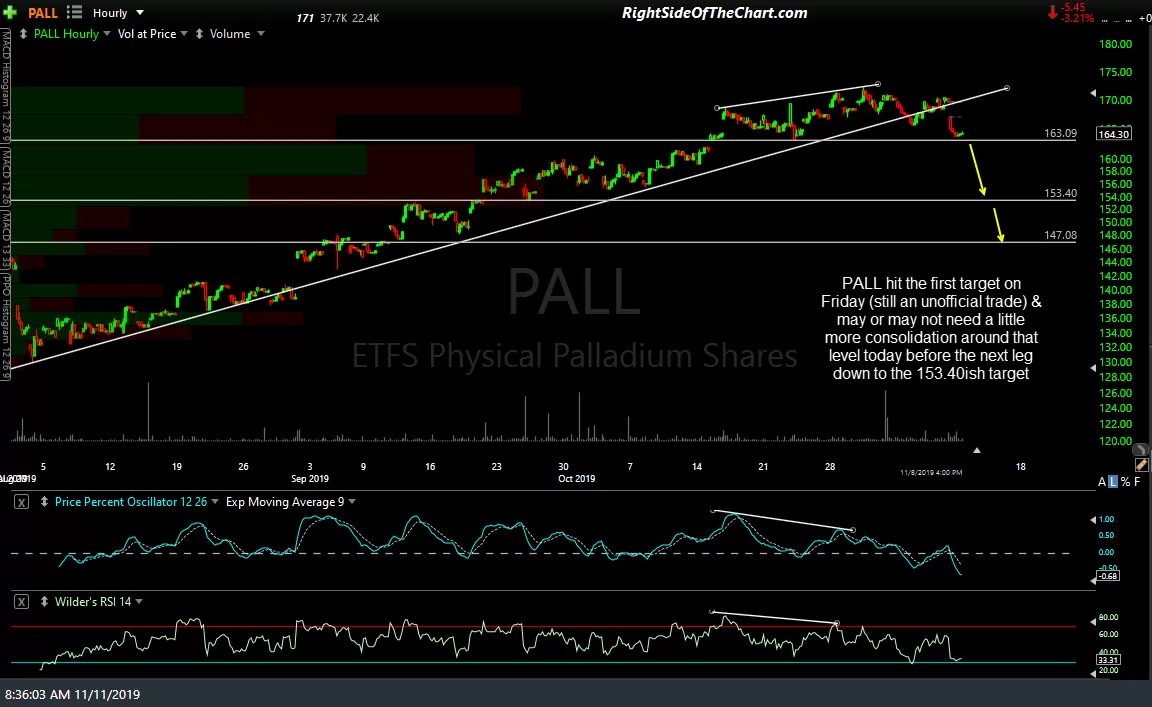
PALL (palladium ETF), which is still an unofficial trade for now, hit the first target on Friday & may or may not need a little more consolidation around that level today before the next leg down to the 153.40ish target. Previous & updated 60-minute charts below.
-
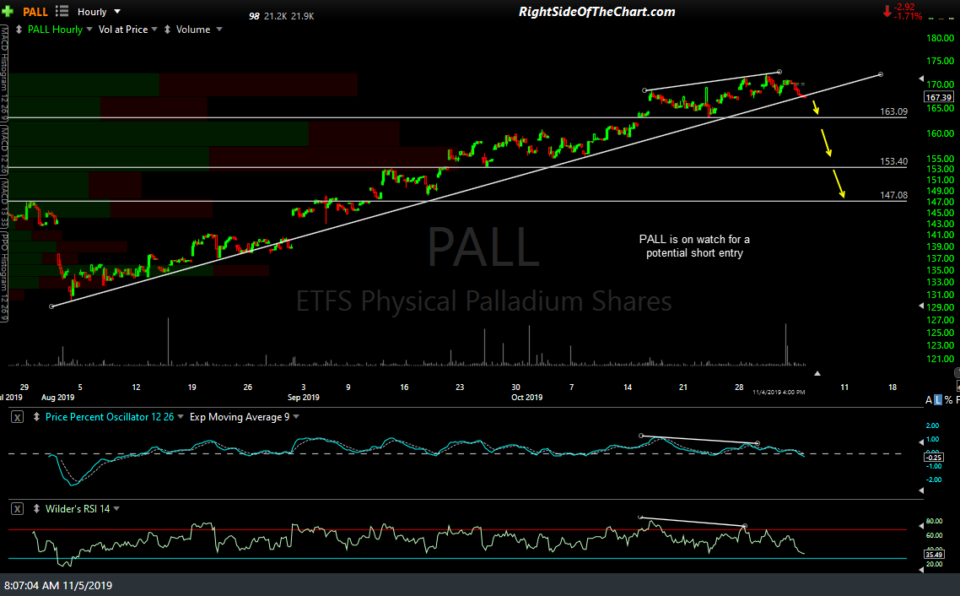
- PALL 60m Nov 4th close
-
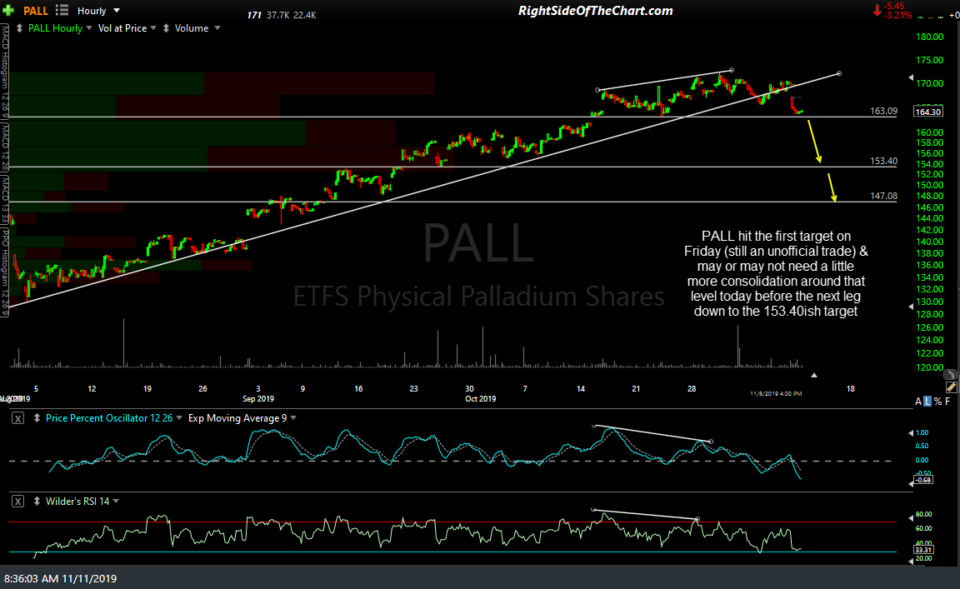
- PALL 60m Nov 8th close
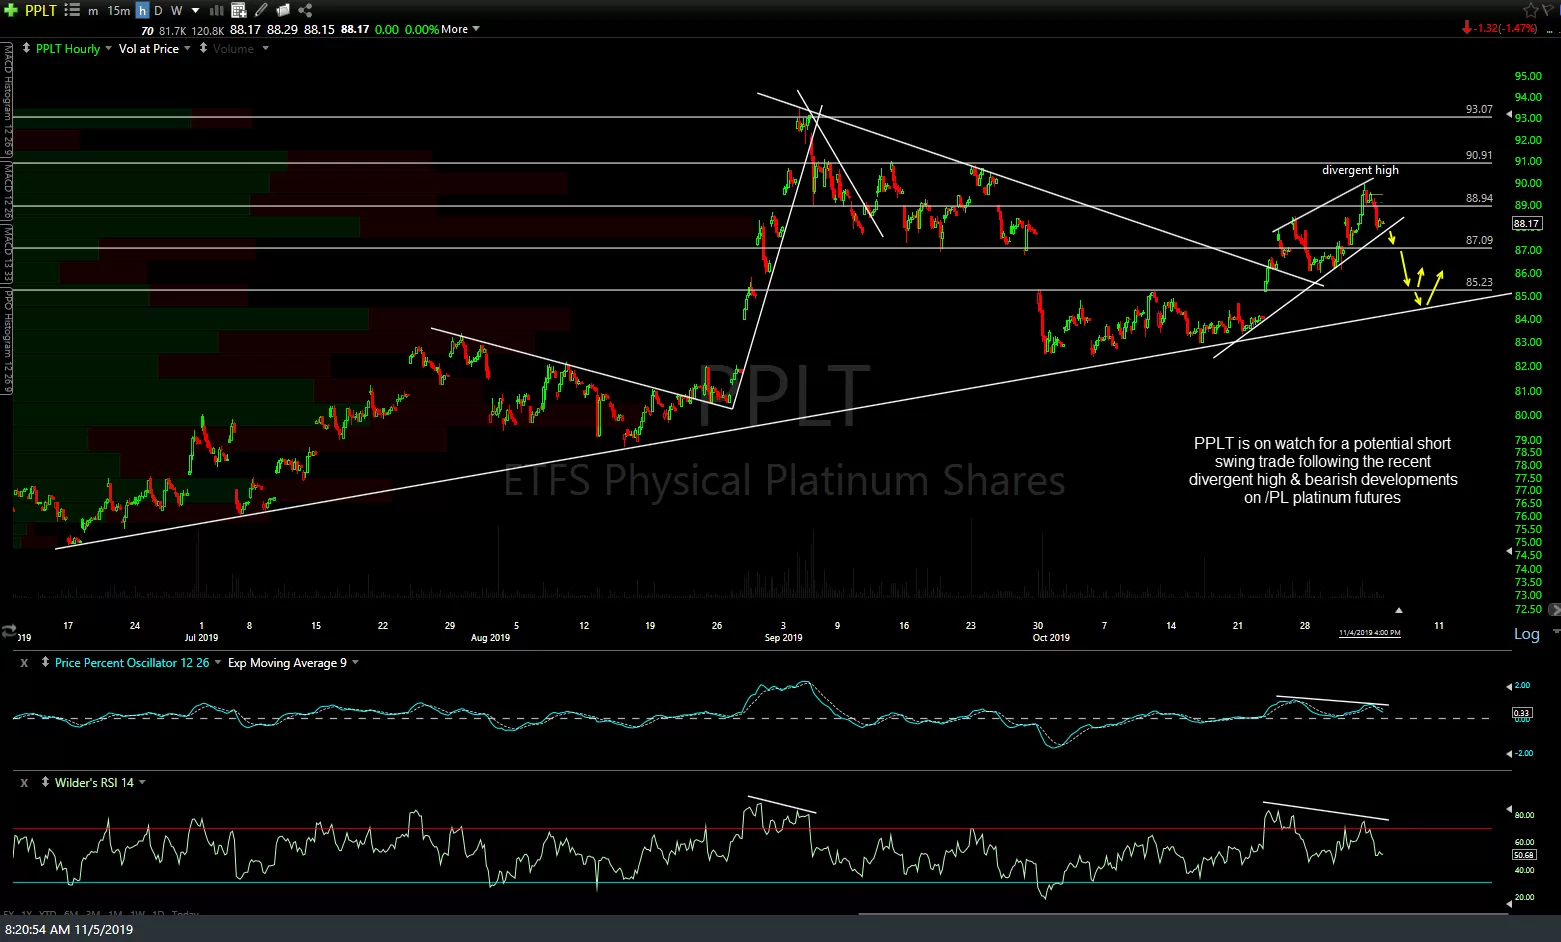
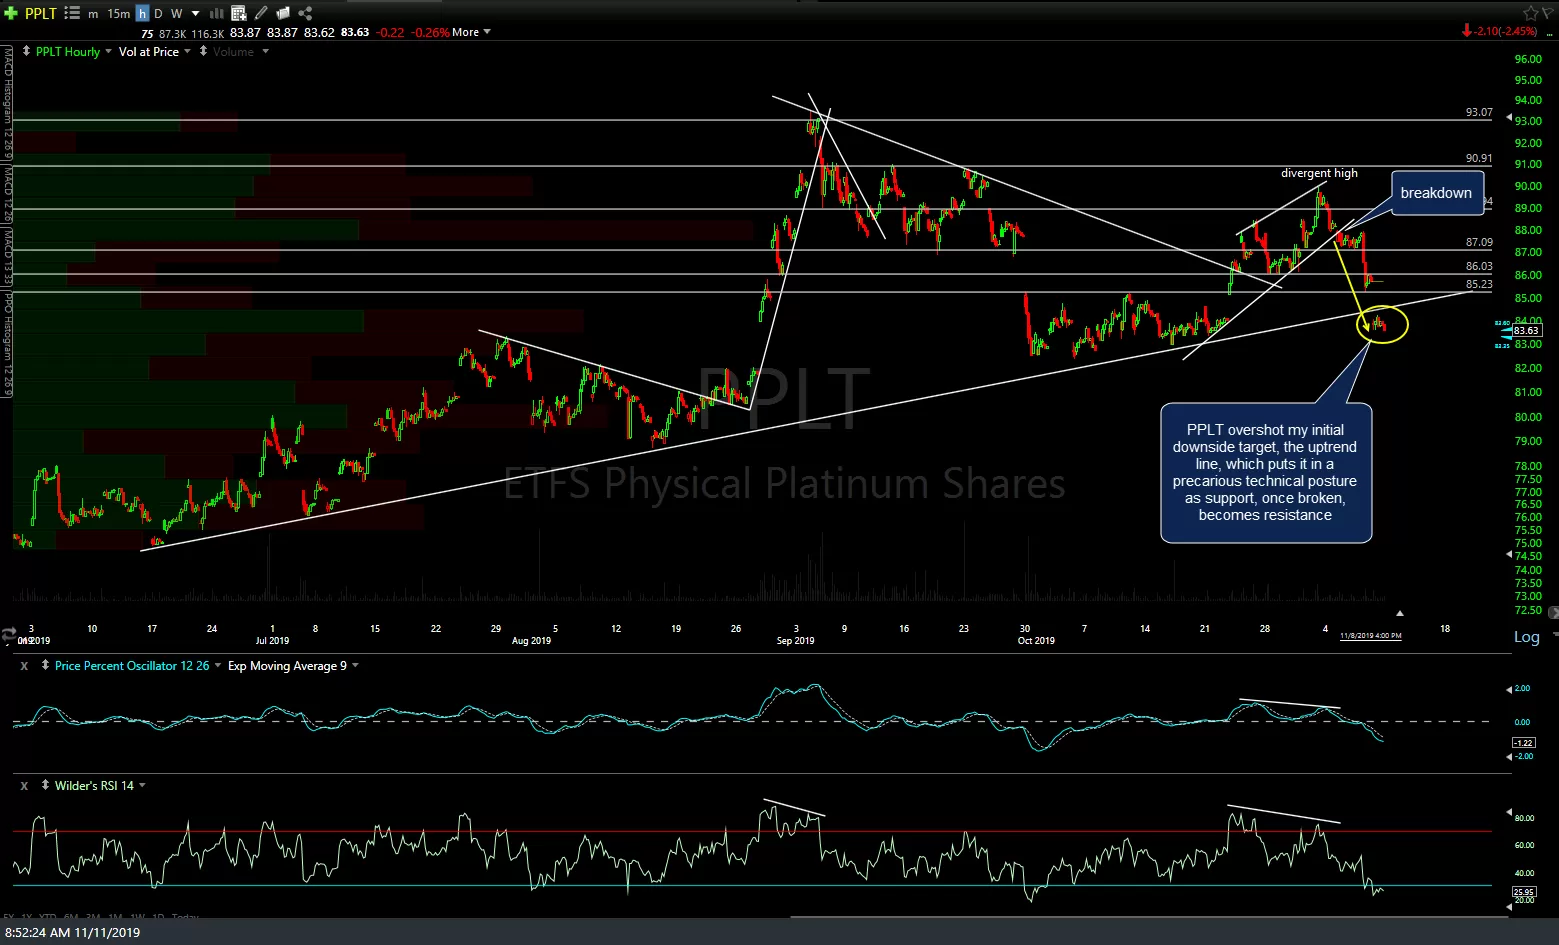
PPLT (platinum ETF), which was also posted as a short setup along with the closely related platinum last Tuesday, overshot my initial downside target, the uptrend line, which puts it in a precarious technical posture as support, once broken, becomes resistance. Previous & updated 60-minute charts.
-
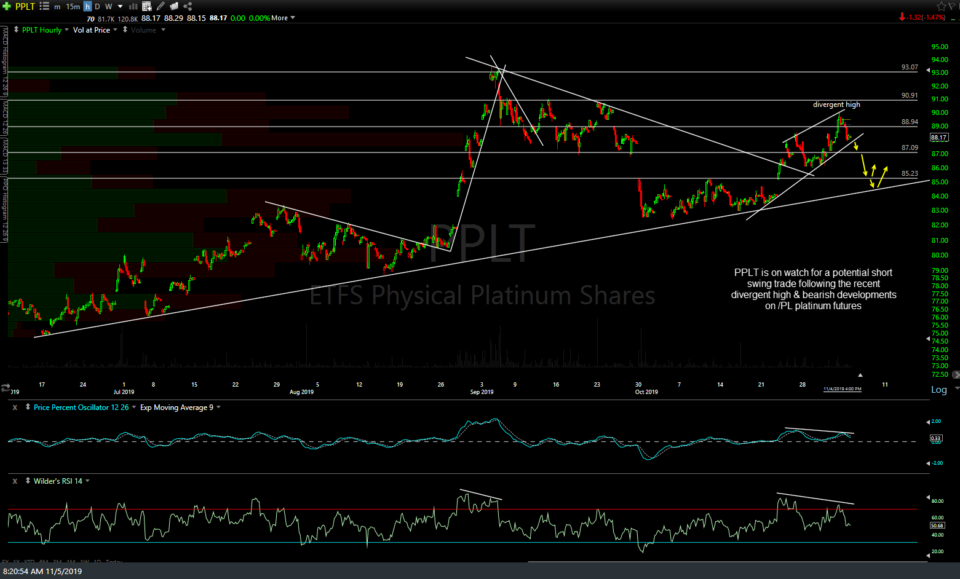
- PPLT 60m Nov 4th close
-
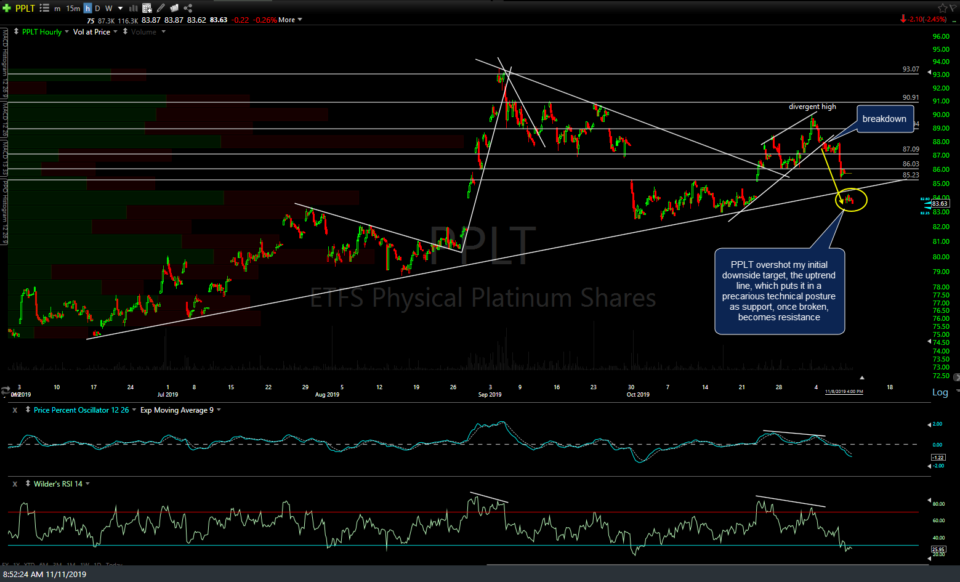
- PPLT 60m Nov 8th close
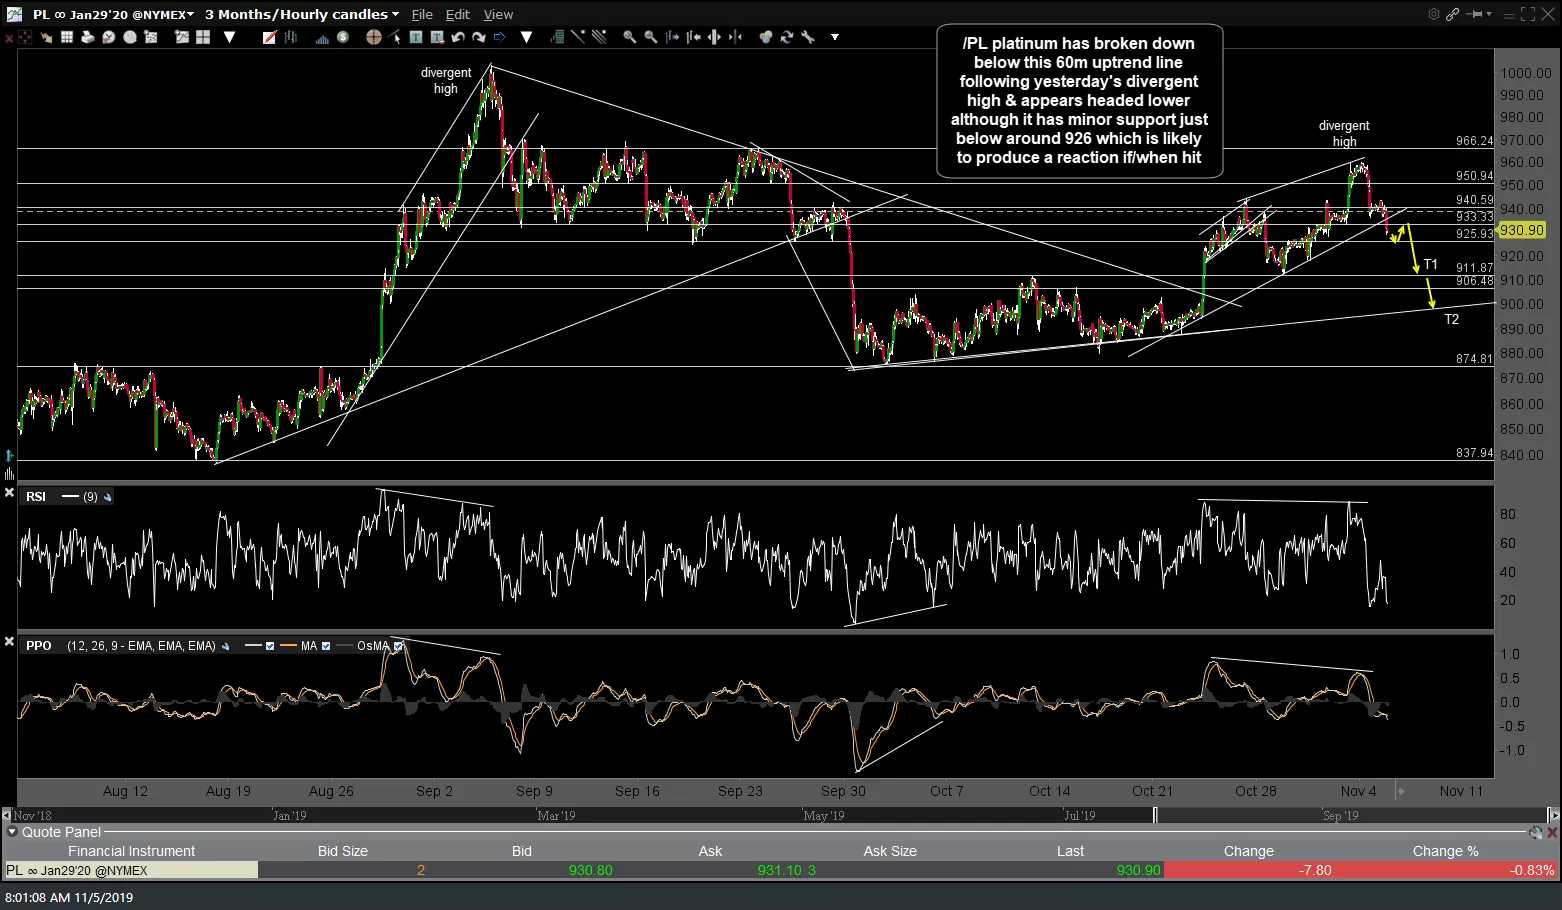
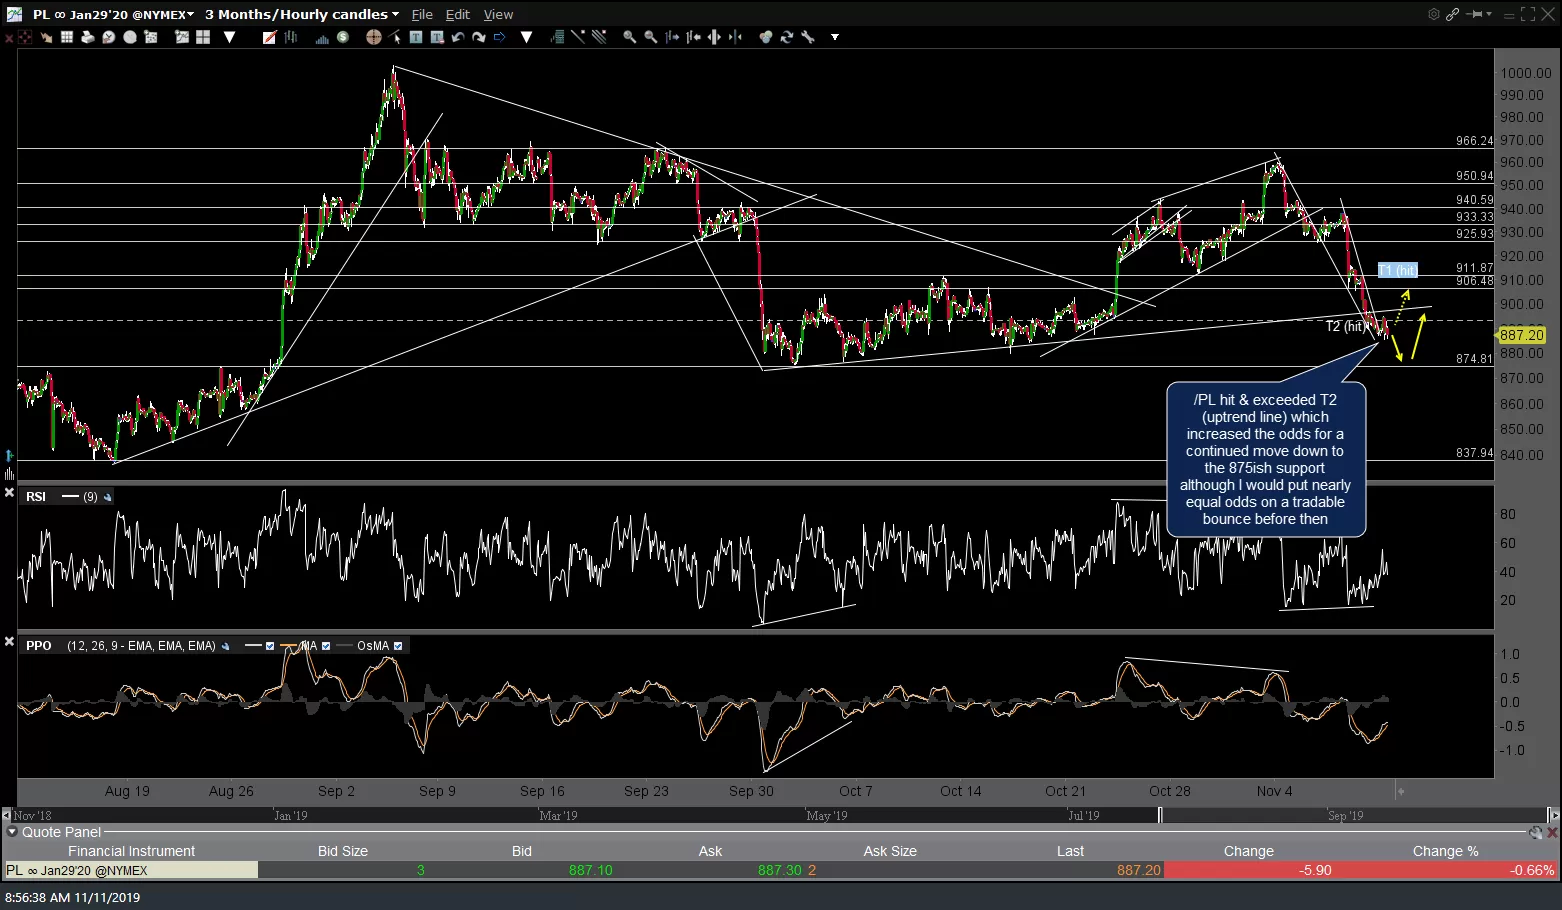
Likewise, /PL (platinum futures) hit & exceeded T2 (uptrend line) which increases the odds for a continued move down to the 875ish support although I would put nearly equal odds on a tradable bounce before then. Previous & updated 60-minute charts.
-
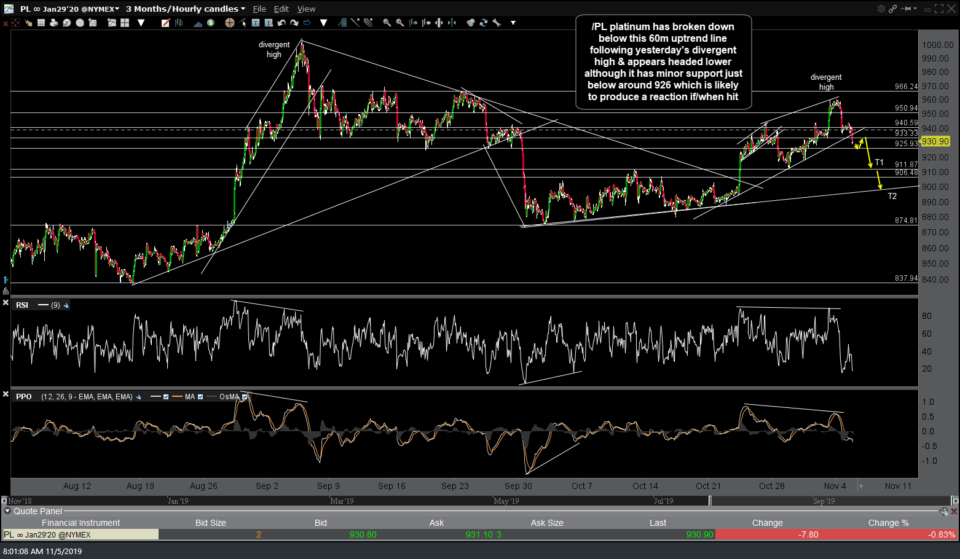
- PL 60m Nov 5th
-
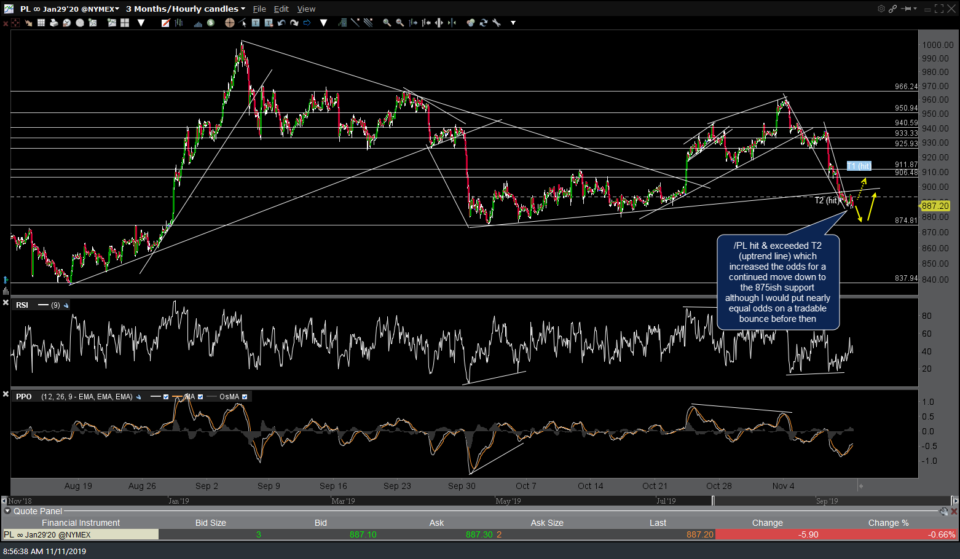
- PL 60m Nov 11th
Regarding the two main risk-off assets, /ZB (30-yr Treasury bond futures) remains below trend line support (bearish) although still holding above the 156’143ish July 4th reaction high support level with the RSI divergences still intact. I’m leaning towards a bounce back to the 158ish R level and/or backtest of the trendline from this point. Daily chart below.
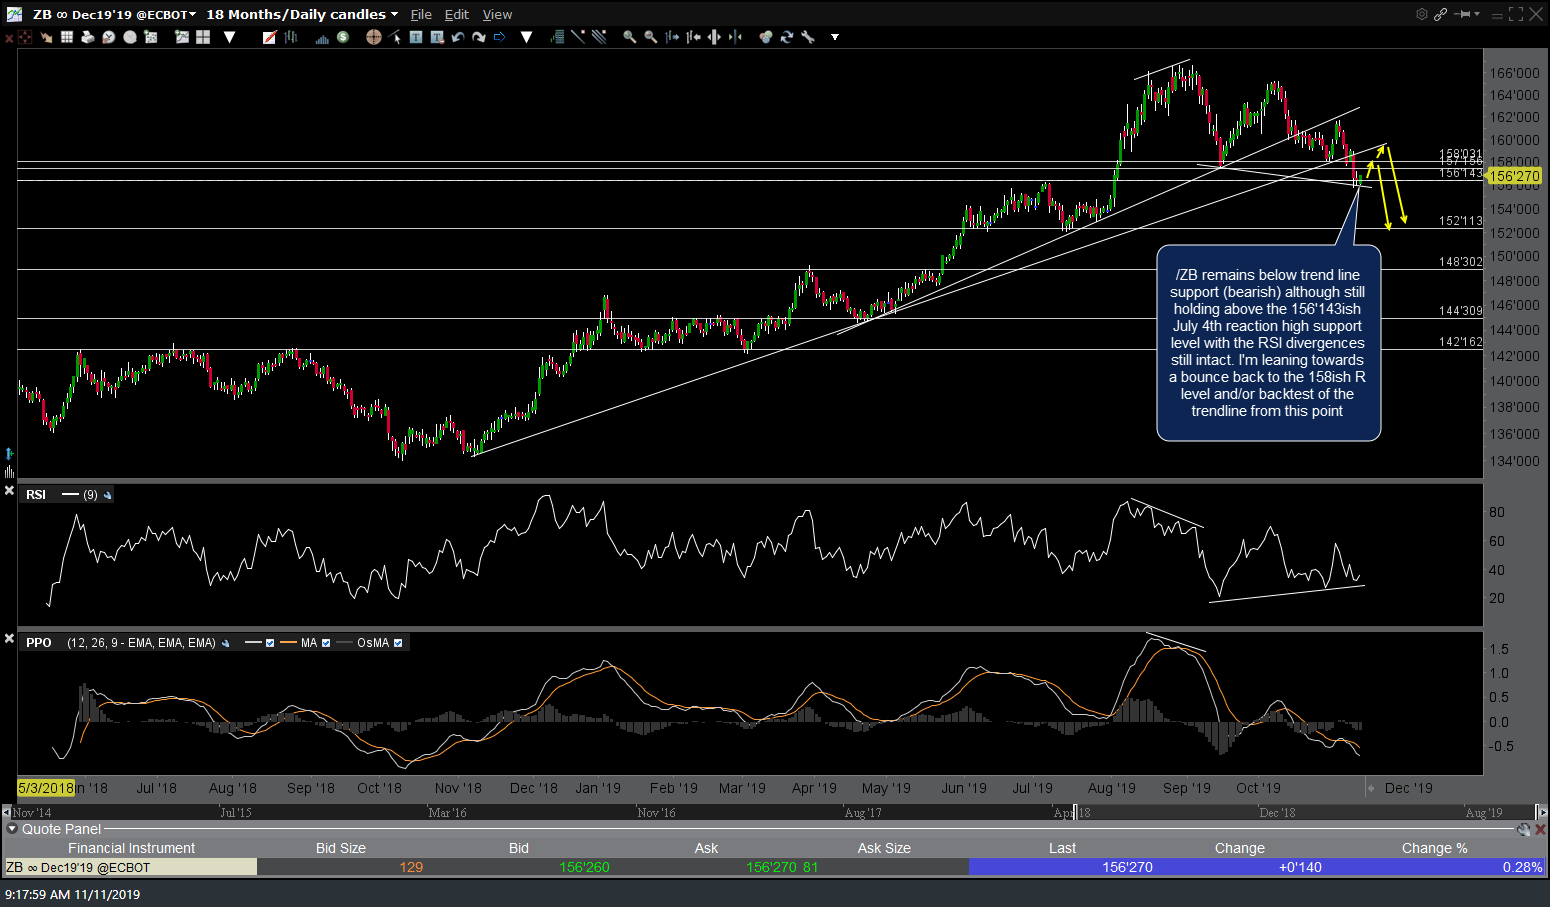
ZB daily Nov 11th
/GC (gold futures) continues to cling to the 1465ish support with the RSI divergences still intact although barely. While I favor a reversal here, much more downside in gold would open the door to a drop back to the 1374ish and/or uptrend line support. Daily chart below.
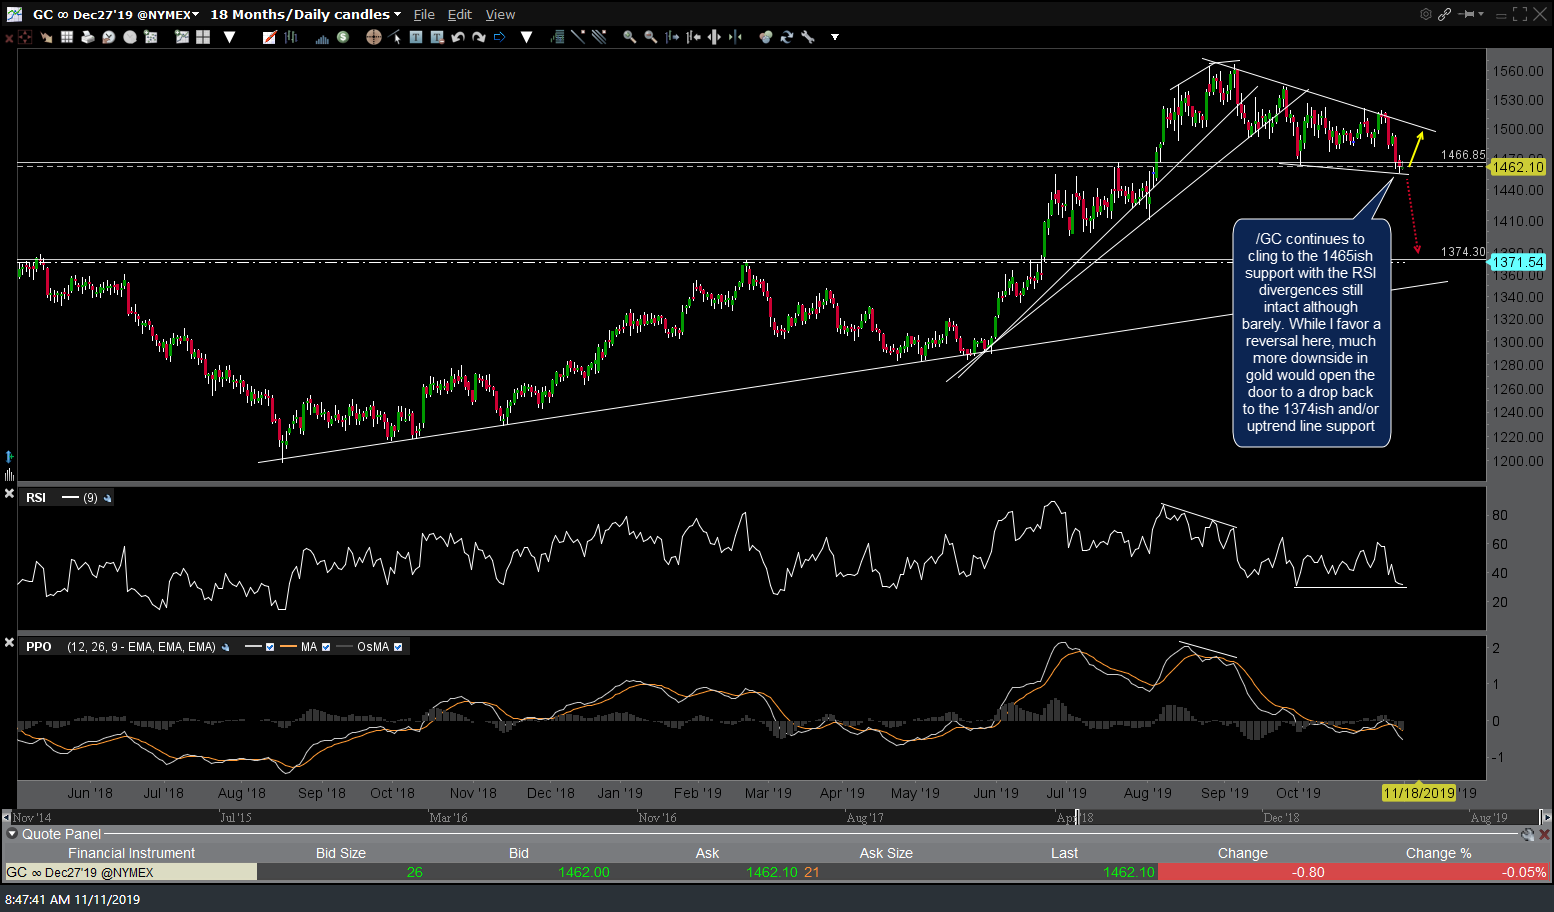
GC daily Nov 11th