
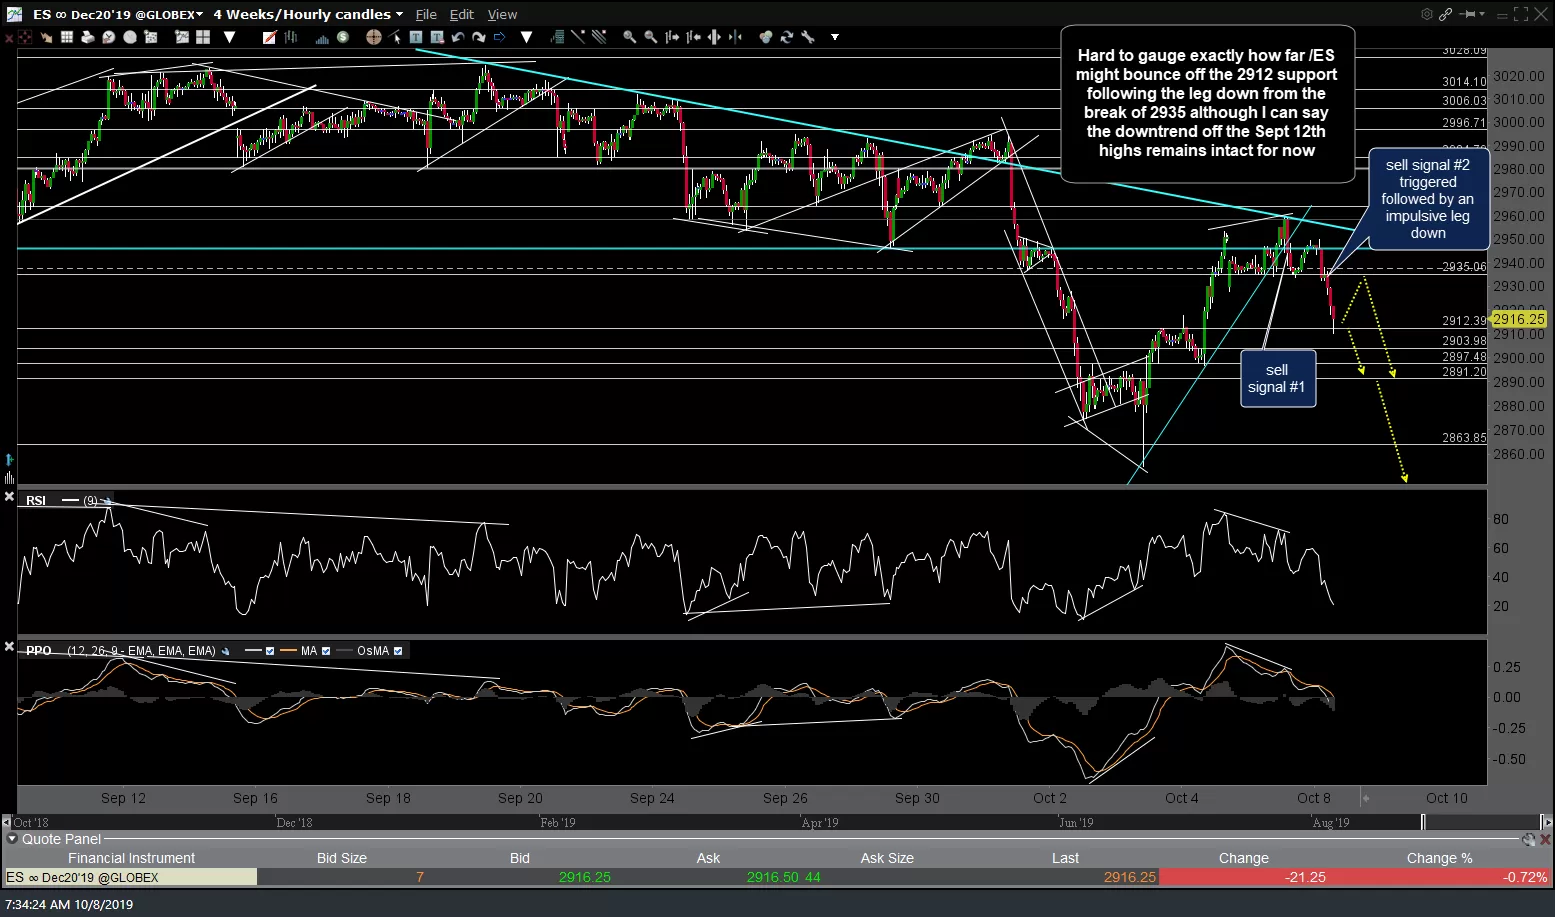
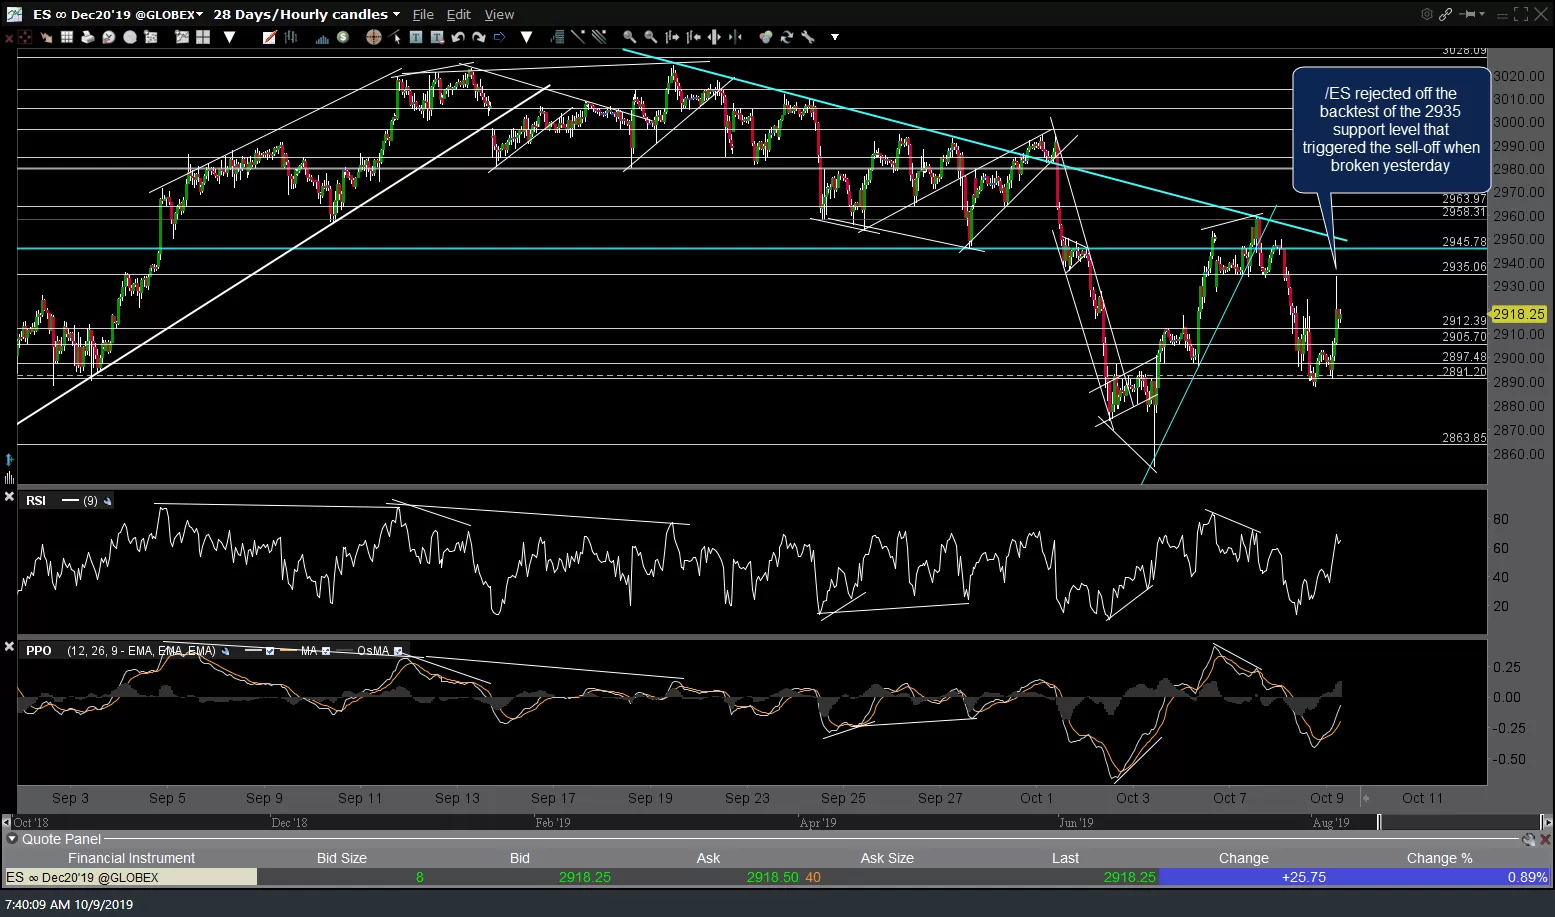
The charts that I’m watching today are pretty much the same as yesterday’s charts with the same levels and developments continuing to play out. /ES (S&P 500 futures) was just rejected off the backtest of the 2935 support level that triggered the sell-off when broken yesterday, once again offering another objective short entry at that level. Yesterday’s & today’s update 60-minute charts below.
-
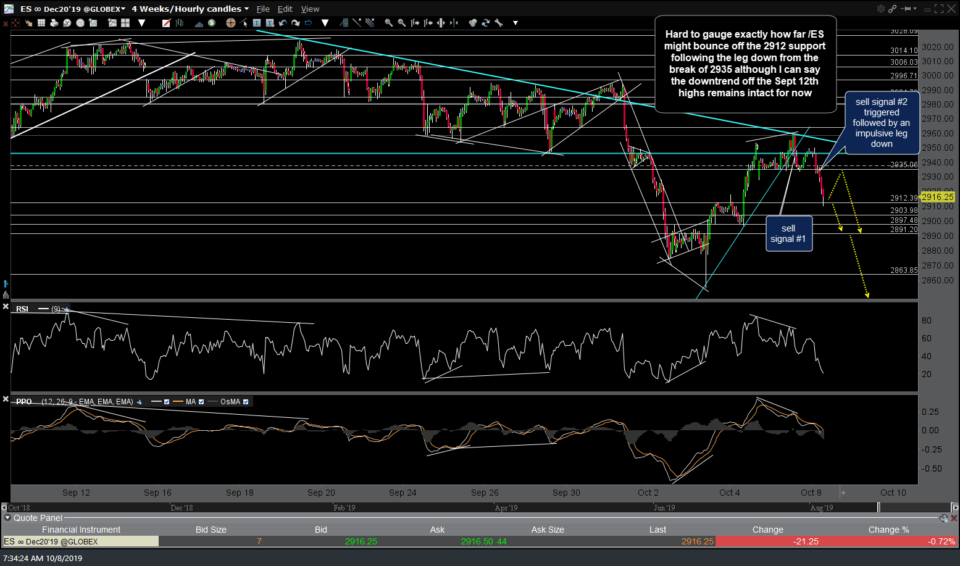
- ES 60m Oct 8th
-
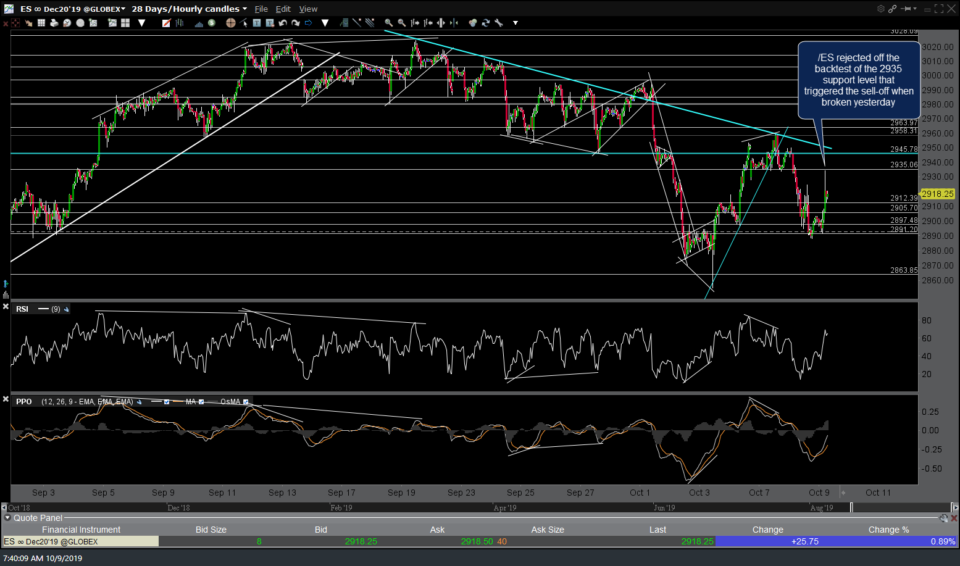
- ES 60m Oct 9th
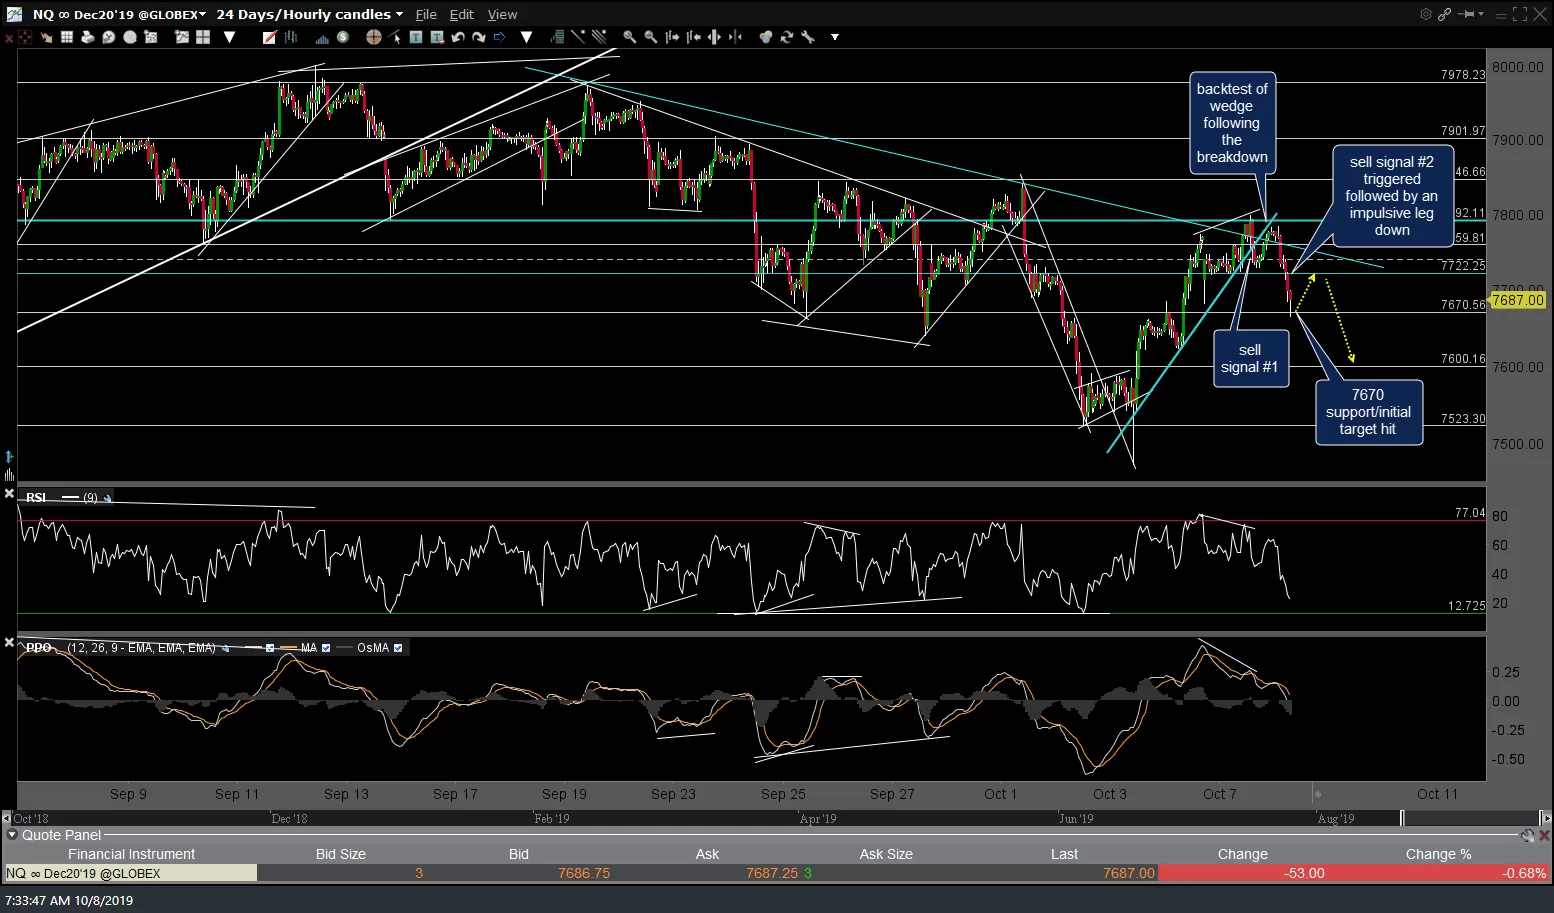
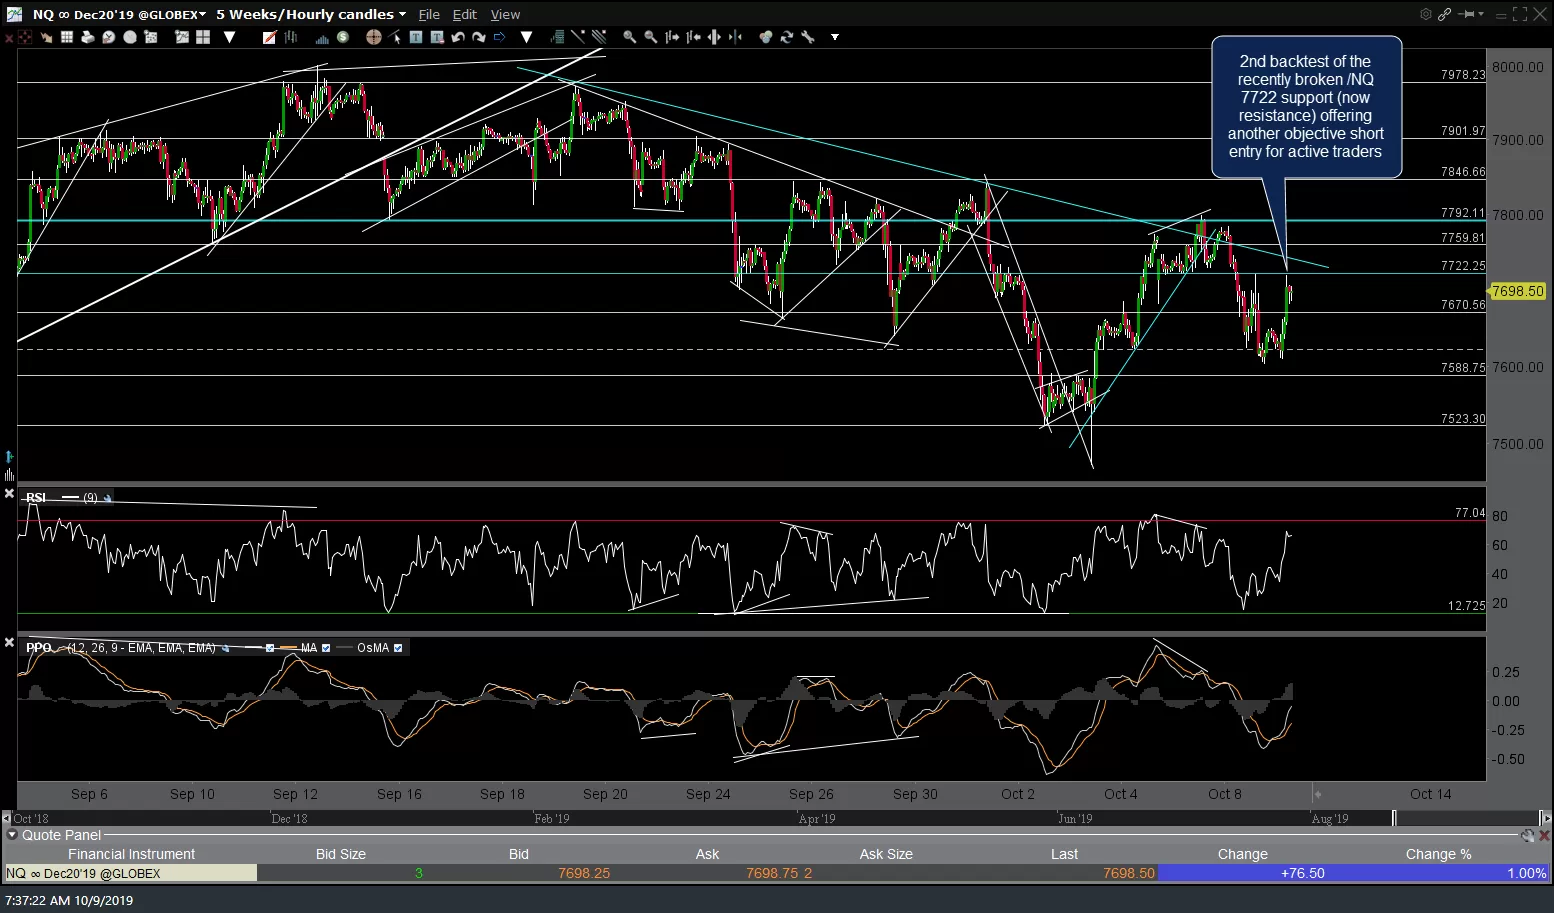
Likewise, /NQ (Nasdaq 100) just made a backtest of the 7722 support (now resistance) that was broken yesterday, once again offering another objective short entry for active traders on the bounce back into resistance. Should both /NQ & /ES take out those resistance levels with conviction, that would likely trigger more upside although both have significant resistance overhead, including their respective downtrend lines which are likely to limit any upside in the very near-term. Previous & updated 60-minute charts below.
-
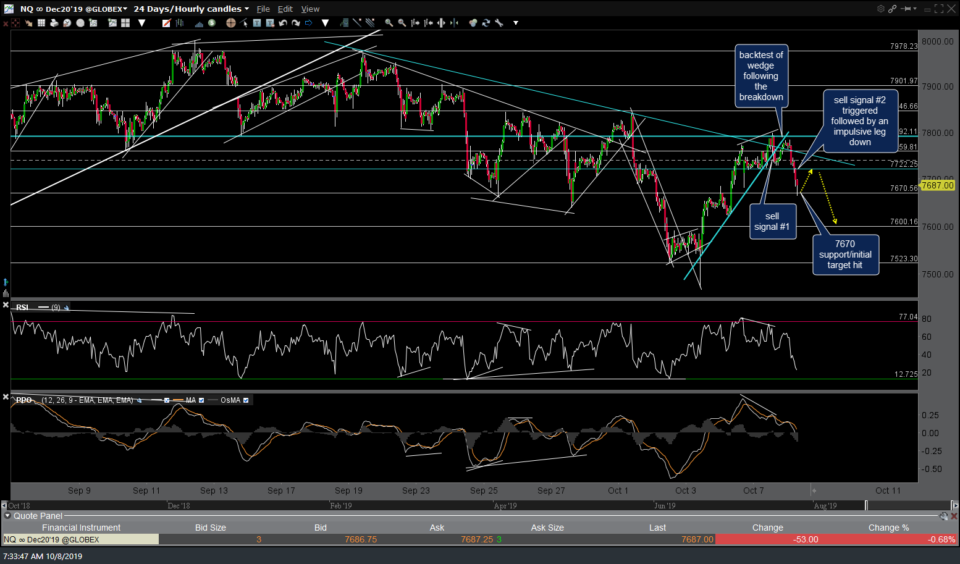
- NQ 60m Oct 8th
-
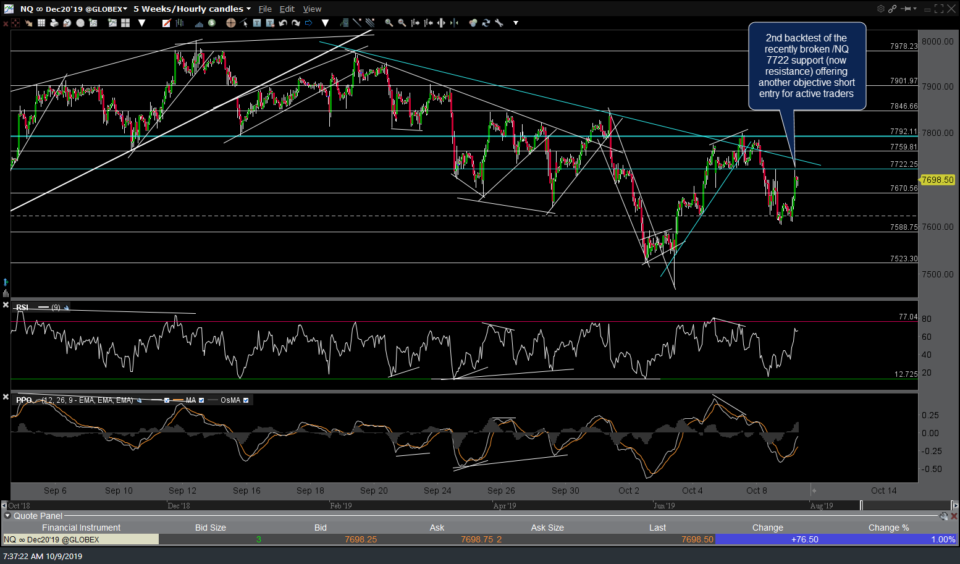
- NQ 60m Oct 9th
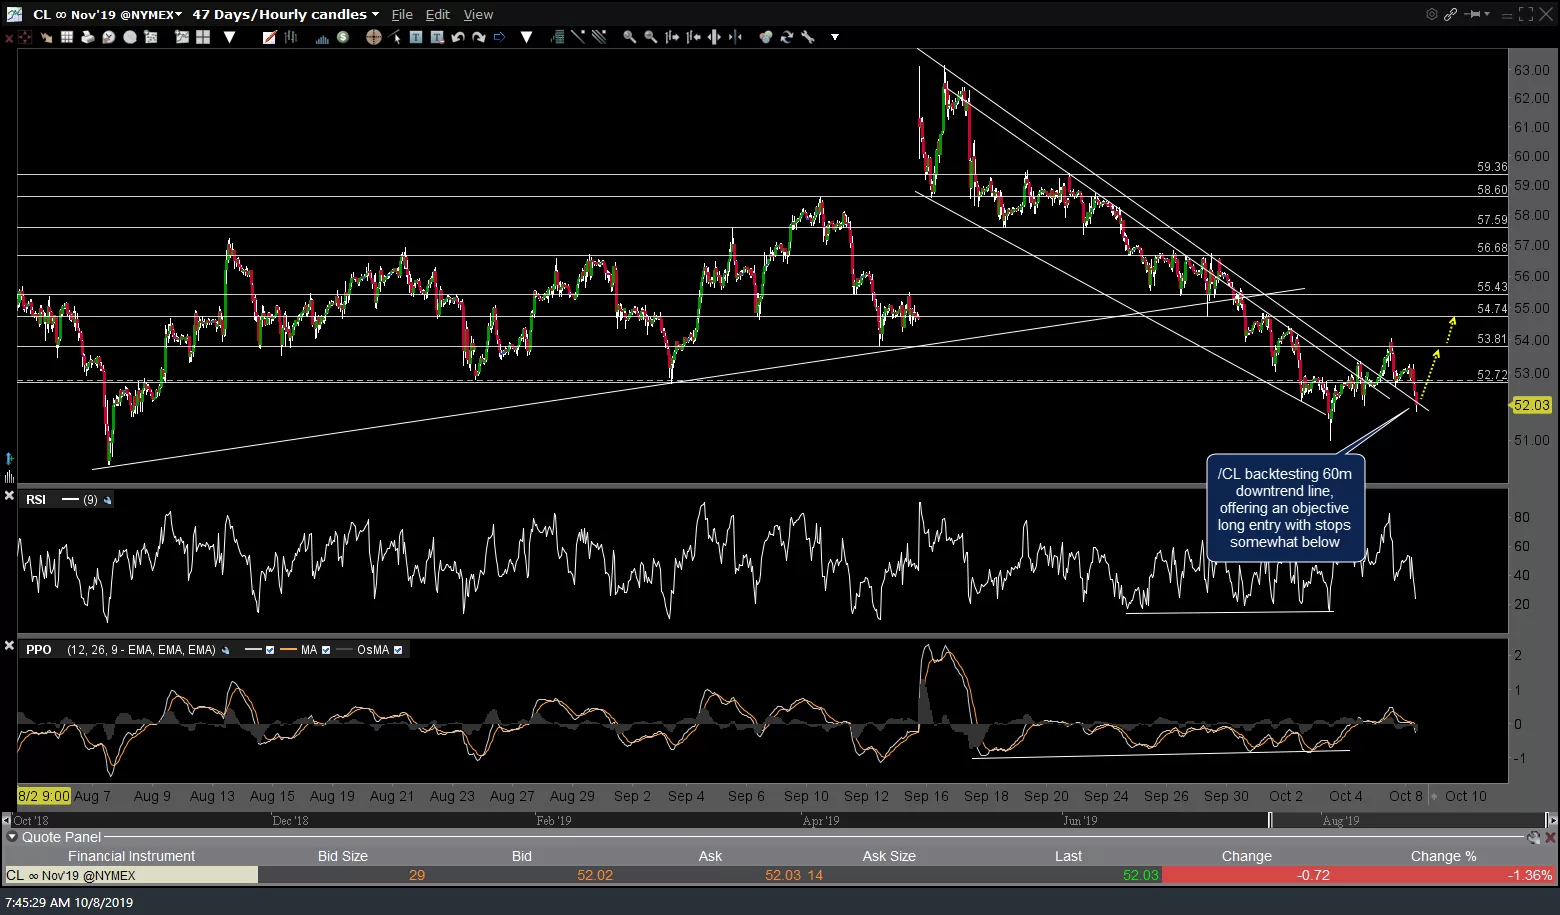
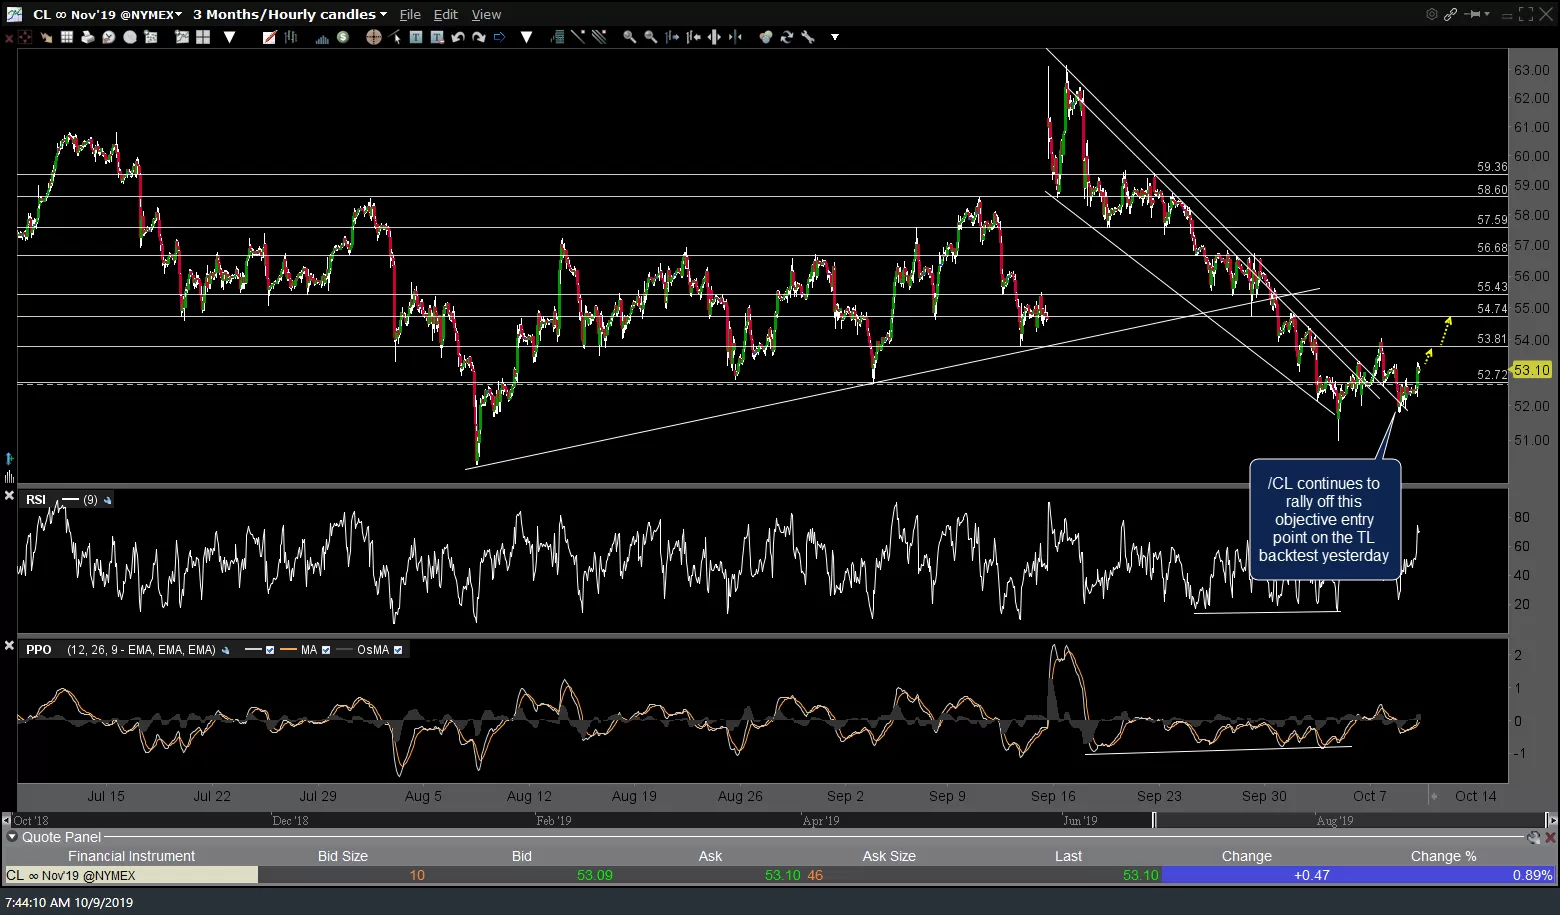
/CL (crude oil) continues to rally off the objective entry point on the trendline backtest yesterday, having gained about 3% since then. Whether on not crude continues to rally & just how far is likely to depend on whether or not the stock indexes move higher or lower from here so not a bad idea to raise stops on to entry or above /CL, USO or DWT at this time. Previous & updated 60-minute charts below.
-
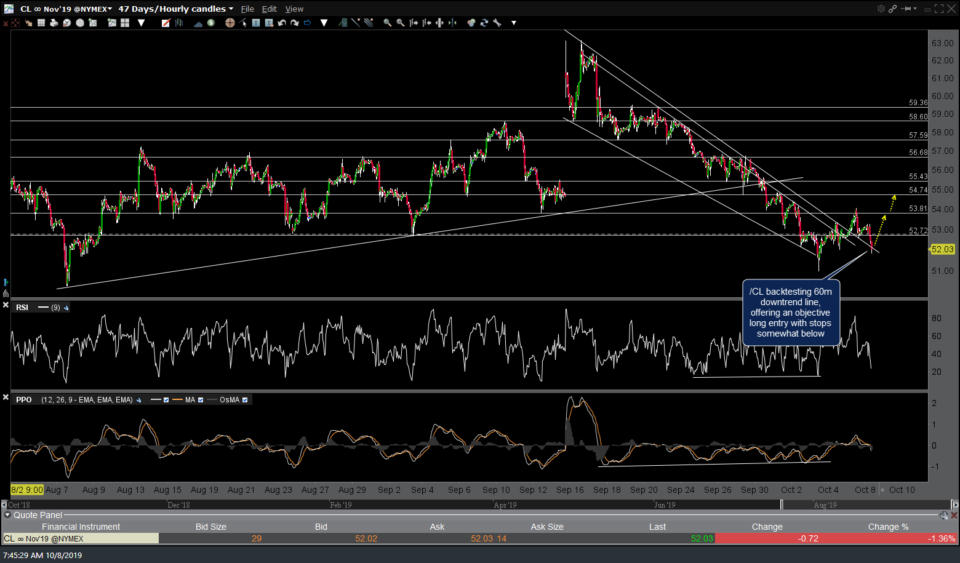
- CL 60m Oct 8th
-
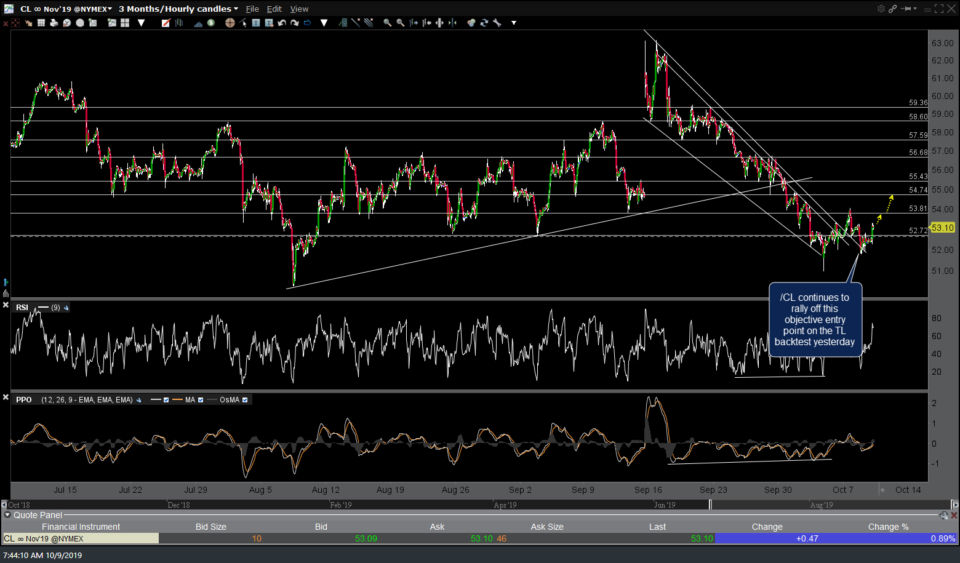
- CL 60m Oct 9th
/KC coffee futures would offer an objective long entry on a breakout above this 60m bullish falling wedge pattern and/or a little more downside to the 0.9491ish support level. 60-minute chart below.
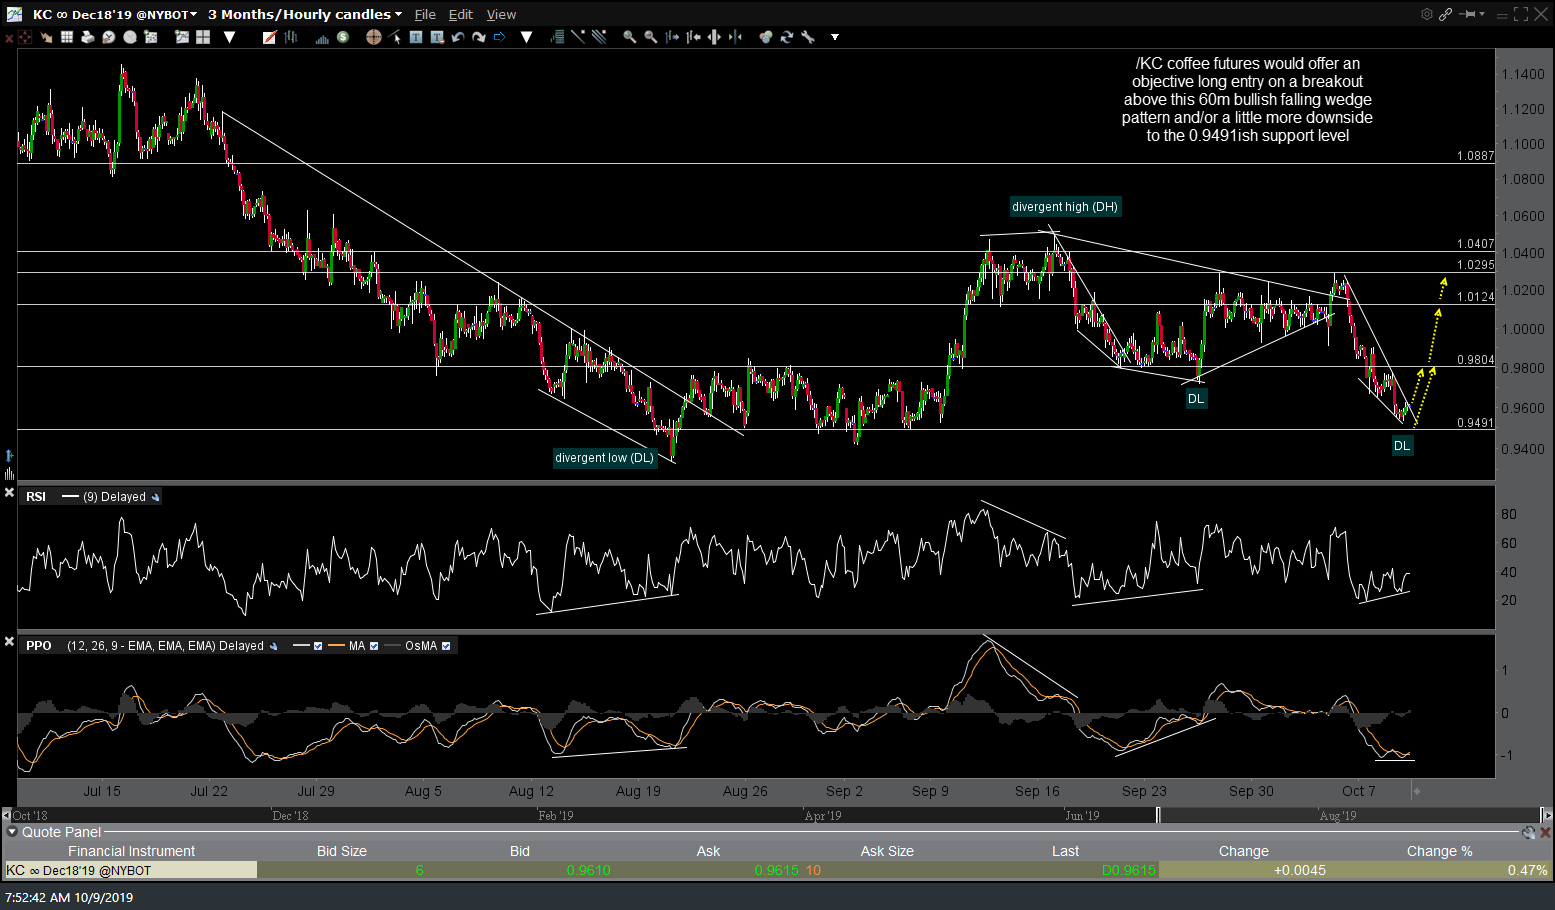
KC 60m Oct 9th
For those that prefer trading ETFs/ETNs, JO (coffee ETN) would offer an objective long entry on a break above this 60-min downtrend line and/or a little more downside to the 31.47ish support level although it is best to align any entries & exits on JO with the charts of /KC, which JO holds. Also, be aware that trading in JO will flatten about 2½ hours before the stock market closes due as that is when coffee futures stop trading for the day (/KC trading hours 4:15 am – 1:30 pm). It is also preferable to use limit orders vs. market orders when buying or selling a thinly traded security such as JO. 60-minute chart with some potential price targets below.
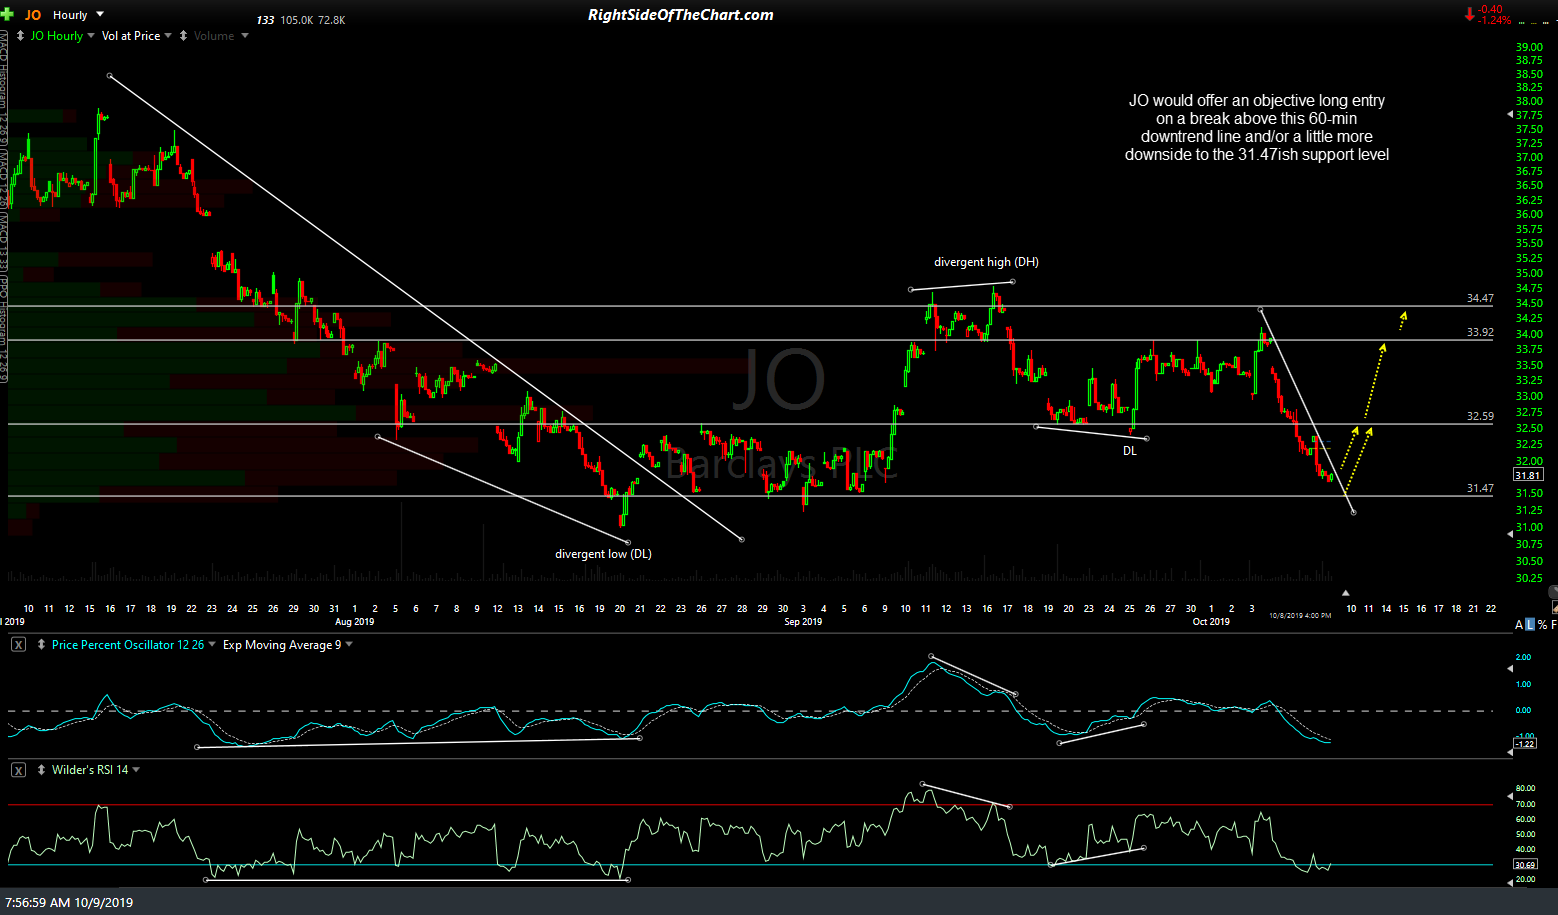
JO 60m Oct 9th