
Here are a few of the charts that I’m watching closely today starting with Treasury bonds. IEF (7-10 yr Treasury bond ETF) was indeed rejected off the 95.40 resistance that was highlighted last week but remains just above the YELLOW ZONE for now with a move back into that zone likely to coincide with breakdowns of the key yellow support levels on the market-leading big tech stocks & top sectors of the $SPX I’ve been highlighting. Daily chart below.
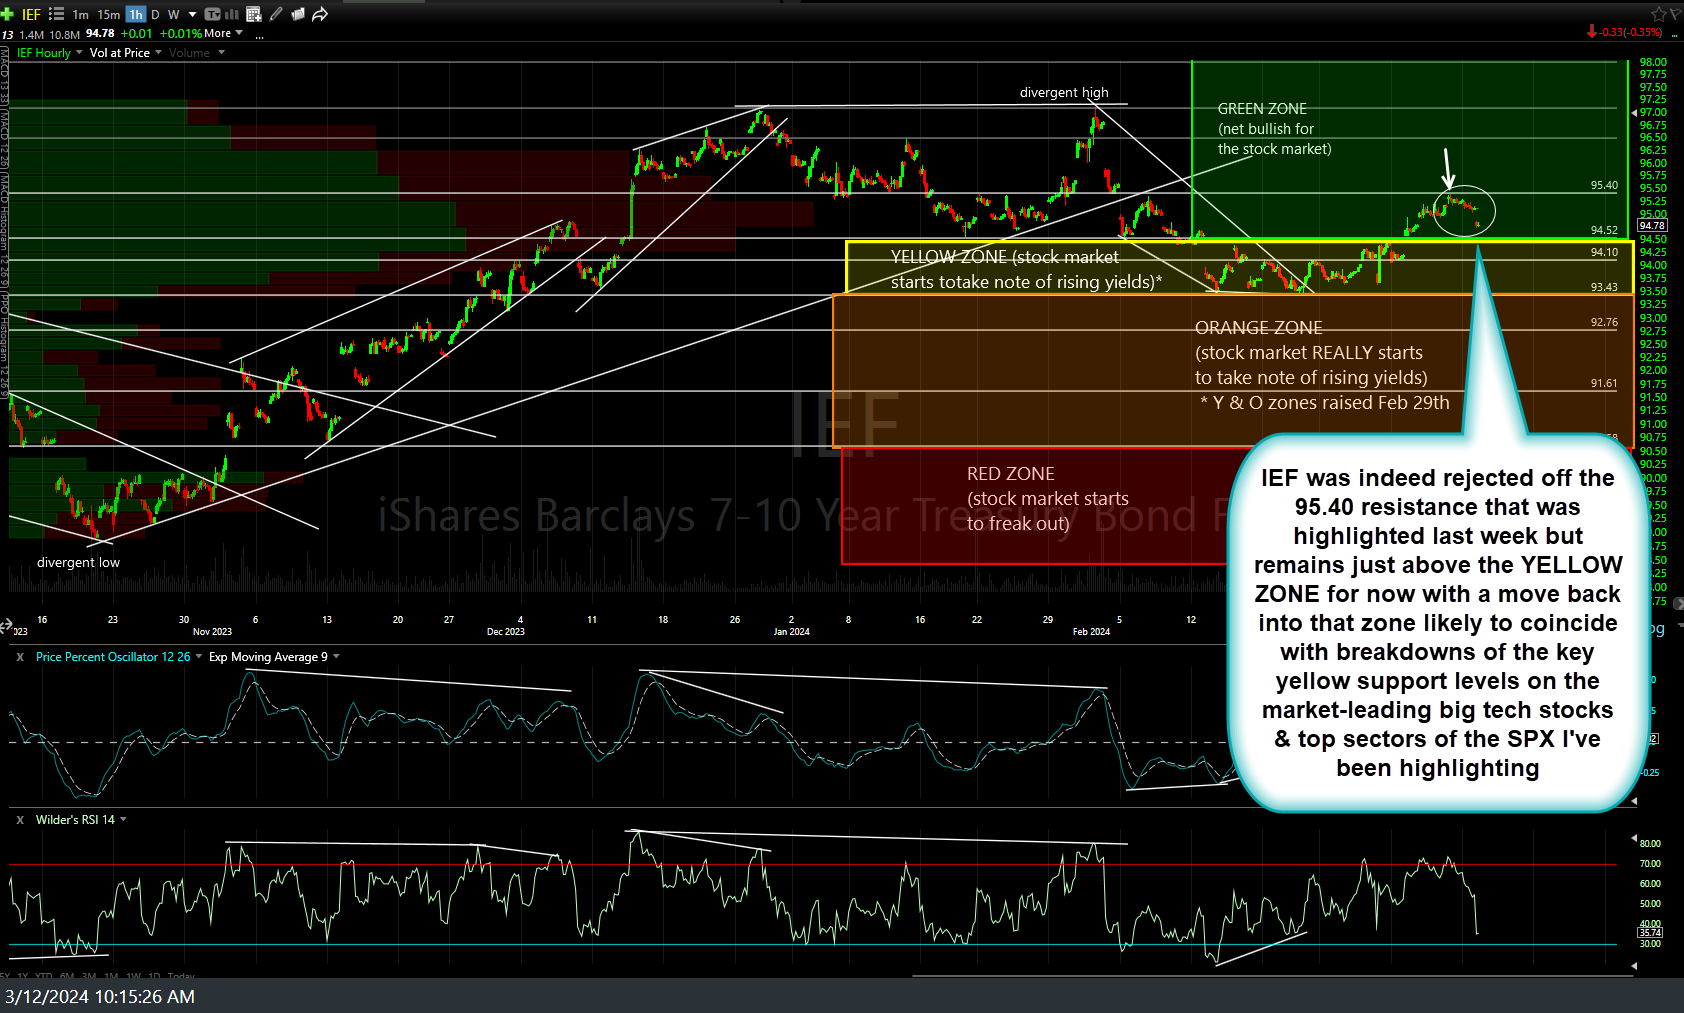
IEF 60m March 12th
I also continue to keep a very close eye on the four largest sectors of the S&P 500 (daily charts on each below). XLK closed slightly below the Oct uptrend line yesterday & is backtesting it from below today. Still looking for a solid close below and/or even just an intraday break below yesterday’s lows at this time to give a sell signal on the largest sector in the S&P 500 & Nasdaq 100.
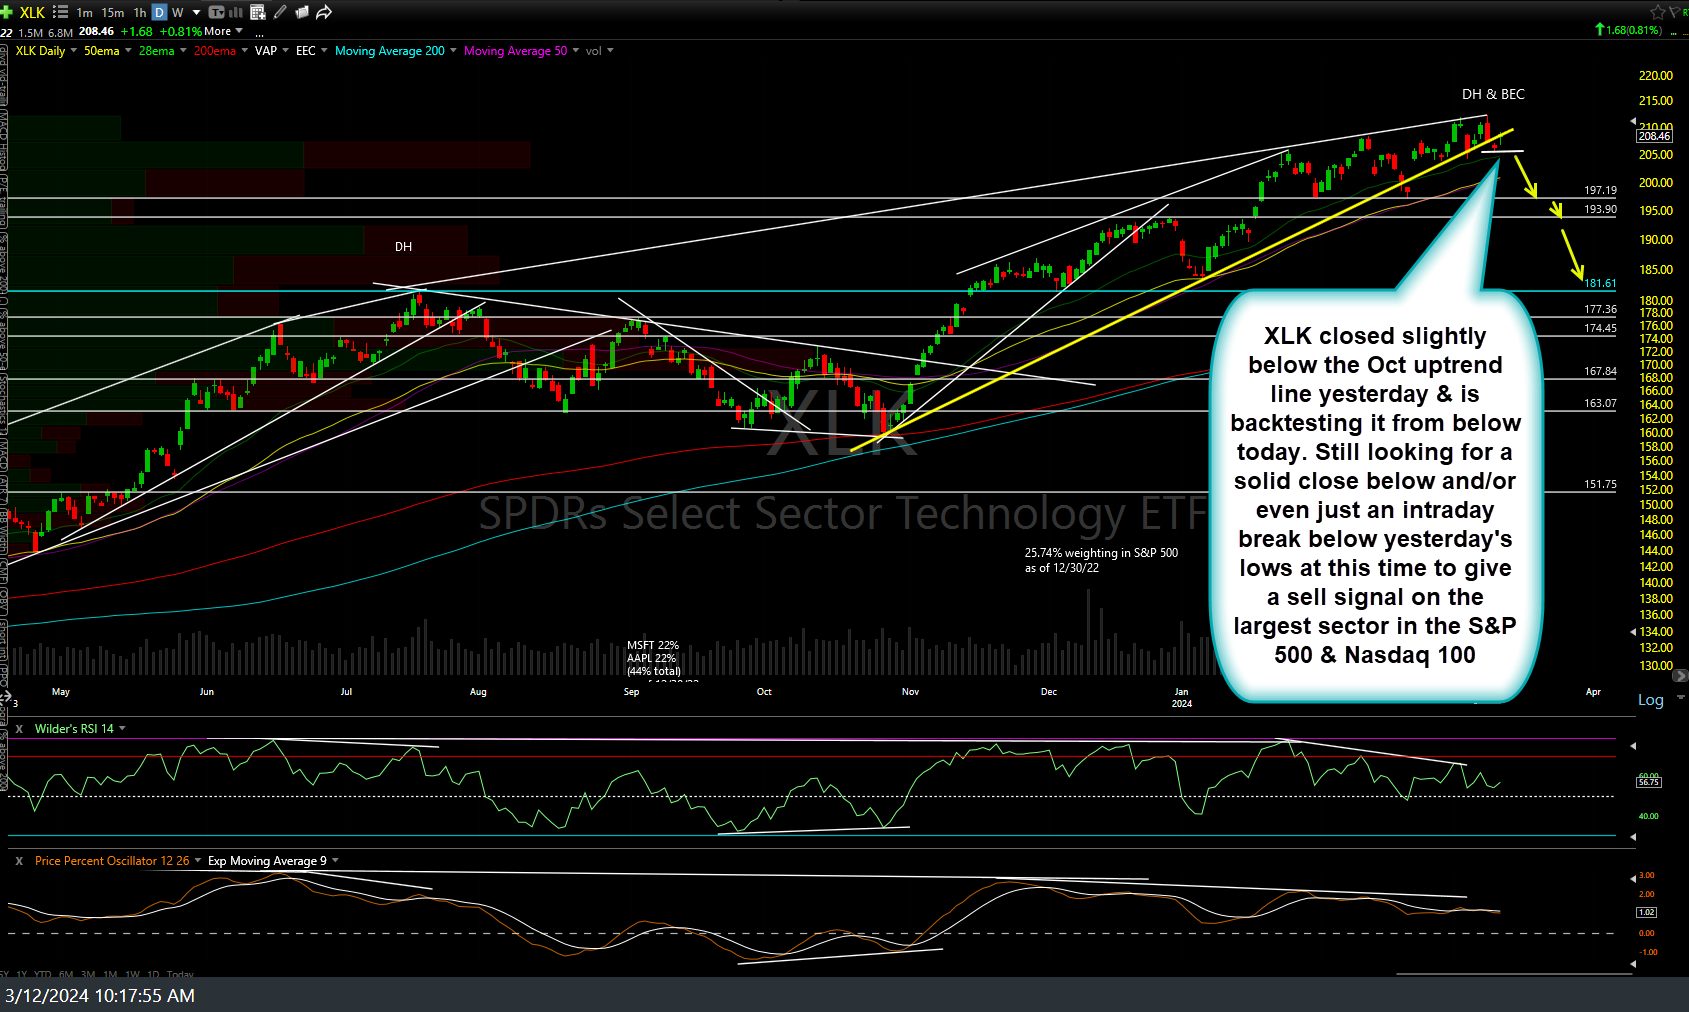
XLK daily March 12th
XLV (Healthcare) continues to ride up the yellow (primary) trendline with a sell signal still pending a solid break and/or close below the BOD line I added a week or so ago.
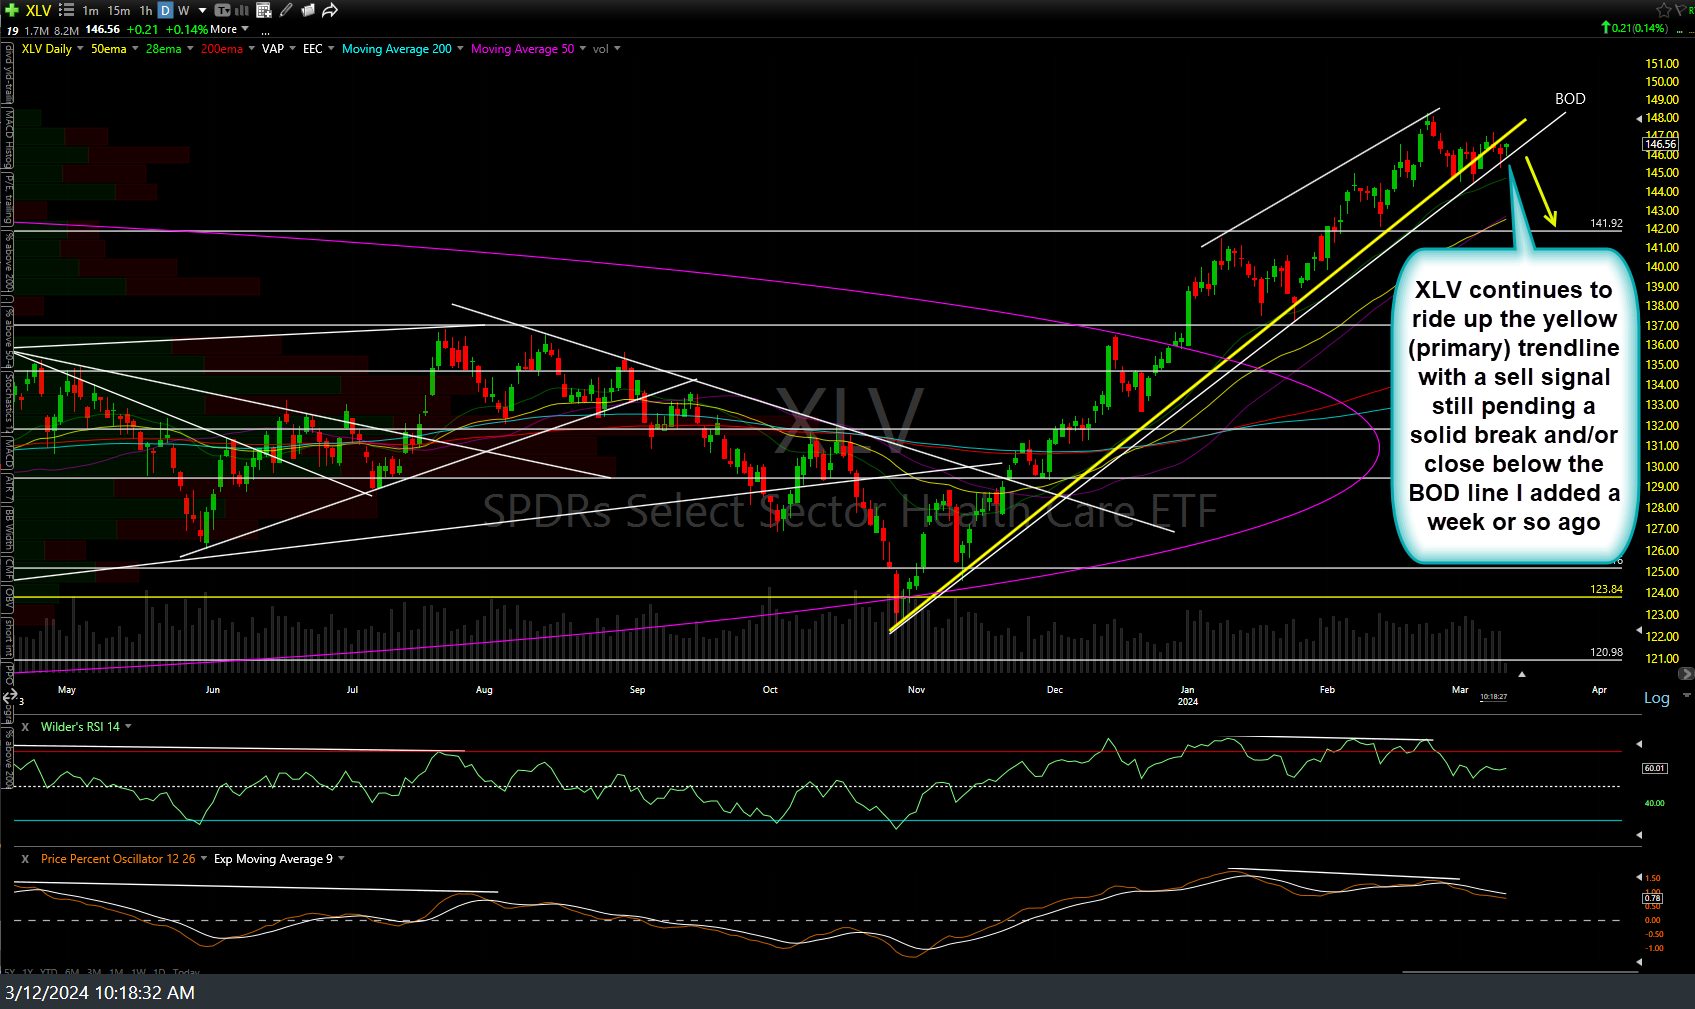
XLV daily March 12th
XLF (Financials) still testing the primary (Oct) uptrend line with a sell signal still pending a solid break and/or close below it.
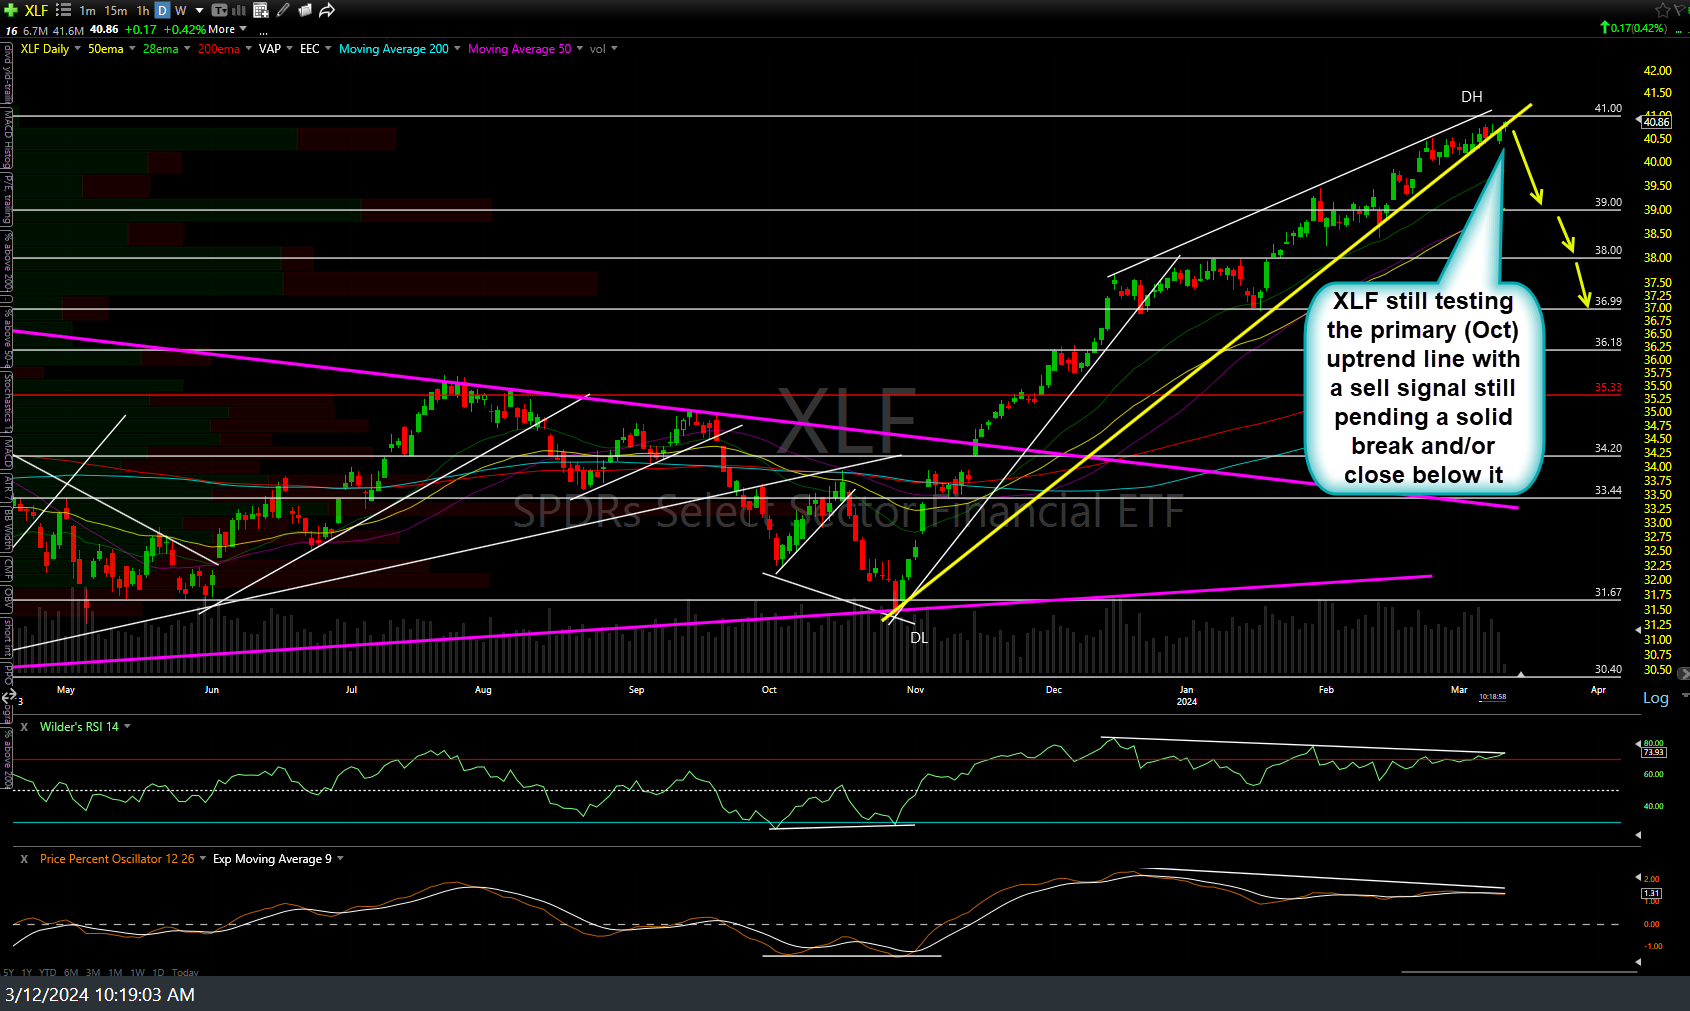
XLF daily March 12th
Although I’d still like to see some impulsive selling and/or a solid close further below the yellow trendline, XLY (Consumer Discretionary) did close notably below it yesterday & remains below so far today (i.e.- sell signal still in play). A close below the recent lows (white line) will help to solidify it.
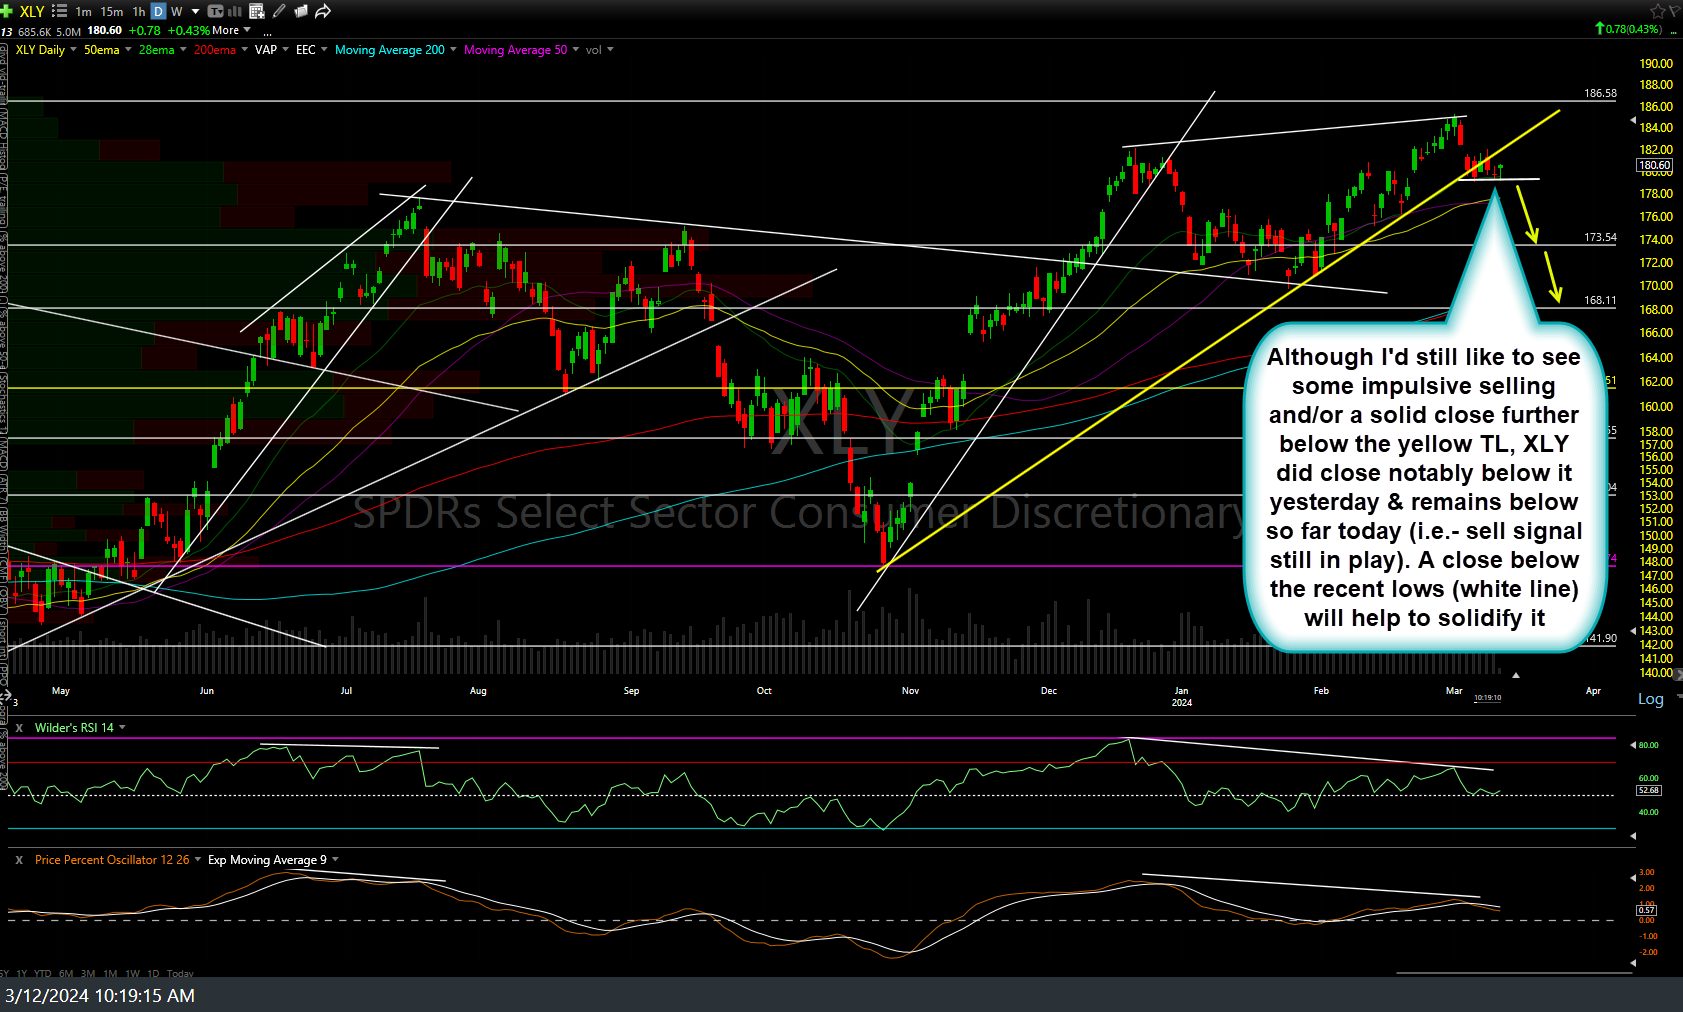
XLY daily March 12th
While I still continue to watch all of the big tech stocks FKA as the Magnificent 7, with several already buckling & the remaining few holdouts still above but close to my initial key yellow support levels, the most important of the lot would have to be NVDA (NVIDIA Corp). The King of the AI-hype remains well below Friday’s bearish engulfing candlestick & is currently testing the yellow (minor) uptrend line with the 742 price support the next level that will offer an objective short entry or add-on, if & when taken out. Daily chart below.
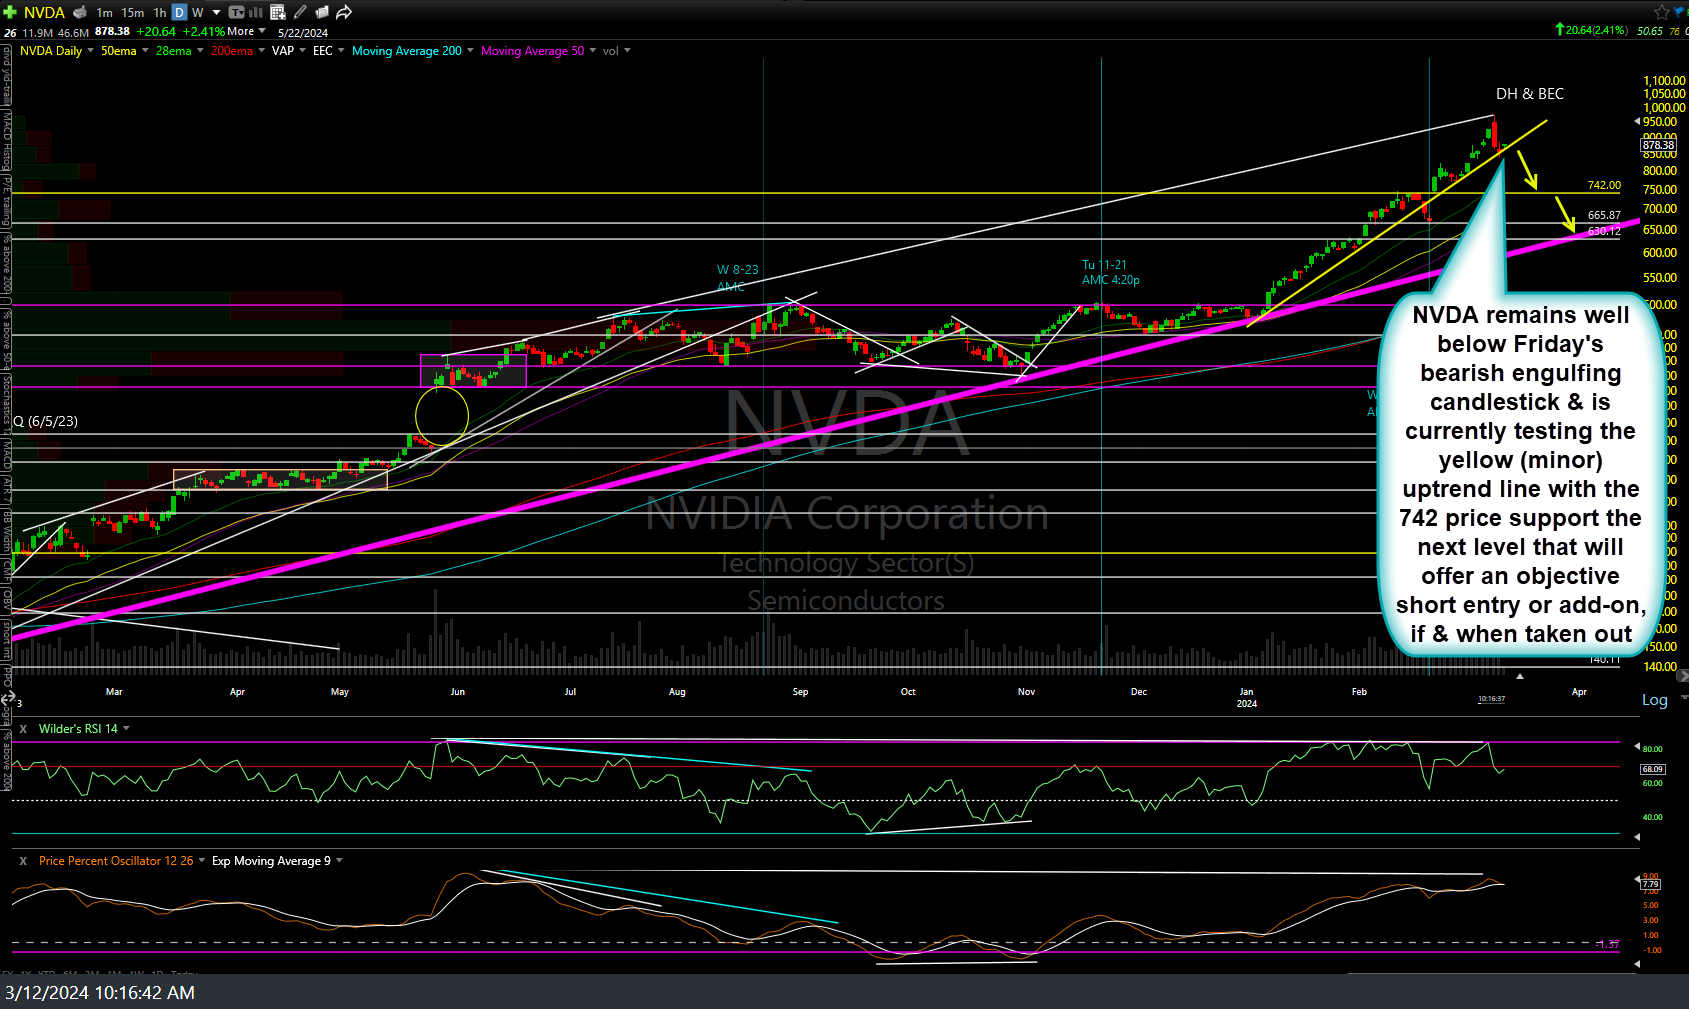
NVDA daily March 12th
While IWM (Russell 2000 Small-cap Index ETF) still offers an objective short entry here following Friday’s bearish engulfing candlestick* & failure of the 208.50 resistance, the next sell signal will come on solid break below the uptrend line off the Oct lows (*The BEC was on the daily chart, this is a 60-minute chart below).
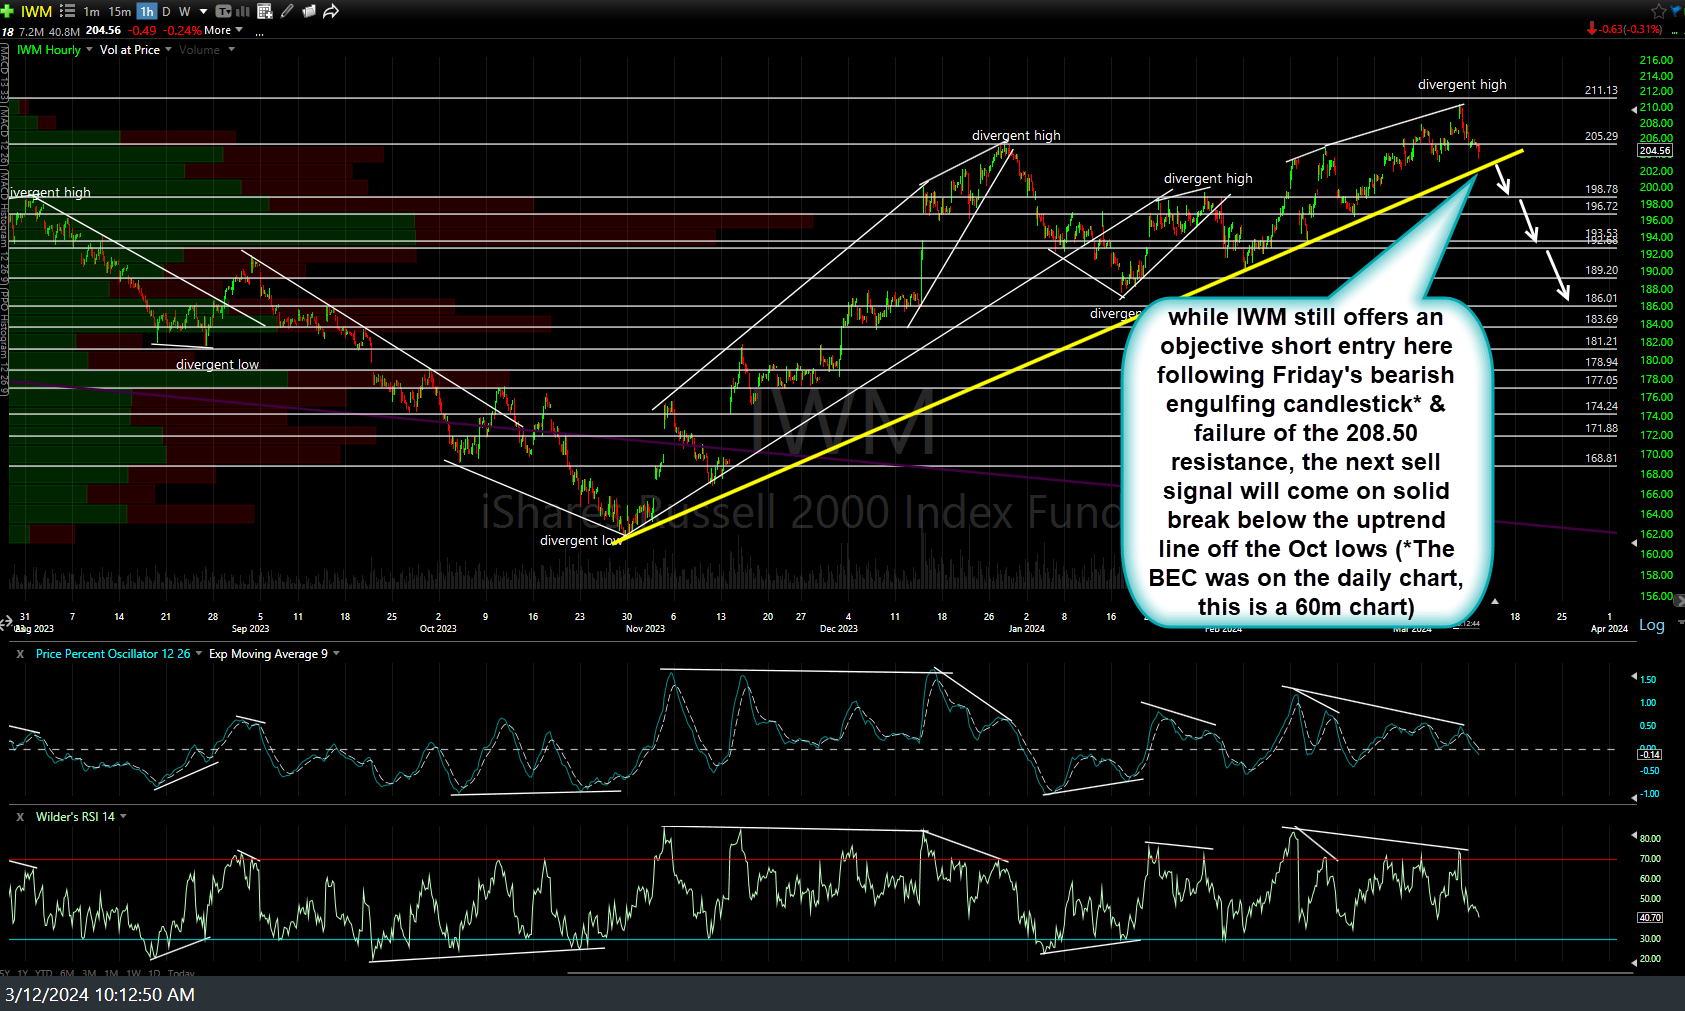
IWM 60m March 12th
Yesterday’s exit of the GDX long provided a nearly perfect milking of the recent run in the miners: In (long) just off the lows & out (final target hit) the day of the highs yesterday, side-stepping today’s pullback to the former T3 level, where at least a reflexive bounce is likely although my preference remains to wait patiently for the next objective entry on the miners, long or short.
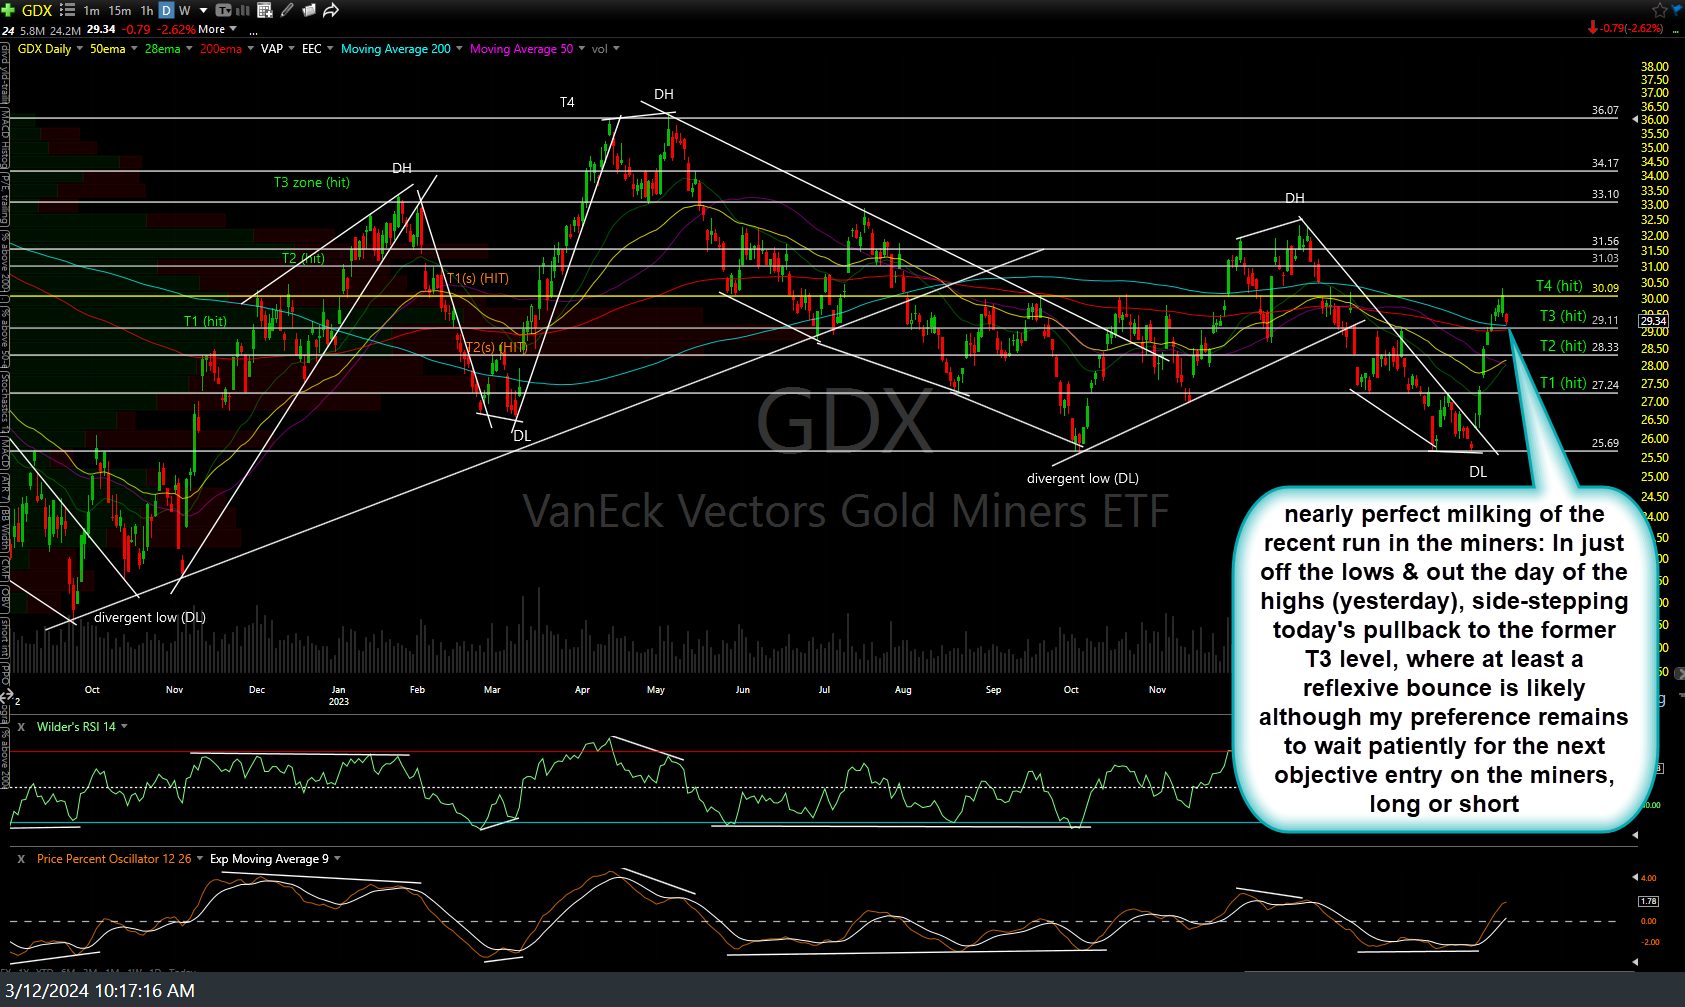
GDX daily March 12th
In summary, the 10-yr Treasury remains just above the yellow zone & while a few of the market-leading big tech stocks & key sectors have taken out some of the initial (or additional in some cases) key support levels, the majority of key stocks & sectors are still trading right around or just above those key levels, thereby not providing the ‘all-in’ or aggressive short sell signal at this time. However, due to the close proximity on just above all of those key stocks & sectors to those very significant support levels, I suspect that most will go in relatively short order as soon as we get a few more of those support levels taken out. All the better (although not a necessity) if IEF falls back into the YELLOW ZONE and especially if it were to enter the ORANGE ZONE.