
Stock index futures have set up in bearish rising wedge patterns on these 60-minute time frames. The first sell signal on /ES (S&P 500 futures) will come on a wedge breakdown with the next sell signal to come on a solid break back below the 2840 level. If so, that would make this momo-fueled breakout above that level a bull trap.
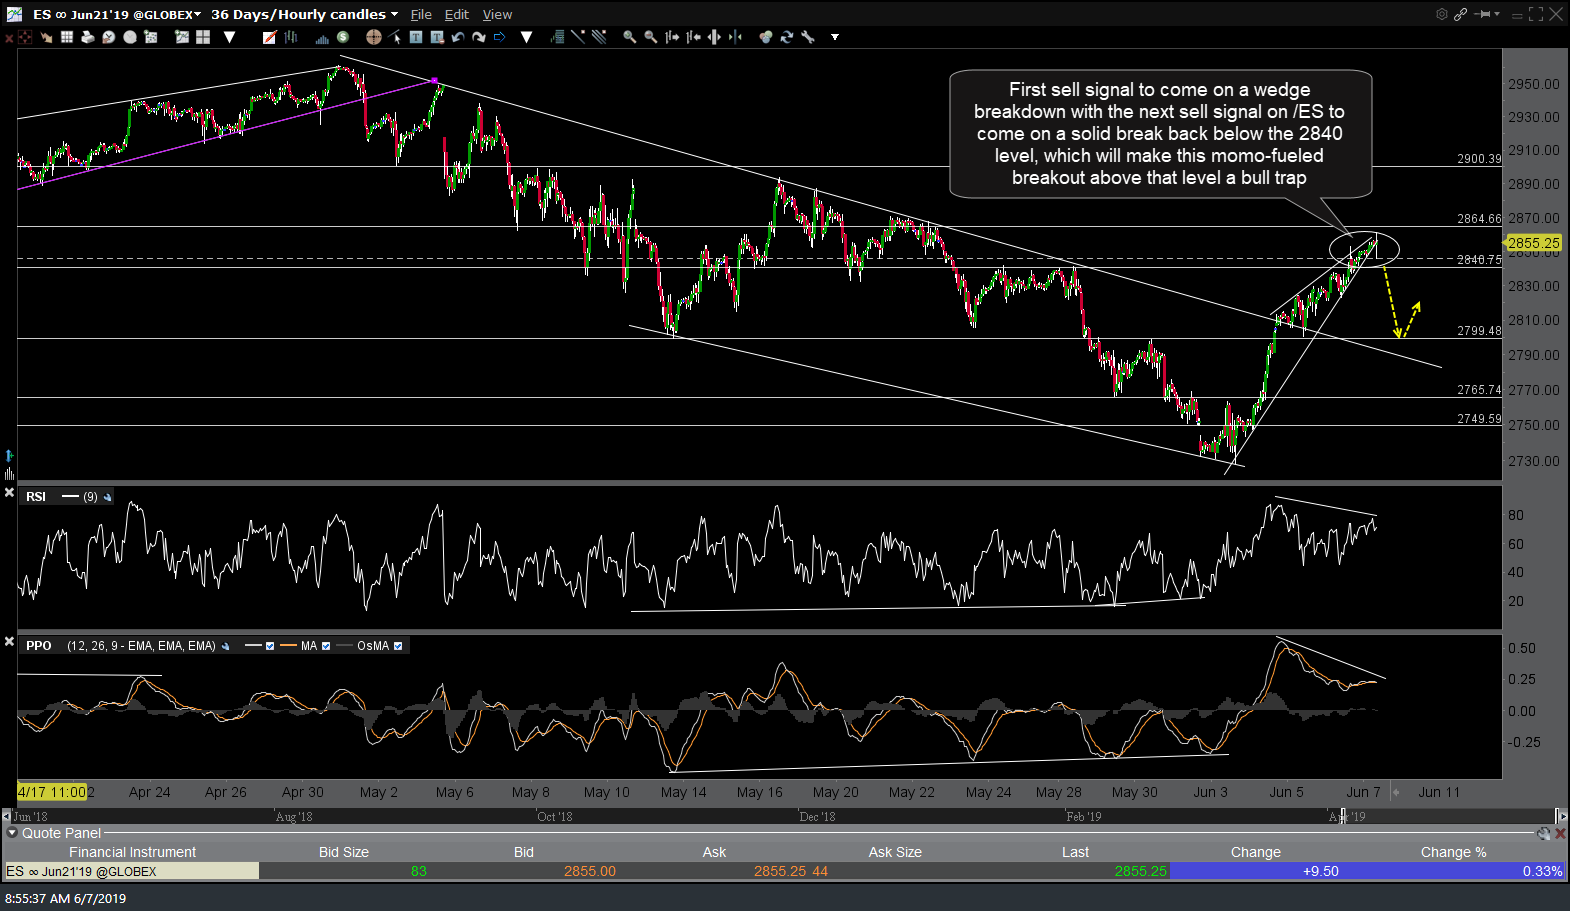
ES 60-min June 7th
Likewise, a sell signal on/NQ (Nasdaq 100 futures) to come on a break below this bearish rising wedge pattern. QQQ is under consideration as an Active Short Trade with a chart & potential or official price targets to follow soon.
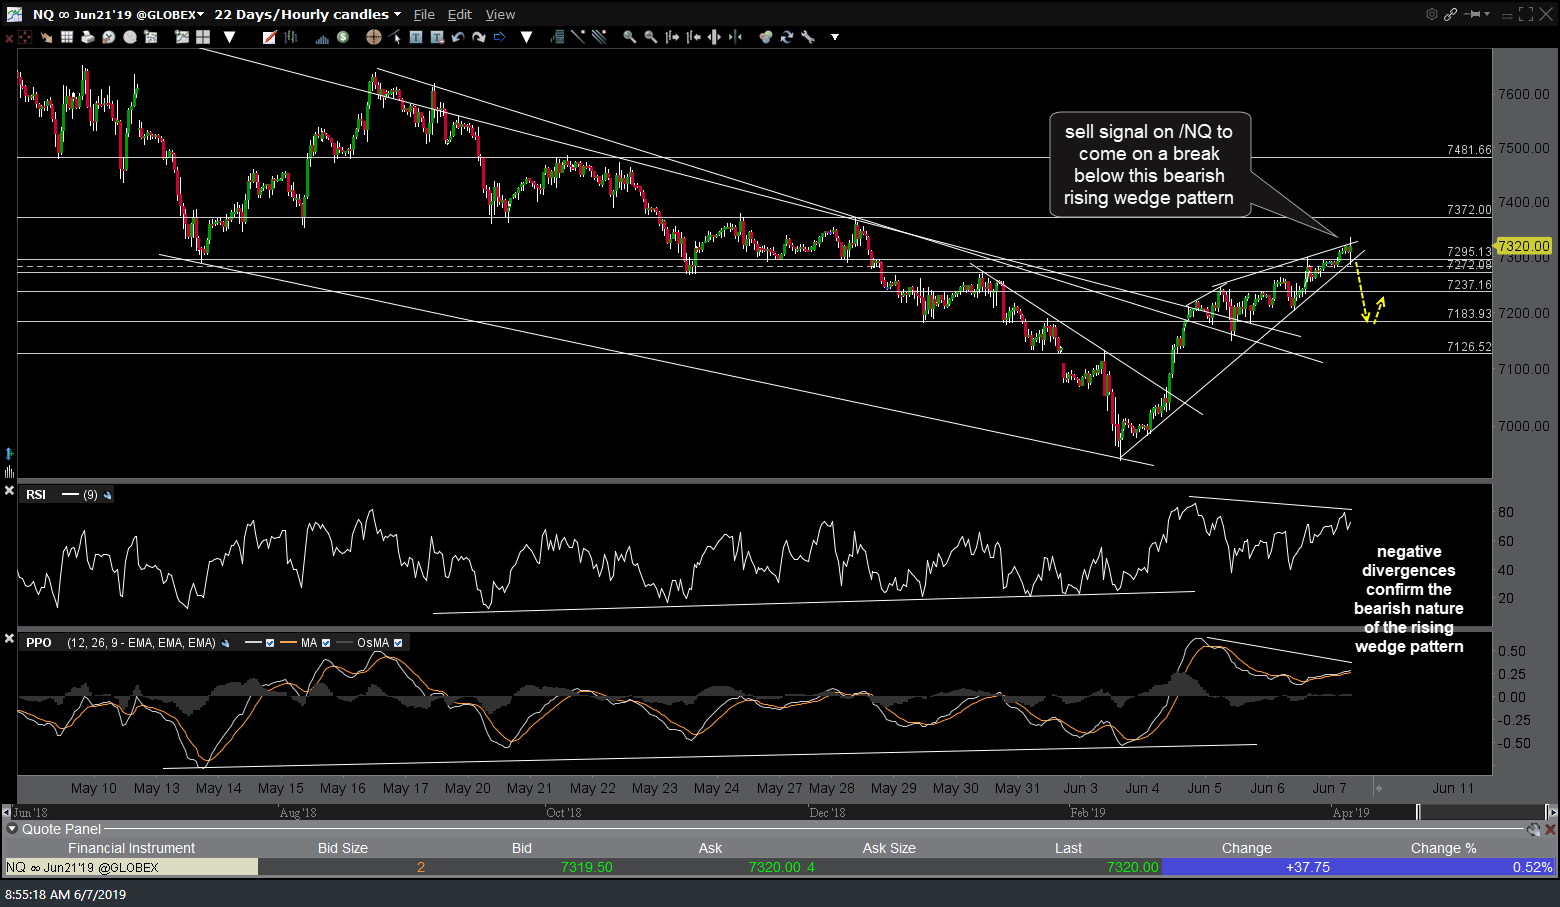
NQ 60-min June 7th
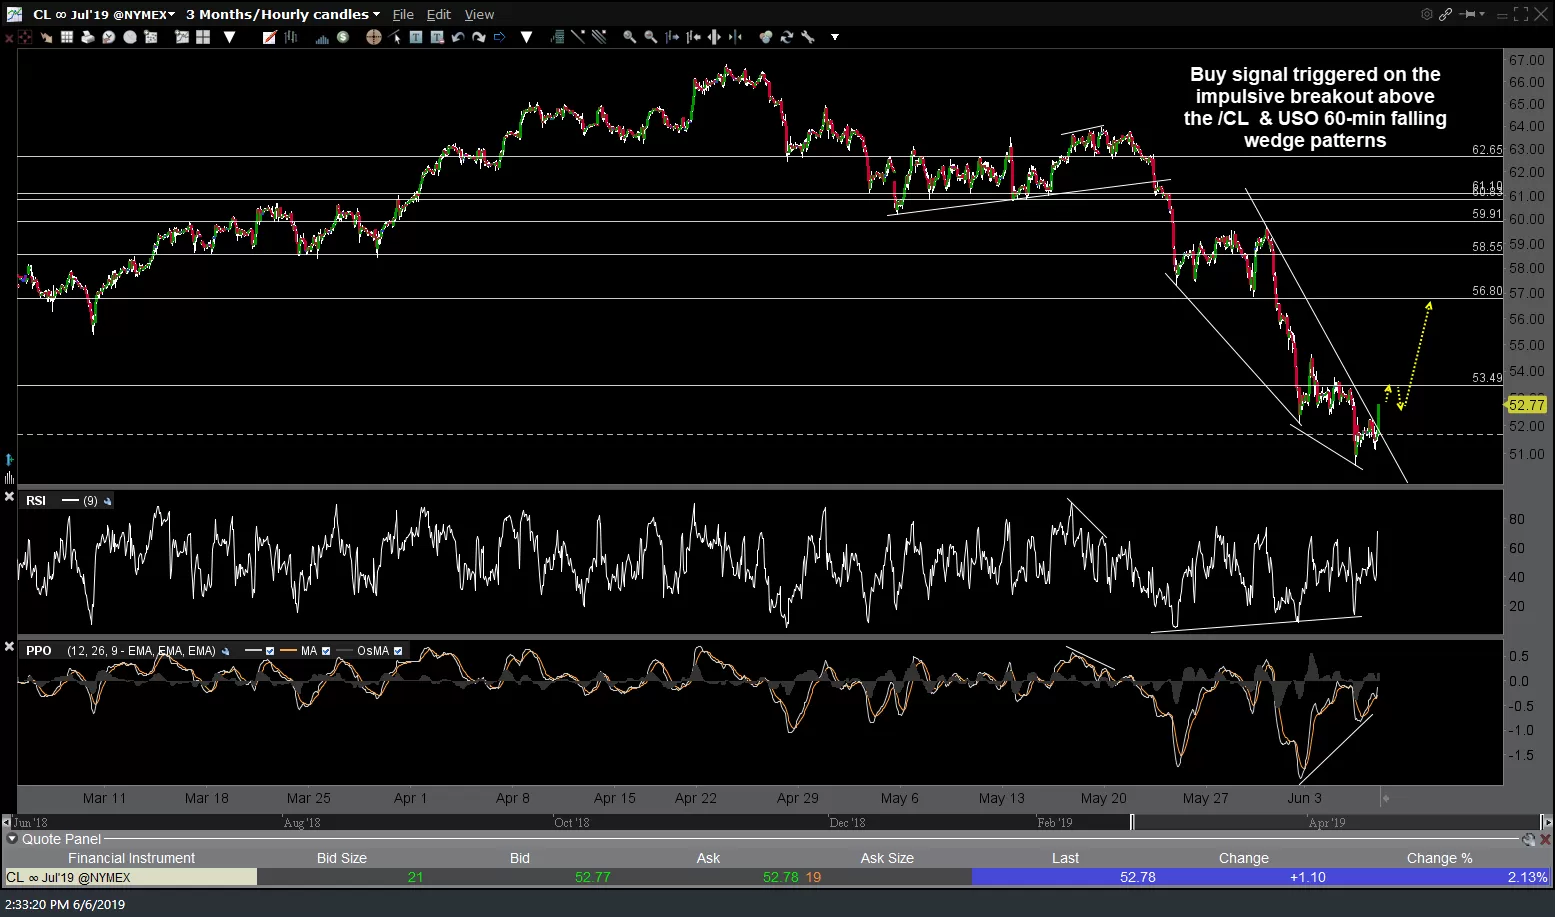
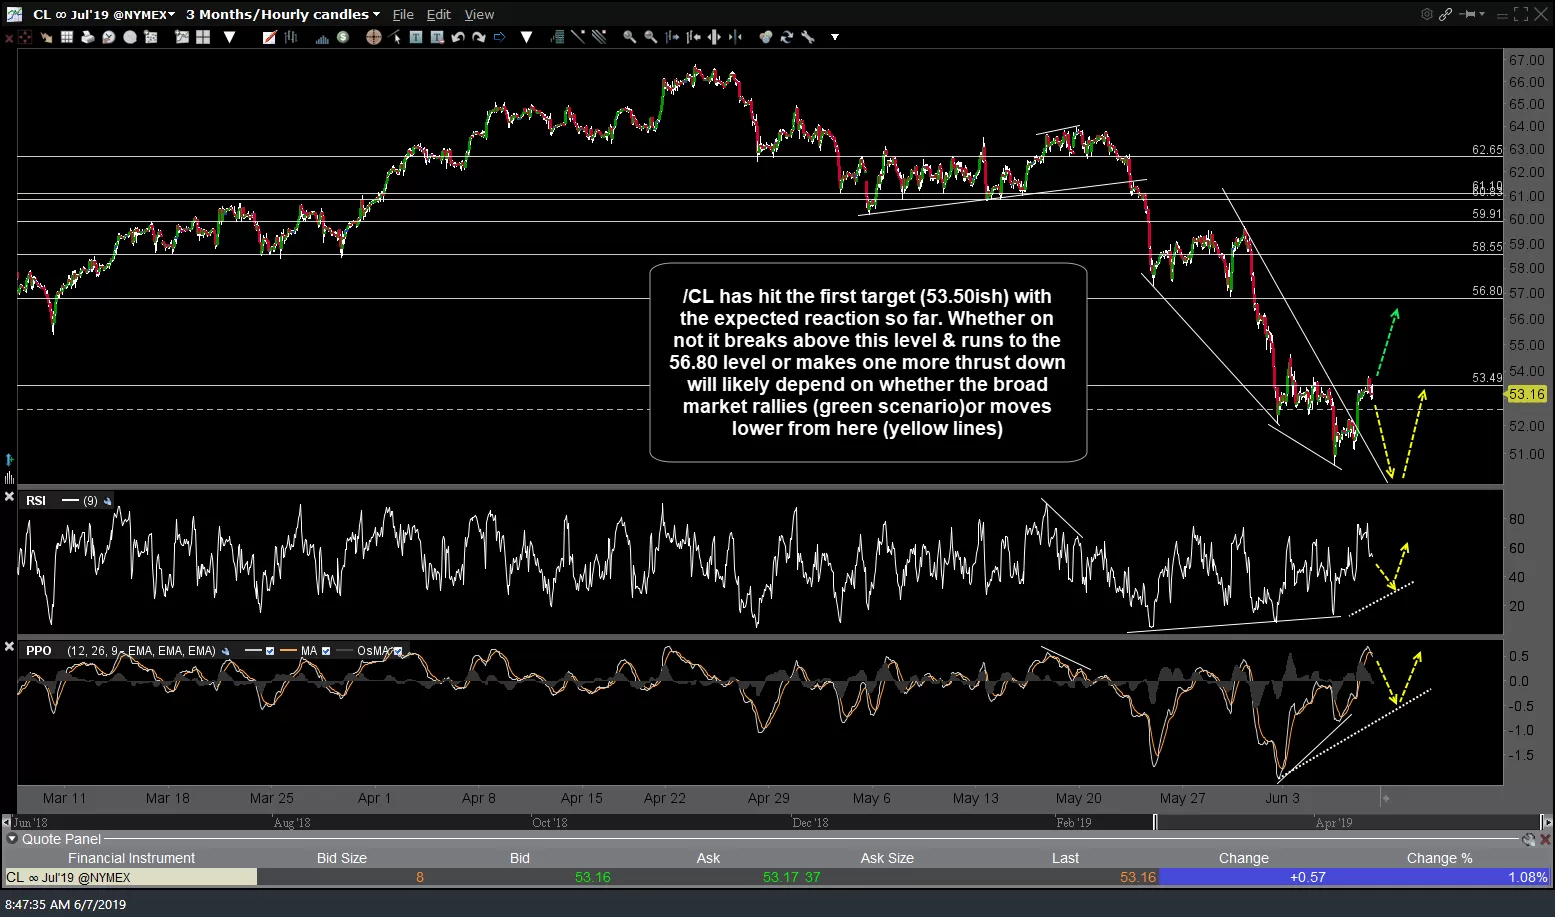
/CL (crude oil futures) continues to play out as expected following yesterday’s bullish falling wedge breakout with /CL rallying up to the first target (53.49) followed by the expected pullback so far. I’m holding off on making USO or DWT an official swing trade at this time due to the elevated risk of a trend reversal/correction in the equity markets. Whether on not it breaks above this level & runs to the 56.80 level or makes one more thrust down will likely depend on whether the broad market rallies (green scenario)or moves lower from here (yellow lines). As such, this remains an unofficial trade for now. Yesterday’s & today’s updated 60-minute charts below:
-

- CL 60-min June 6th
-
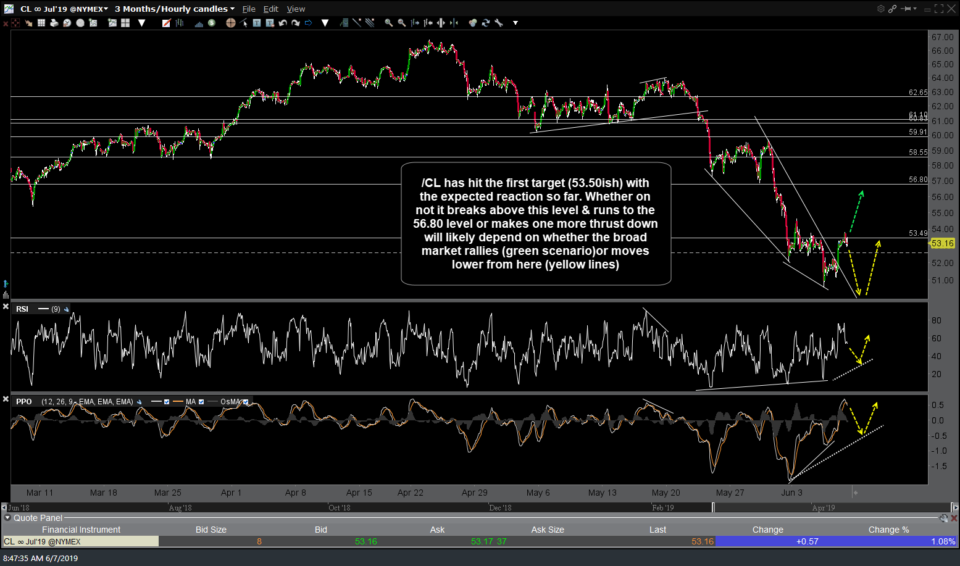
- CL 60-min June 7th
/NG (natural gas futures) was posted as an aggressive & unofficial trade setup in the trading room yesterday with a buy signal to come on breakout above this bullish falling wedge pattern, with the pattern still intact for now. UGAZ is the 3x long/bullish nat gas ETN that could be used as proxy for trading nat gas & that is also under consideration as an official long trade idea. If so, I will follow up with a chart on UGAZ with trade parameters (stops, price targets, position size adjustment, etc.) but as of now, I can say that the 22.00 area looks like my max. bounce target on UGAZ & if hit, that would be about a 30% gain from current levels.
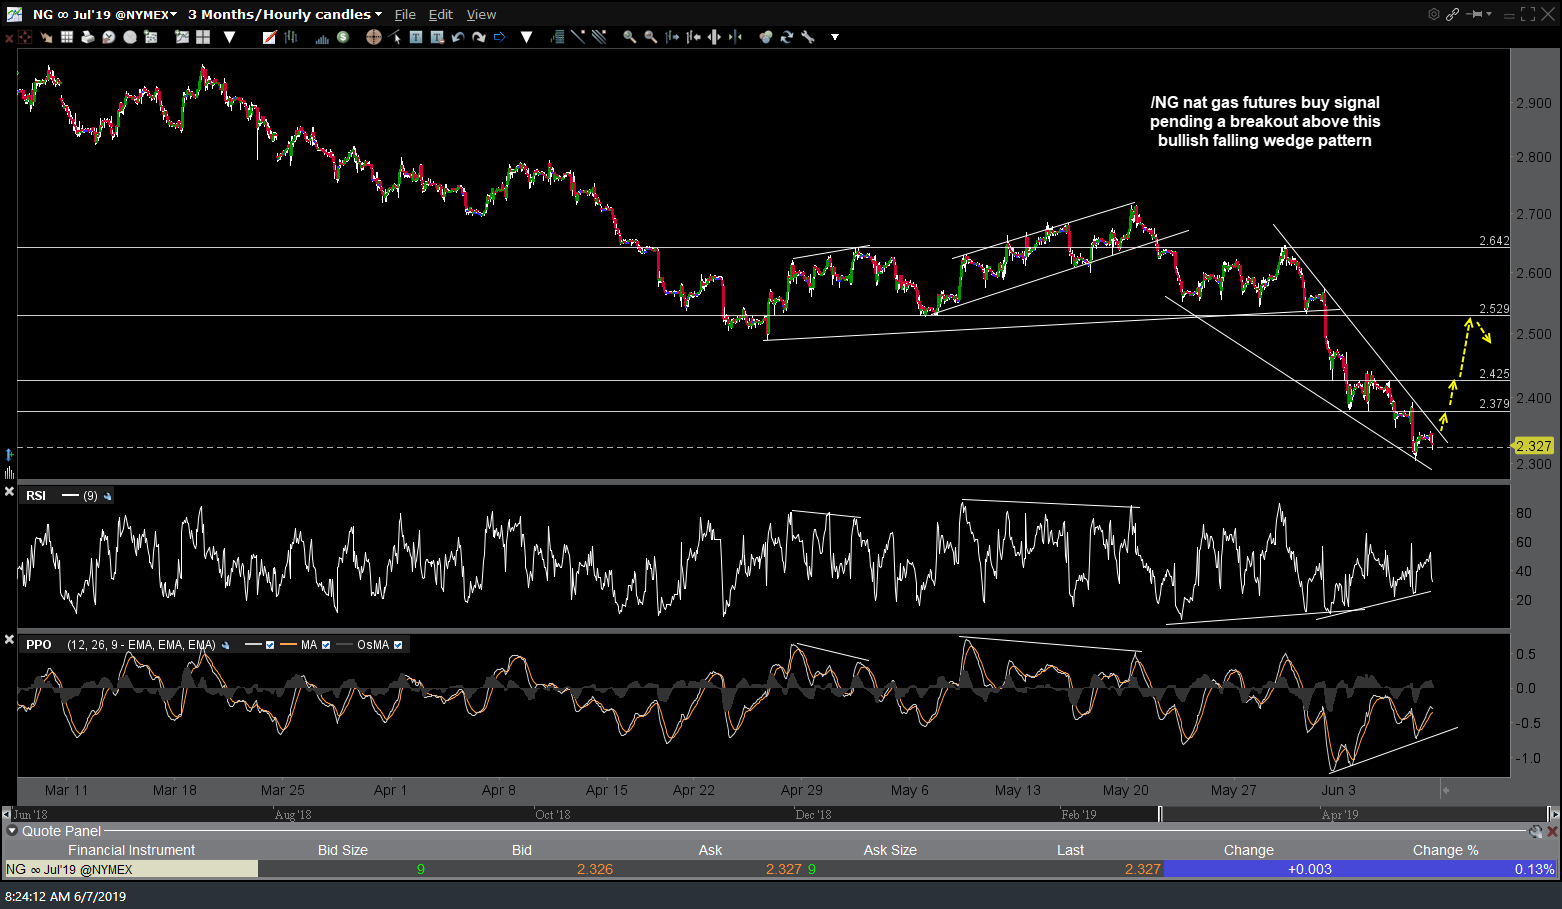
NG 60-min June 7th