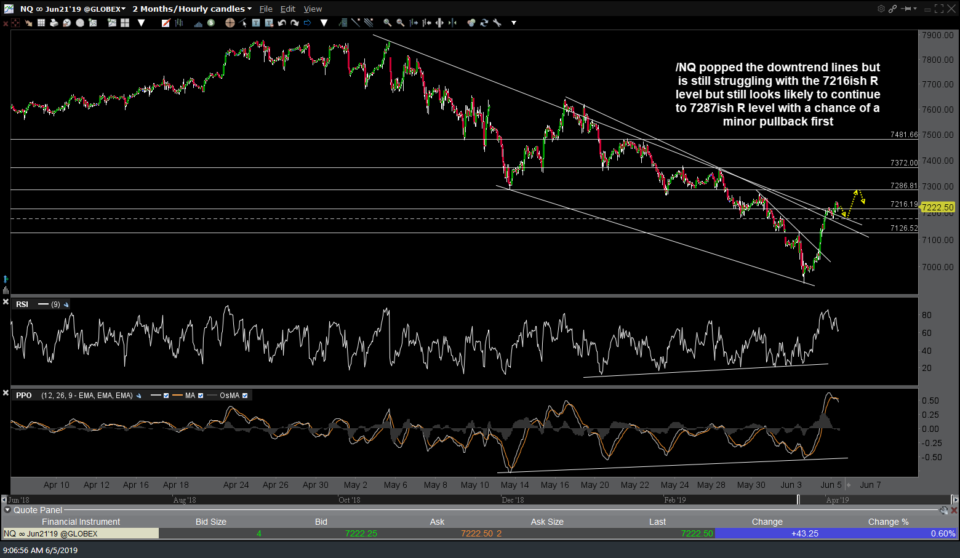
/NQ (Nasdaq 100 futures) popped the downtrend lines but is still struggling with the 7216ish R level but still looks likely to continue to 7287ish R level with a chance of a minor pullback first.
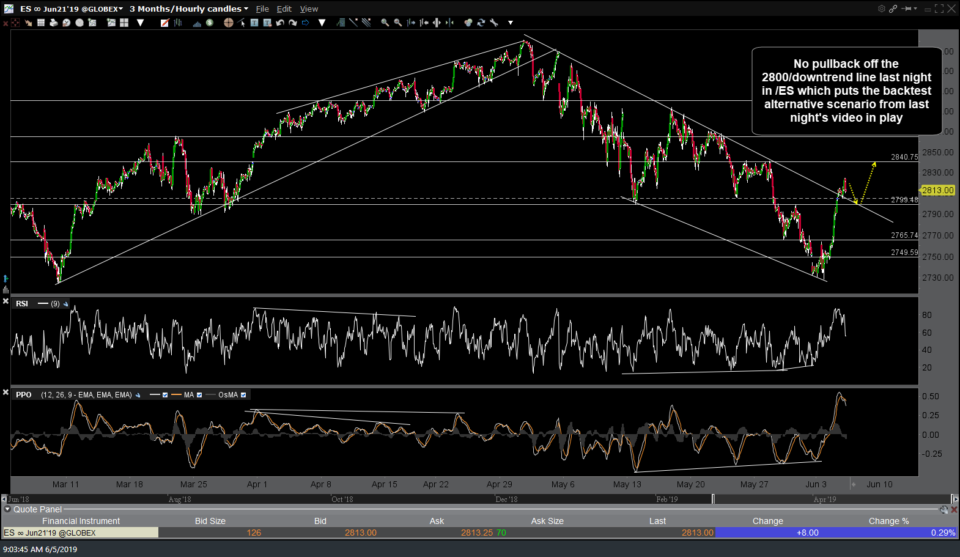
We didn’t get a minor pullback off the 2800/downtrend line last night in /ES, which was my preferred scenario, which puts the ‘backtest’ alternative scenario from last night’s video in play.
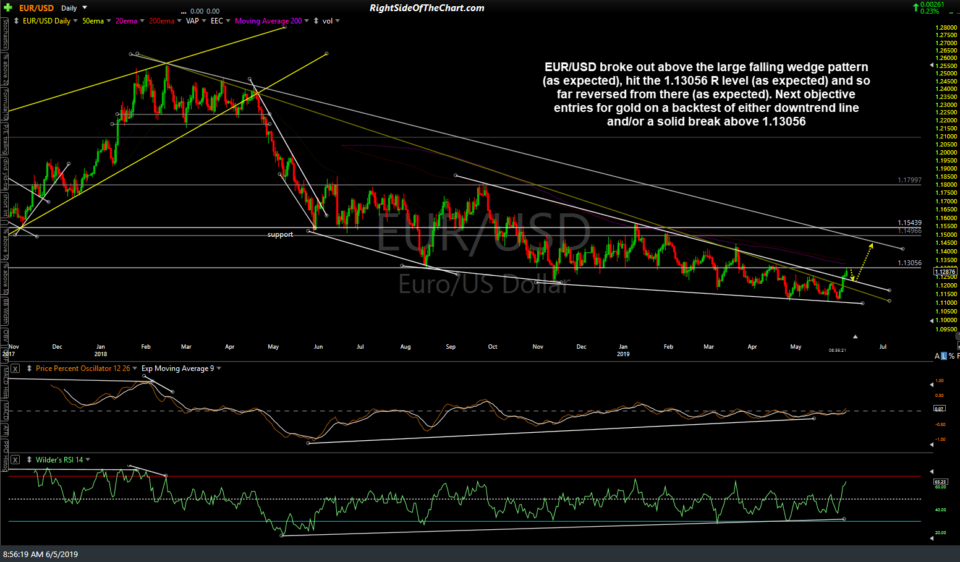
EUR/USD broke out above the large falling wedge pattern (as expected), hit the 1.13056 R level (as expected) and so far reversed from there (as expected). Next objective entries or add-on for gold to come on a backtest of either downtrend line and/or a solid break above 1.13056.
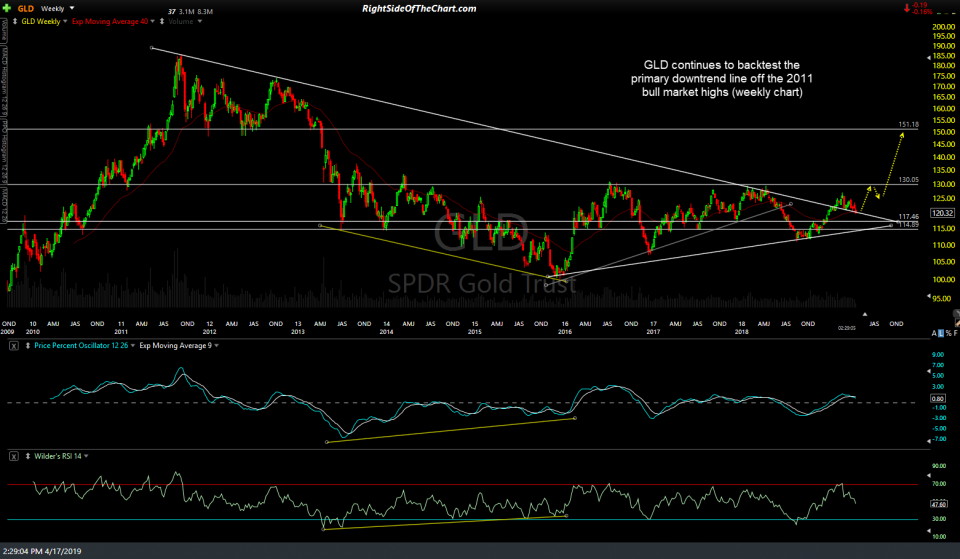
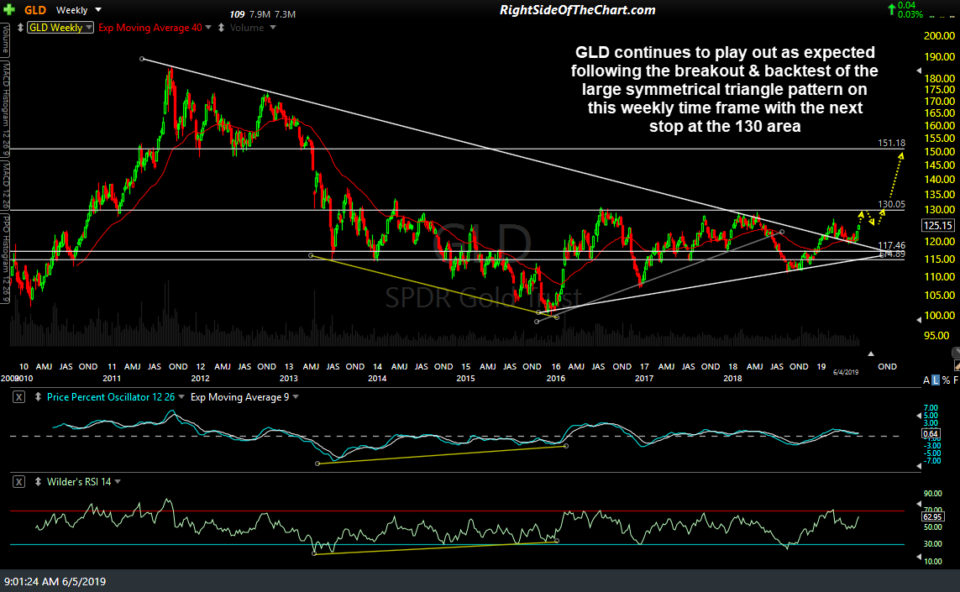
GLD continues to play out as expected following the breakout & backtest of the large symmetrical triangle pattern on this weekly time frame with the next stop at the 130 area. Previous weekly chart from April 17th followed by the updated weekly chart below. (these gallery chart images may not be viewable on the subscriber email notifications).
- GLD weekly April 17th
- GLD weekly June 5th
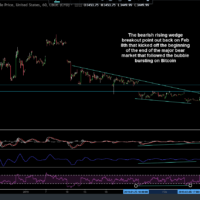
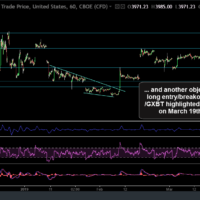
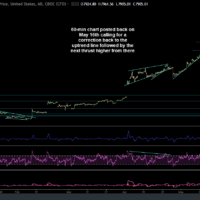
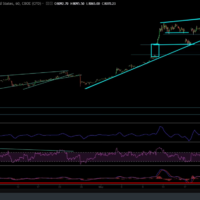
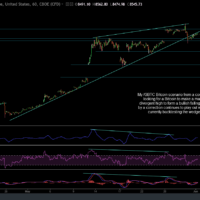
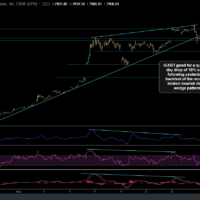
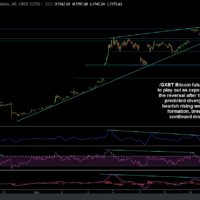
/GXBT Bitcoin futures continue to play out as expected following the reversal after the previously predicted divergent high & bearish rising wedge pattern formation, breakdown & continued move lower. Other the recent string of updates looking for & then getting the divergent high & bearish trend reversal, all previous updates on /GXBT earlier this year were bullish setups with long-side entries, including the bullish falling wedge that marked the end of the major correction/bear market that followed the all-time highs in Bitcoin. (click first chart to expand, then click on right of each chart to advance)
- GXBT 60-min Feb 8th
- GXBT 60-min March 19th
- GXBT 60-min May 16th
- GXBT 5-24 video screenshot
- GXBT 60-min June 3rd
- GXBT 60-min June 4th
- GXBT 60-min June 5th


