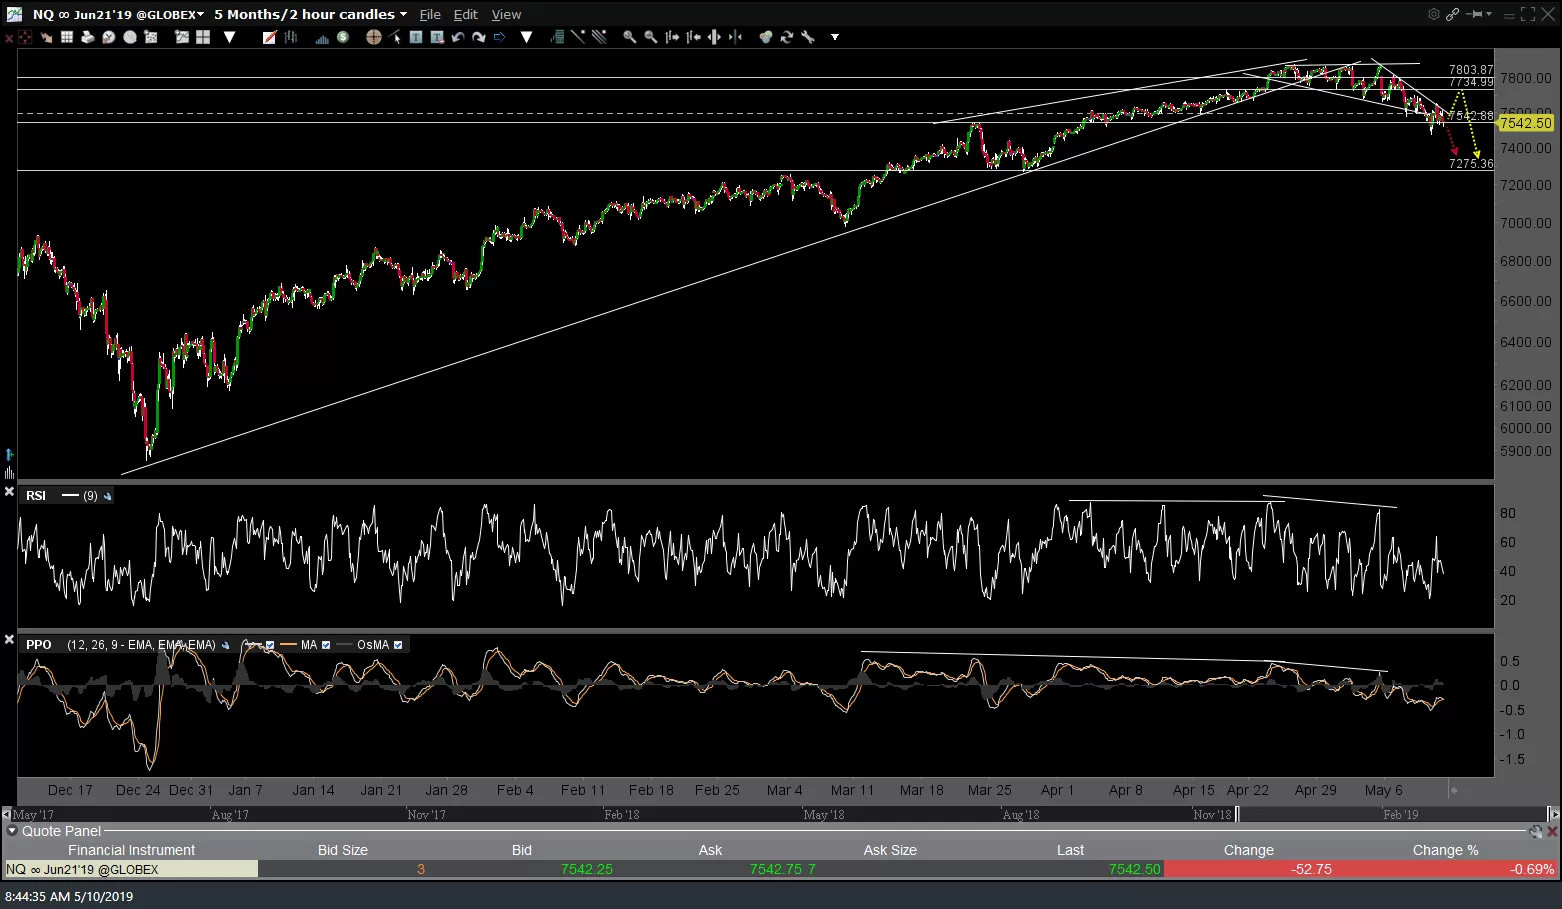
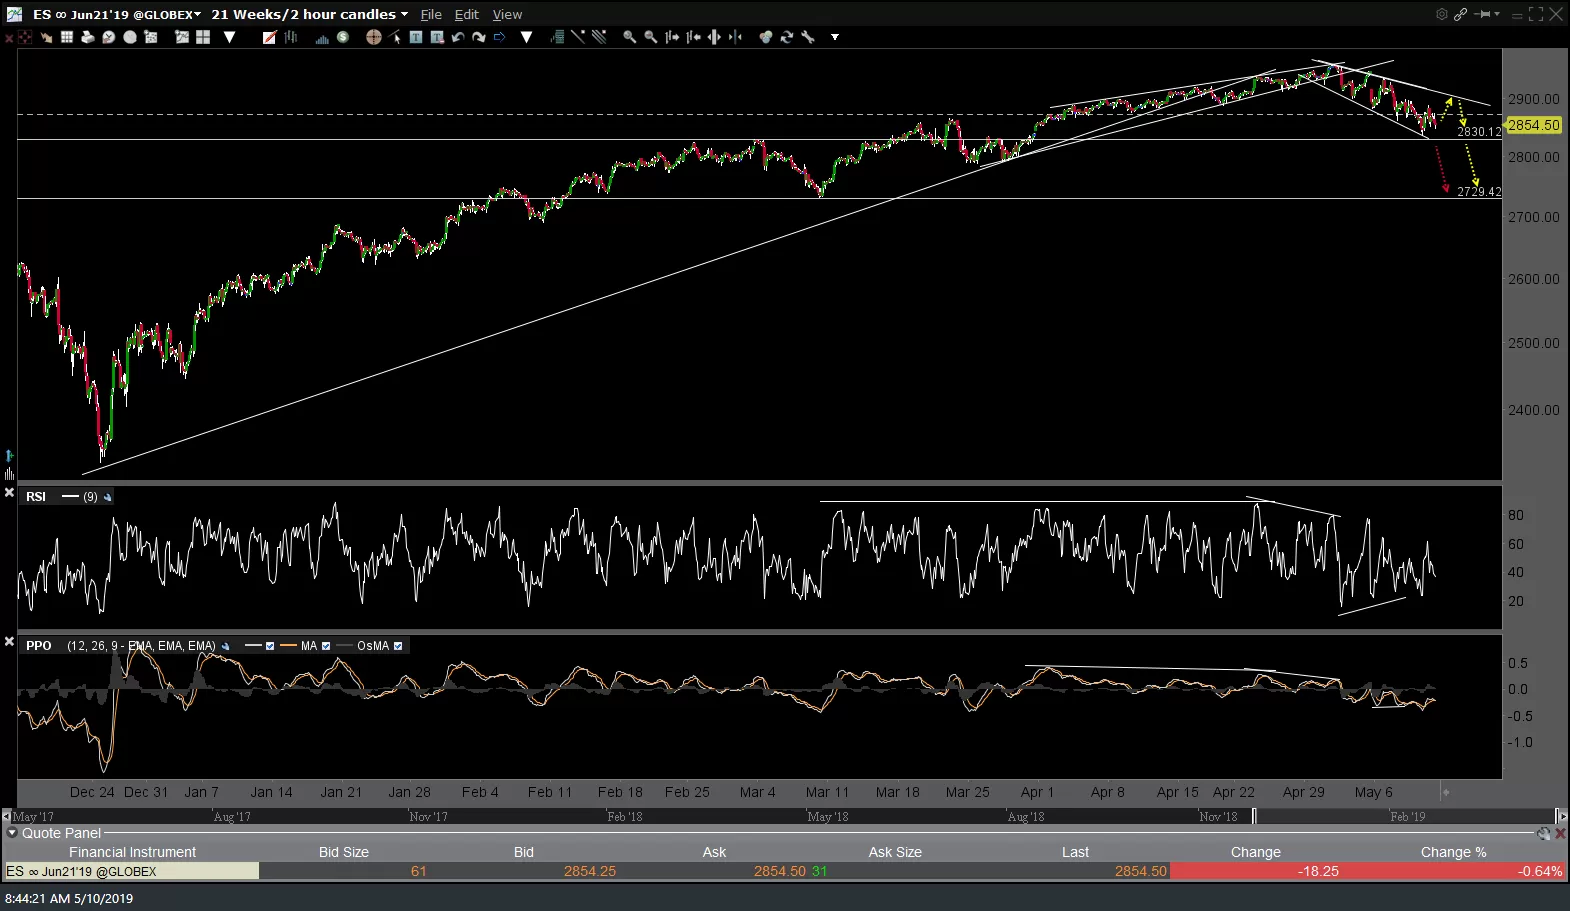
After a brief undercut/momentum-fueled overshoot of the 7543 support level followed by bounce to backfill yesterday gap on QQQ, /NQ (Nasdaq 100 Futures) has drifted back down to that 7543 support level once again which increases the odds of another bounce starting from this level in pre-market & potentially carrying over into the regular session today unless that level, along with yesterday’s lows, gives way soon. Even if /NQ, QQQ, /ES & SPY were to take out yesterday’s lows soon, we need to watch the 2830 minor support on /ES along with the 282ish minor support on SPY which could contain any lower lows today.
-
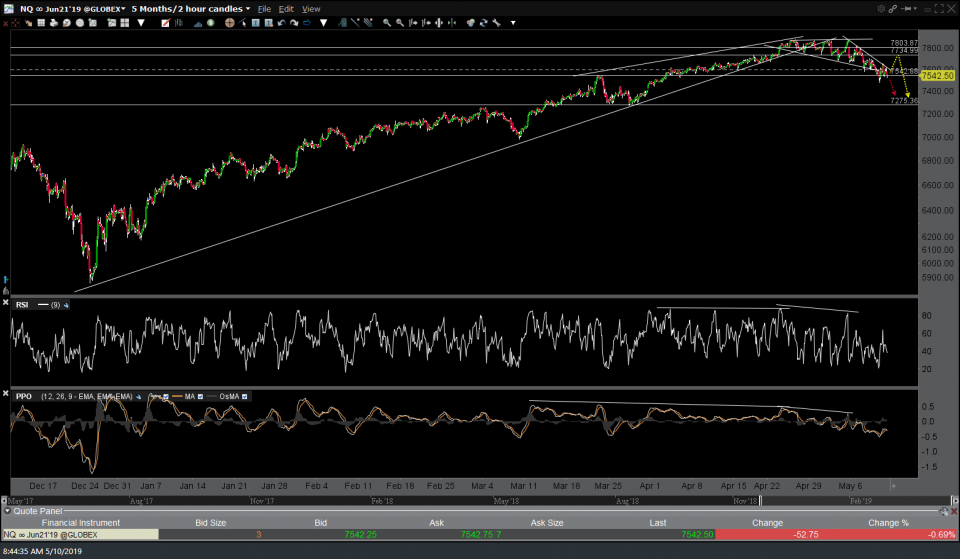
- NQ 60-min May 10th
-
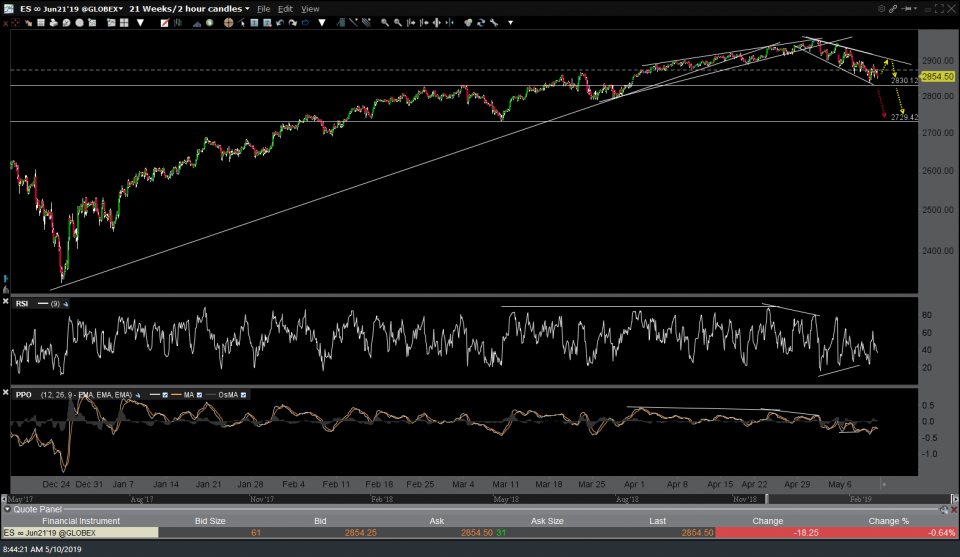
- ES 60-min May 10th
-
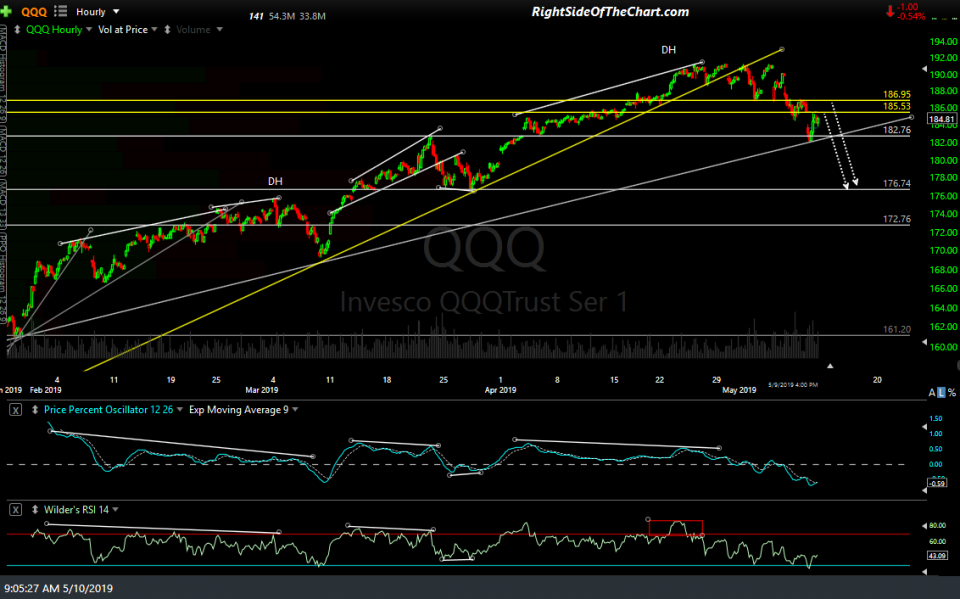
- QQQ 60-min May 10th

-
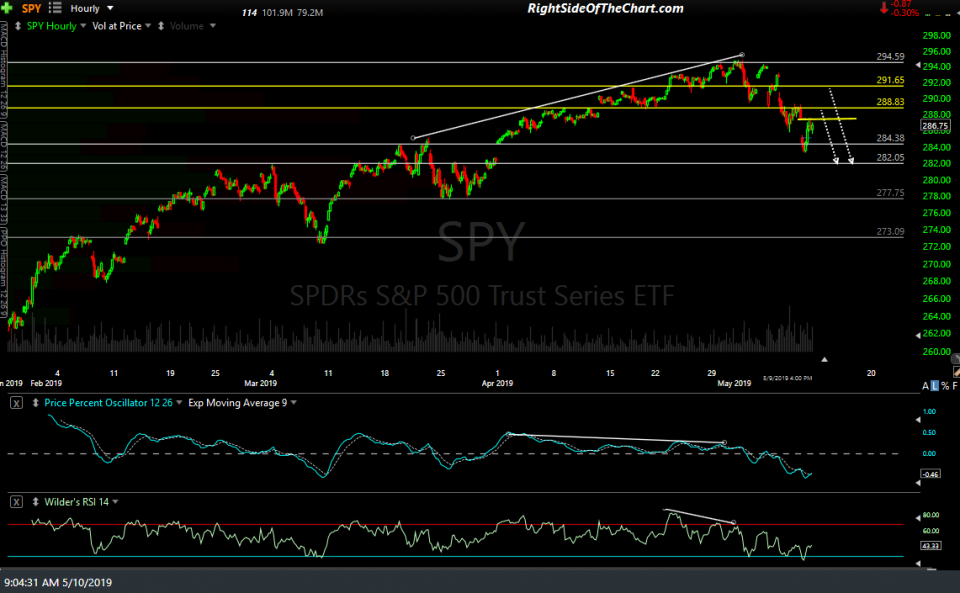
- SPY 60-min May 10th

Bottom line, while it still appears that more downside in the broad markets is likely in the coming days to weeks, the near-term oversold conditions along with the fact that the major stock indices & a few market-leading stocks closed at or near support yesterday makes the very near-term (today & early next week) outlook unclear although the intermediate-term outlook remains bearish with the 2nd & 3rd price targets on the QQQ short trade still likely to be hit even if the markets mount a counter-trend rally before then. Yellow lines on these 60-minute charts of SPY & QQQ mark resistance levels which are likely to cap any snapback rally.
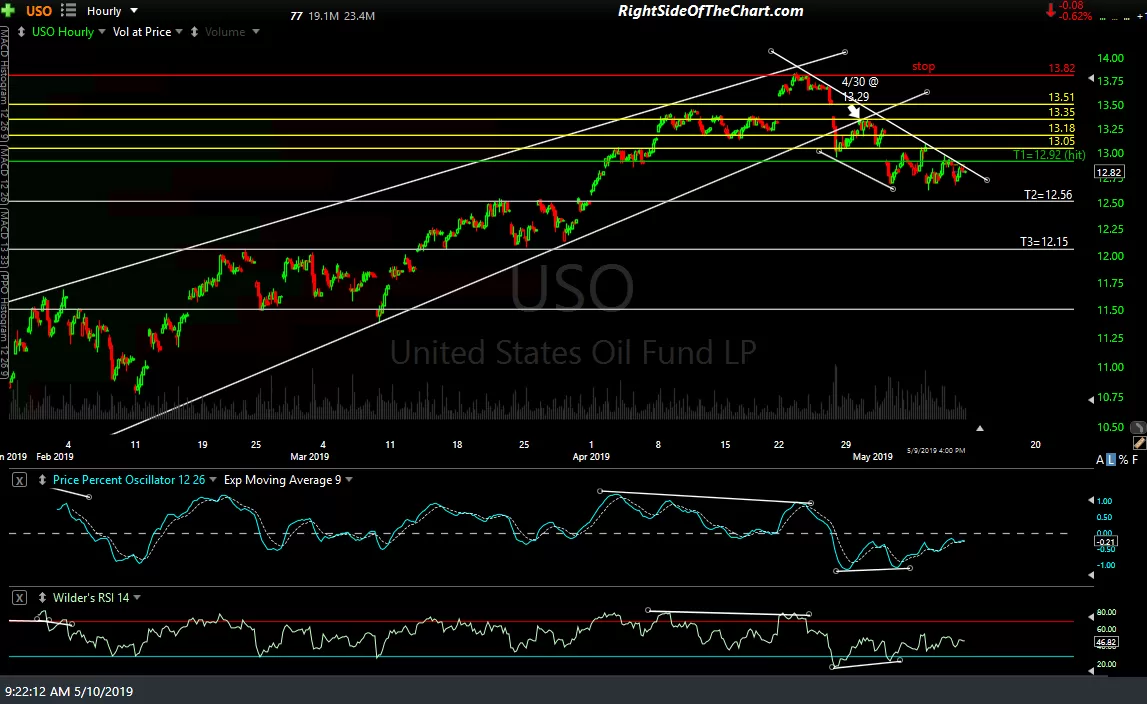
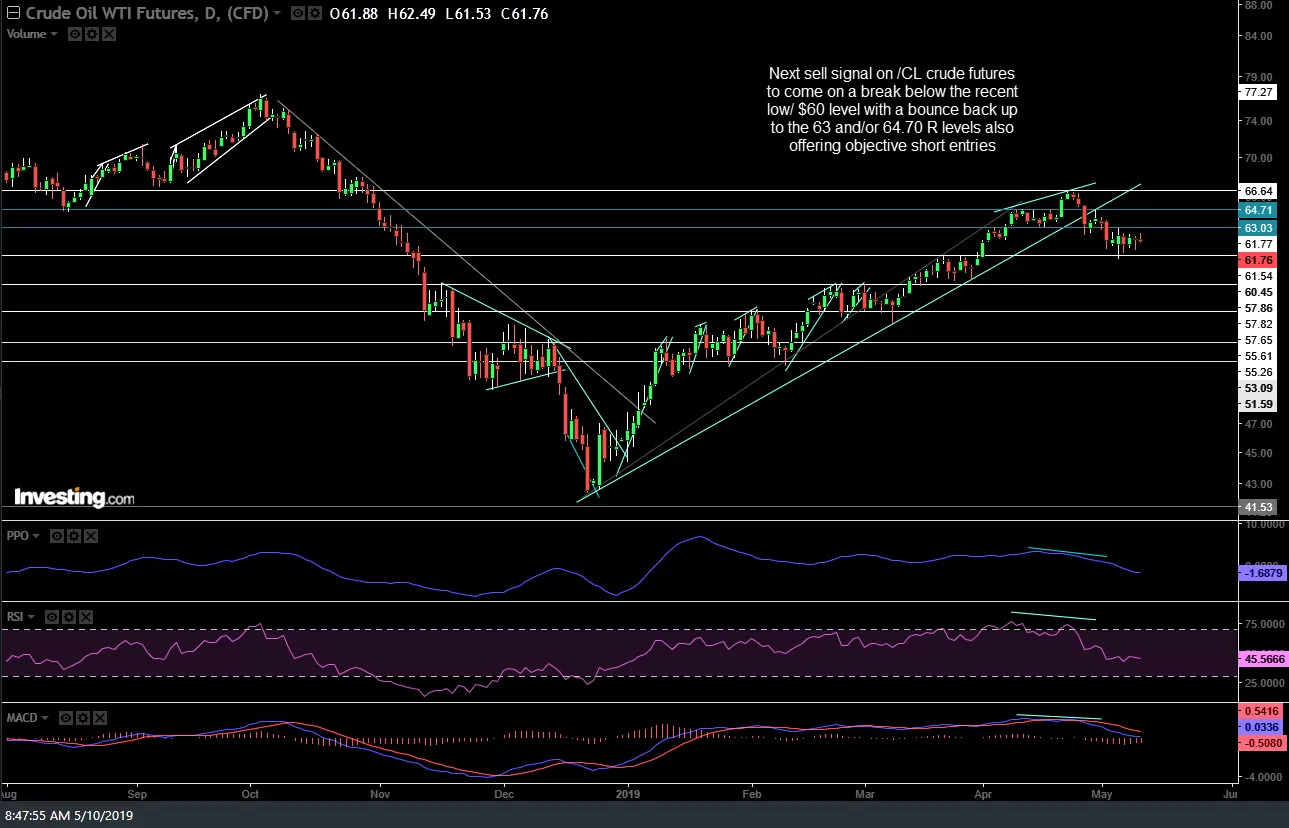
I have commented on crude recently, both here in the trading room & in some of the recent videos. Basically, both USO & /CL recently put in bullish divergences on the 60-min charts & that, coupled with the news that broke Sunday night regarding the increasing tensions between Iran & the US have both provided some near-term bullish tailwinds for crude oil. While the near-term direction isn’t very clear, I don’t see enough bullish evidence in the charts to warrant closing out the USO swing trade as I still think that T2 & T3 have a good chance of being hit in the coming days to weeks before the suggested stop is hit. I also mentioned that I will likely lower the stop to entry if/when T2 is hit. Finally, I had added some yellow lines at resistance levels which are likely to cap any rallies. Here’s the /CL daily chart along with the updated 60-min chart including a minor downtrend line to watch that could spark up to any of the yellow lines if taken out impulsively.
-
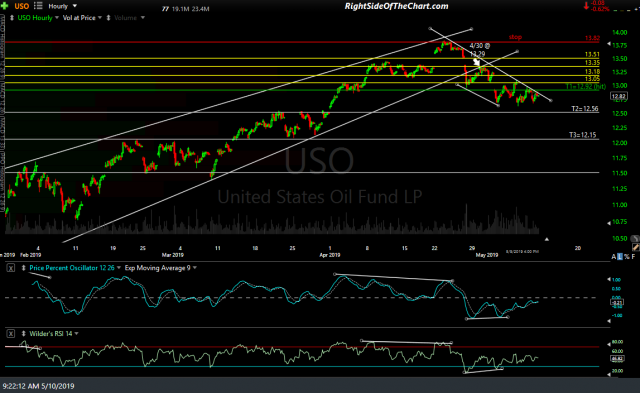
- USO 60-min May 10th
-
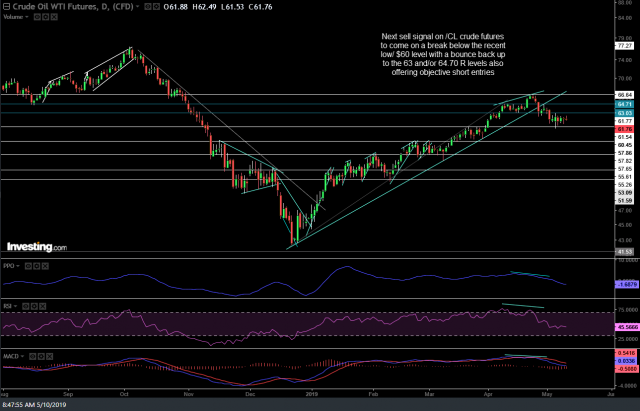
- CL daily May 10th
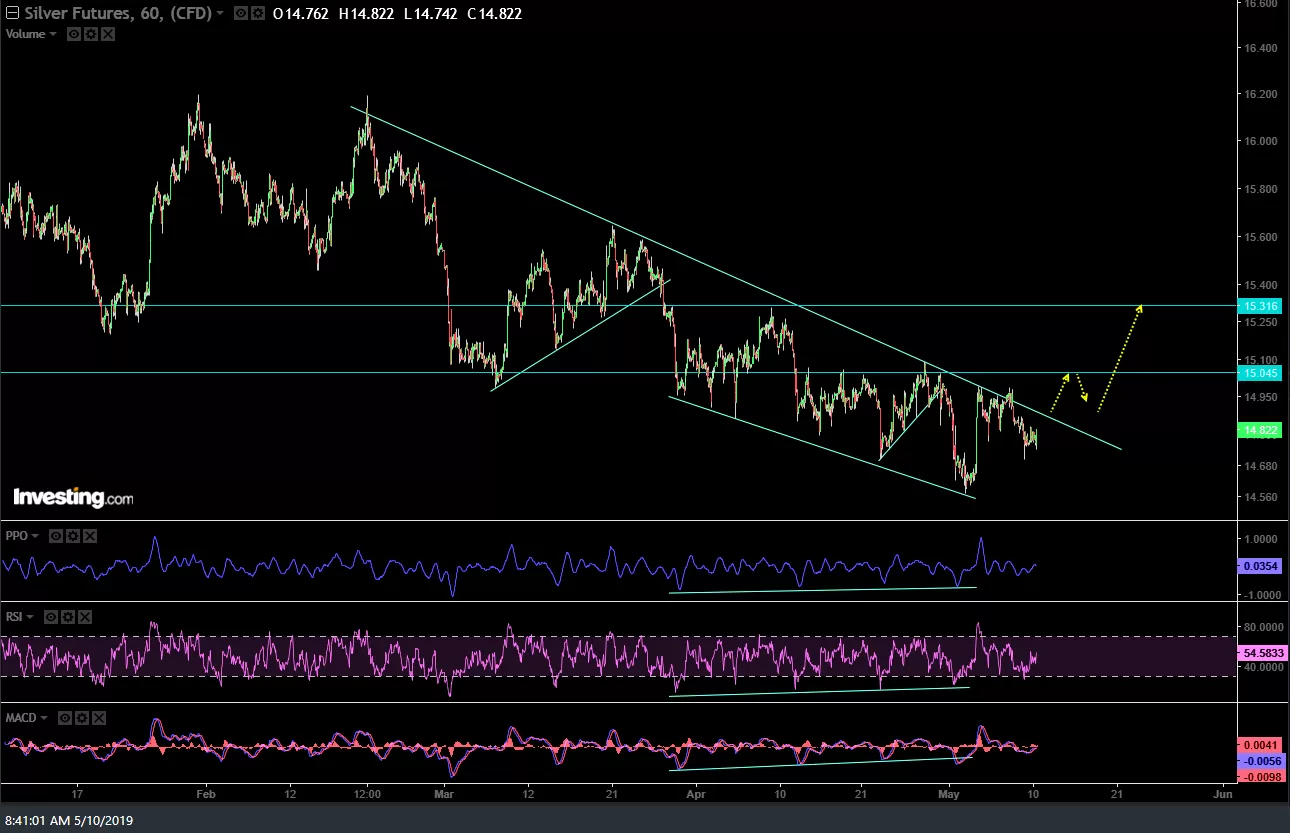
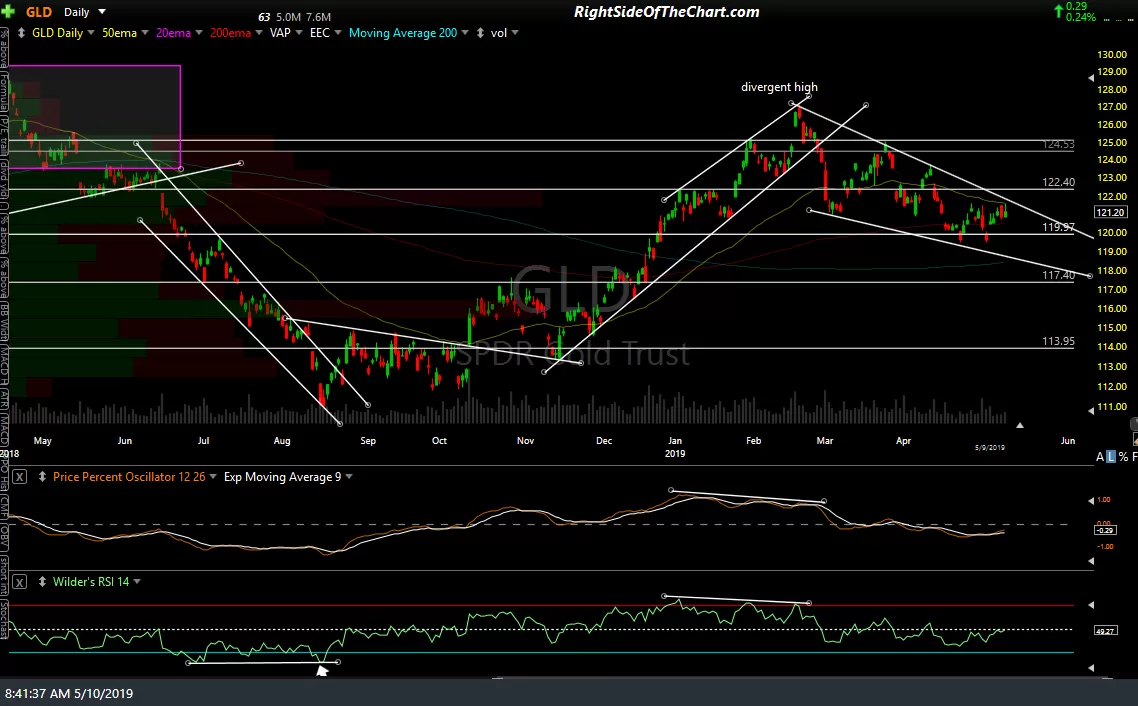
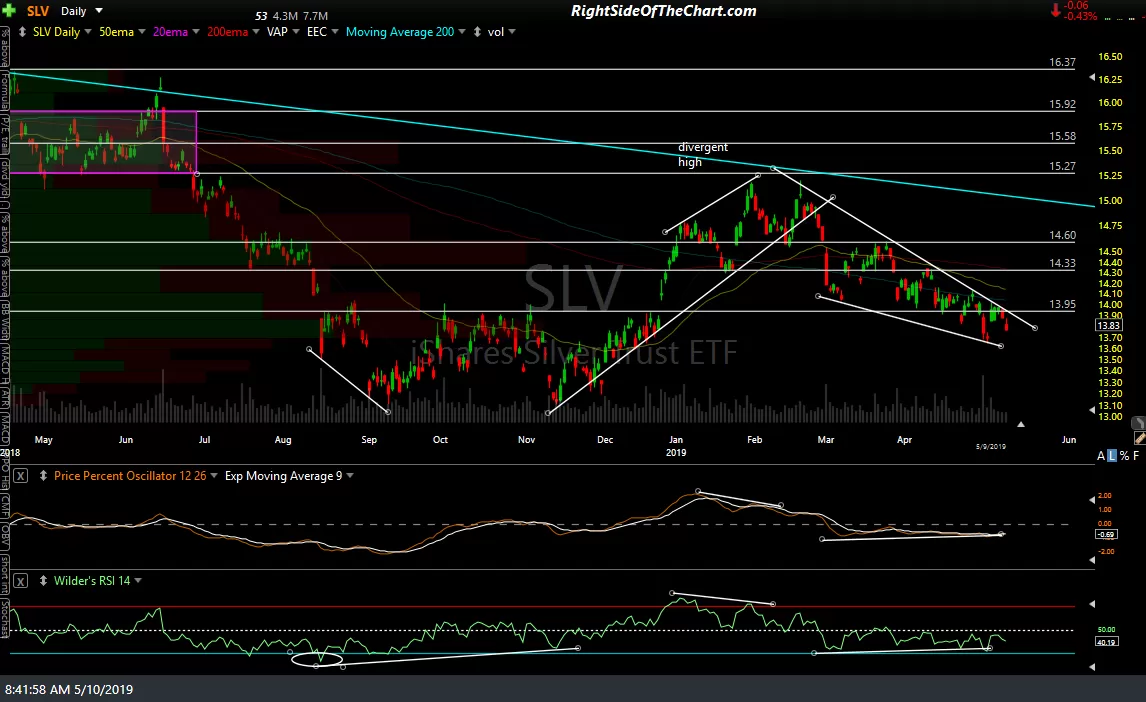
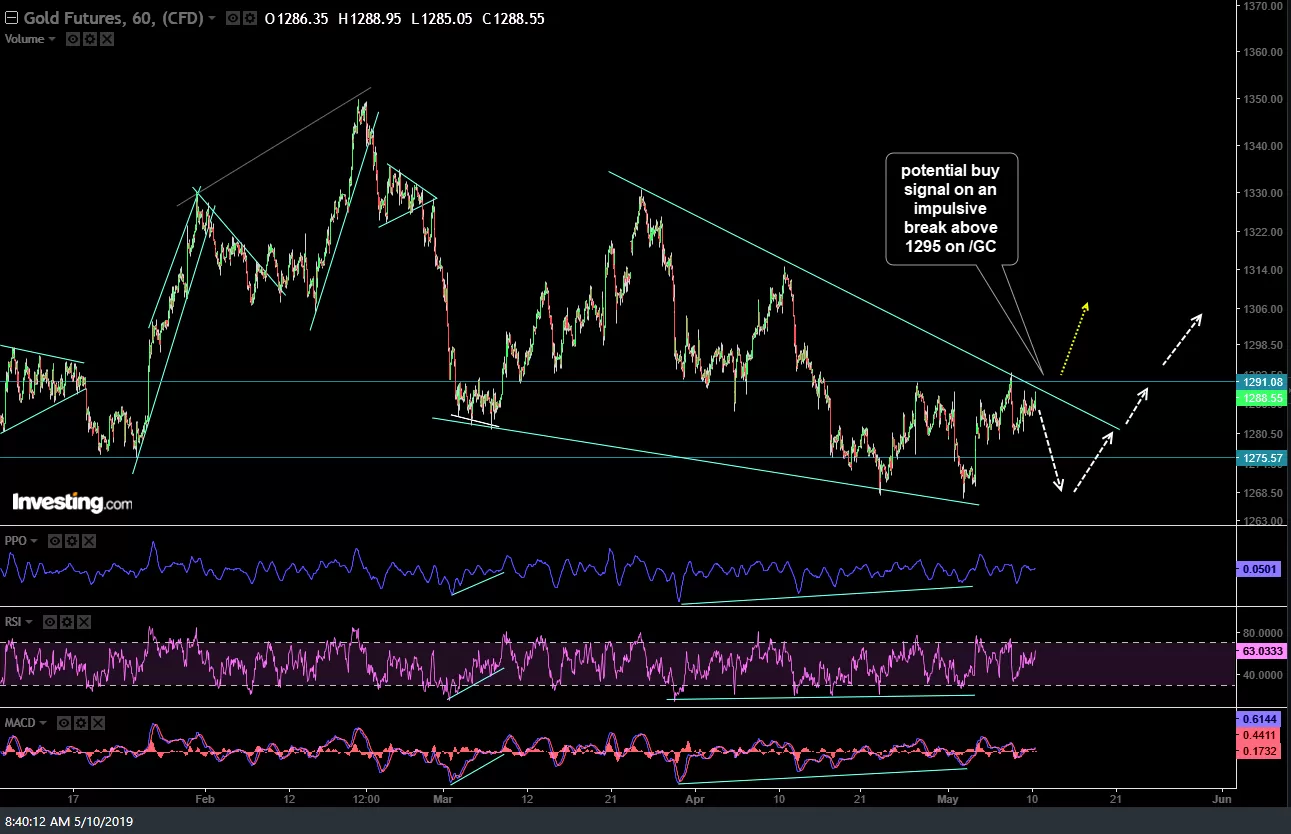
Finally, a quick look a the charts of GLD (gold ETF), SLV (silver ETF), /GC (gold) and /SI (Silver) futures, all of which are poised to trigger breakouts above these downtrend lines, falling wedges, especially if confirm with a breakout in the comparable falling wedge pattern on the EUR/USD.
-
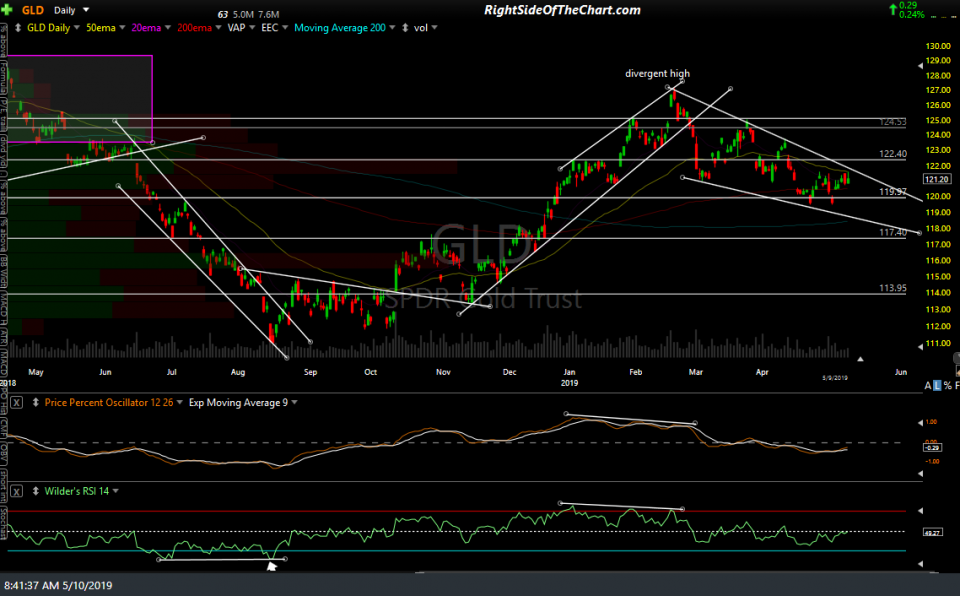
- GLD daily May 10th
-
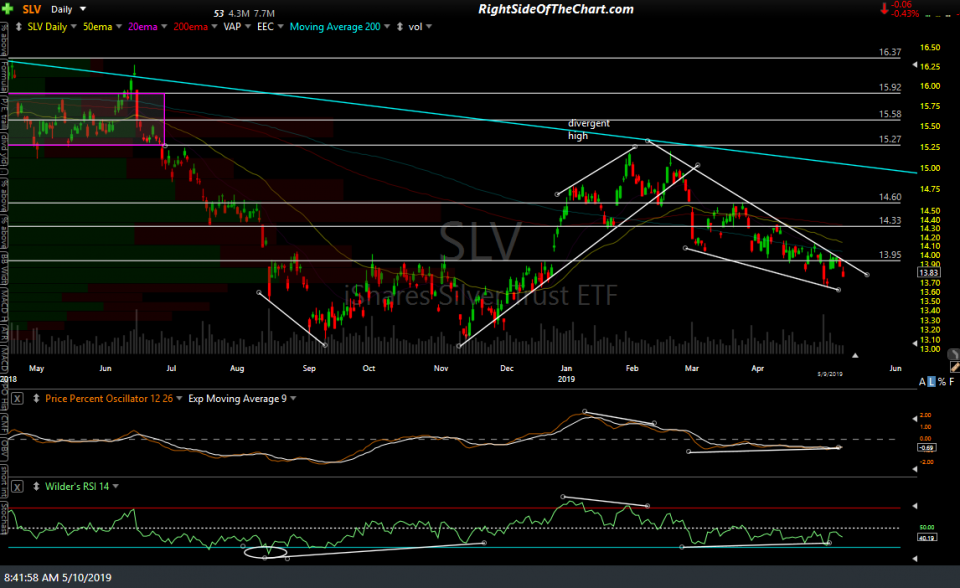
- SLV daily May 10th
-
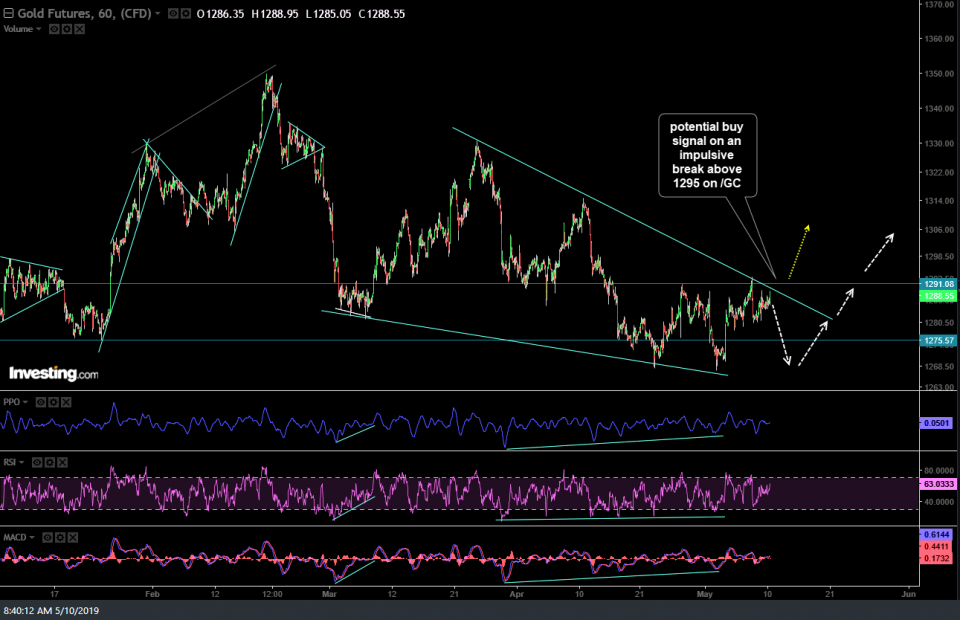
- GC 60-min May 10th
-

- SI 60-min May 10th