
I have to run out for an appointment today & will return to my desk later this morning. Until then, here are a few of the charts that I’m watching today. The next sell signal on QQQ will come on a solid break below this 60-minute bear flag pattern, ideally with a solid break below yesterday’s lows.
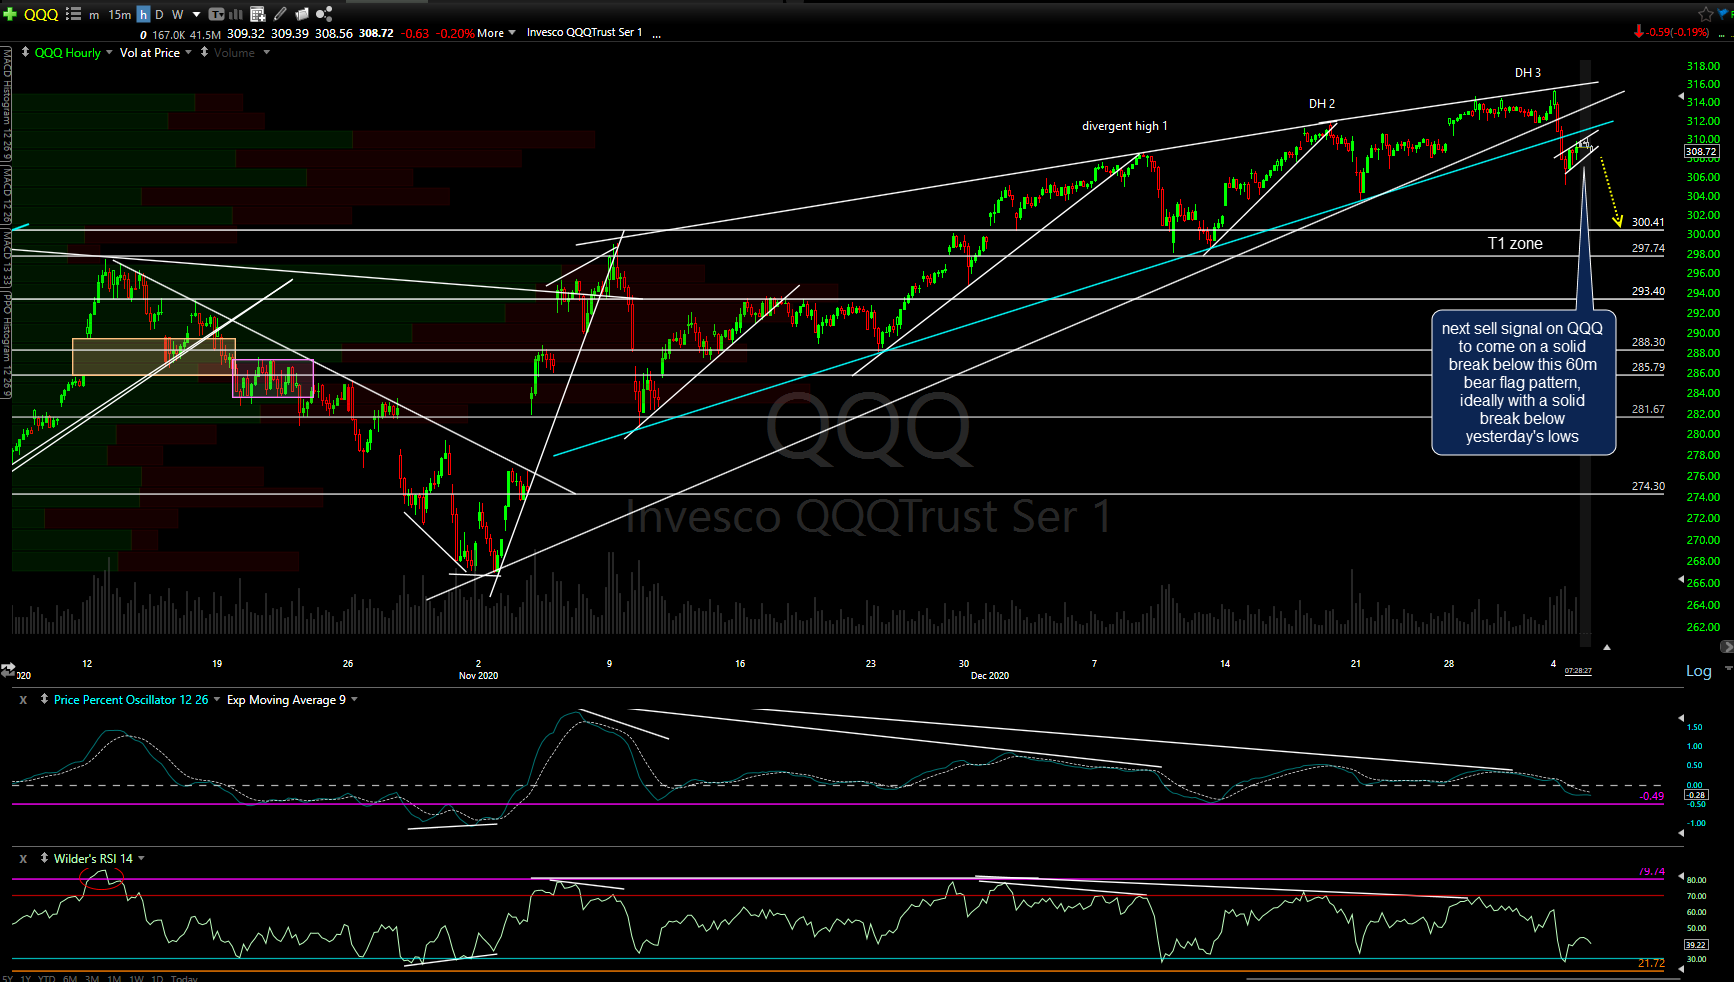
QQQ 60m Jan 5th
/NQ (Nasdaq 100 futures) remains below both uptrend lines but has snapped back up to the 12676ish support level. The next sell signal will come on a solid break below yesterday’s lows while a recovery back above both trendlines would be near-term bullish.

NQ 60m Jan 5th
A buy signal on /ZN (10-yr US Treasury Bond futures) to come on a solid break above this triangle pattern & the 138’082 resistance level just above. Should that occur (my preferred scenario), that would most likely coincide with a sell-off in equities although symmetrical triangle patterns can break either way. As such, a downside break of the pattern would likely align with a rally in equities, should yesterday’s breakdowns prove to be whipsaw (false) sell signals.
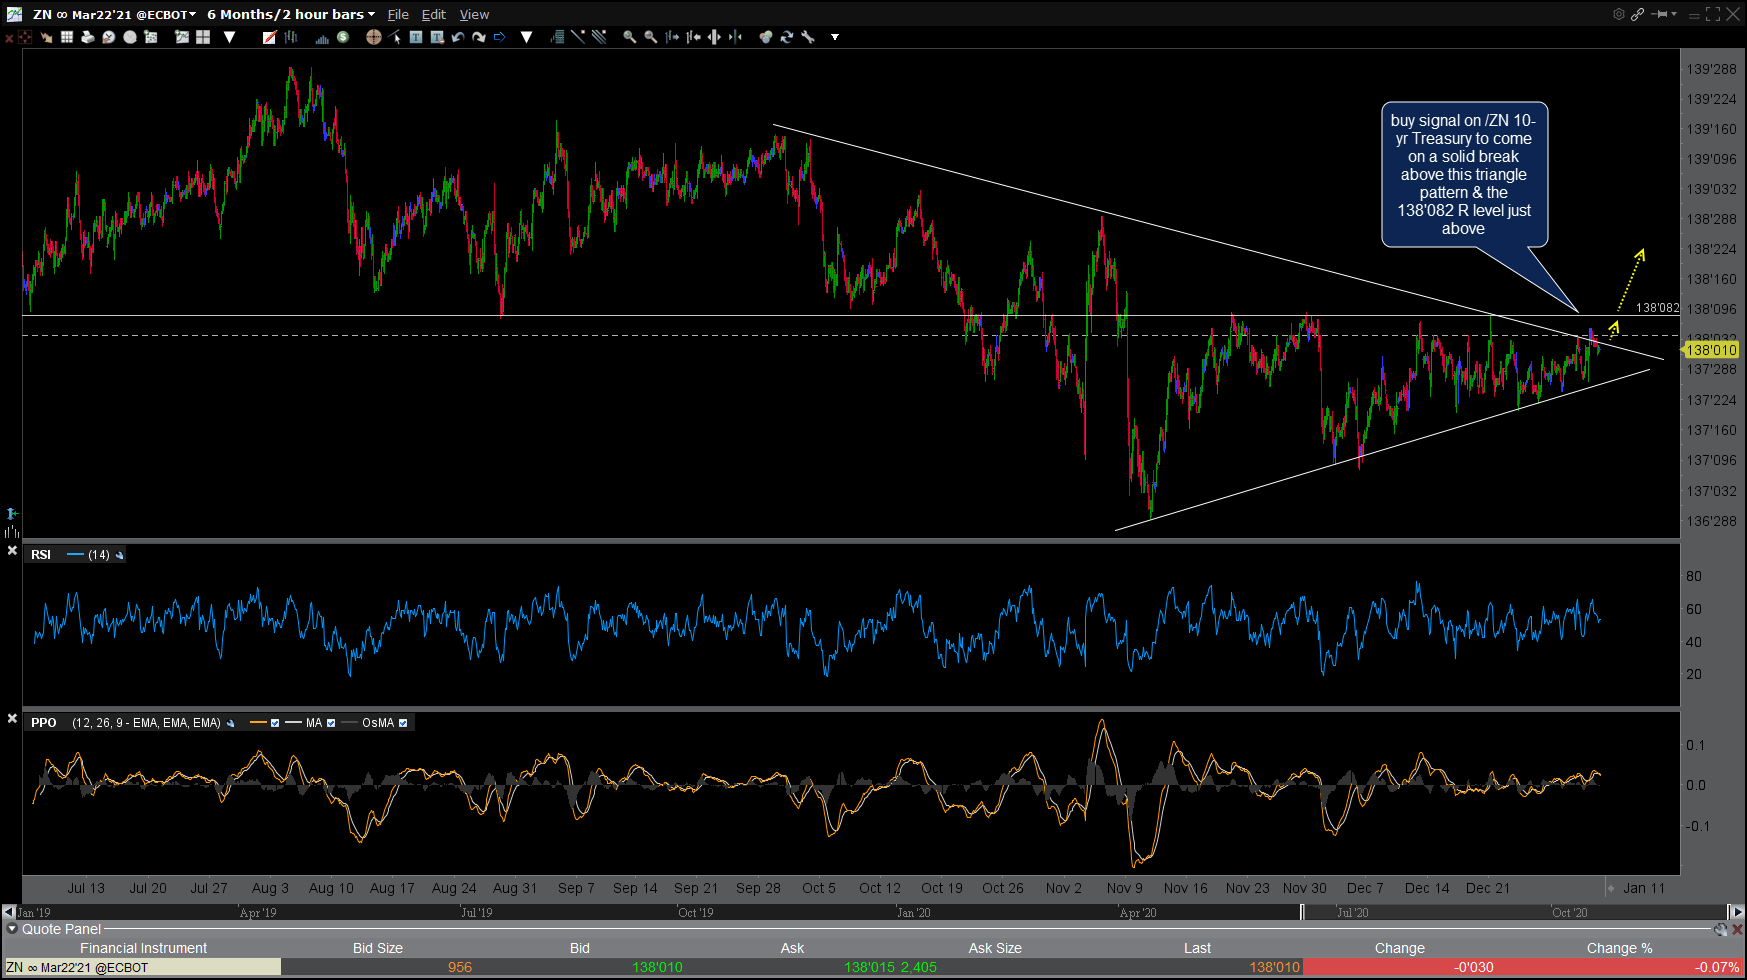
ZN 60m Dec 5th
/E7 (Euro futures) sell signal pending a solid break below the primary (blue) uptrend line on this 60-minute chart which would be bullish for the $USD & quite likely bearish for gold. As highlighted in yesterday’s video, the Euro has been positively correlated (rallying) with the stock market since the early November reaction lows in both with the US Dollar inversely correlated (falling) over the same time period.
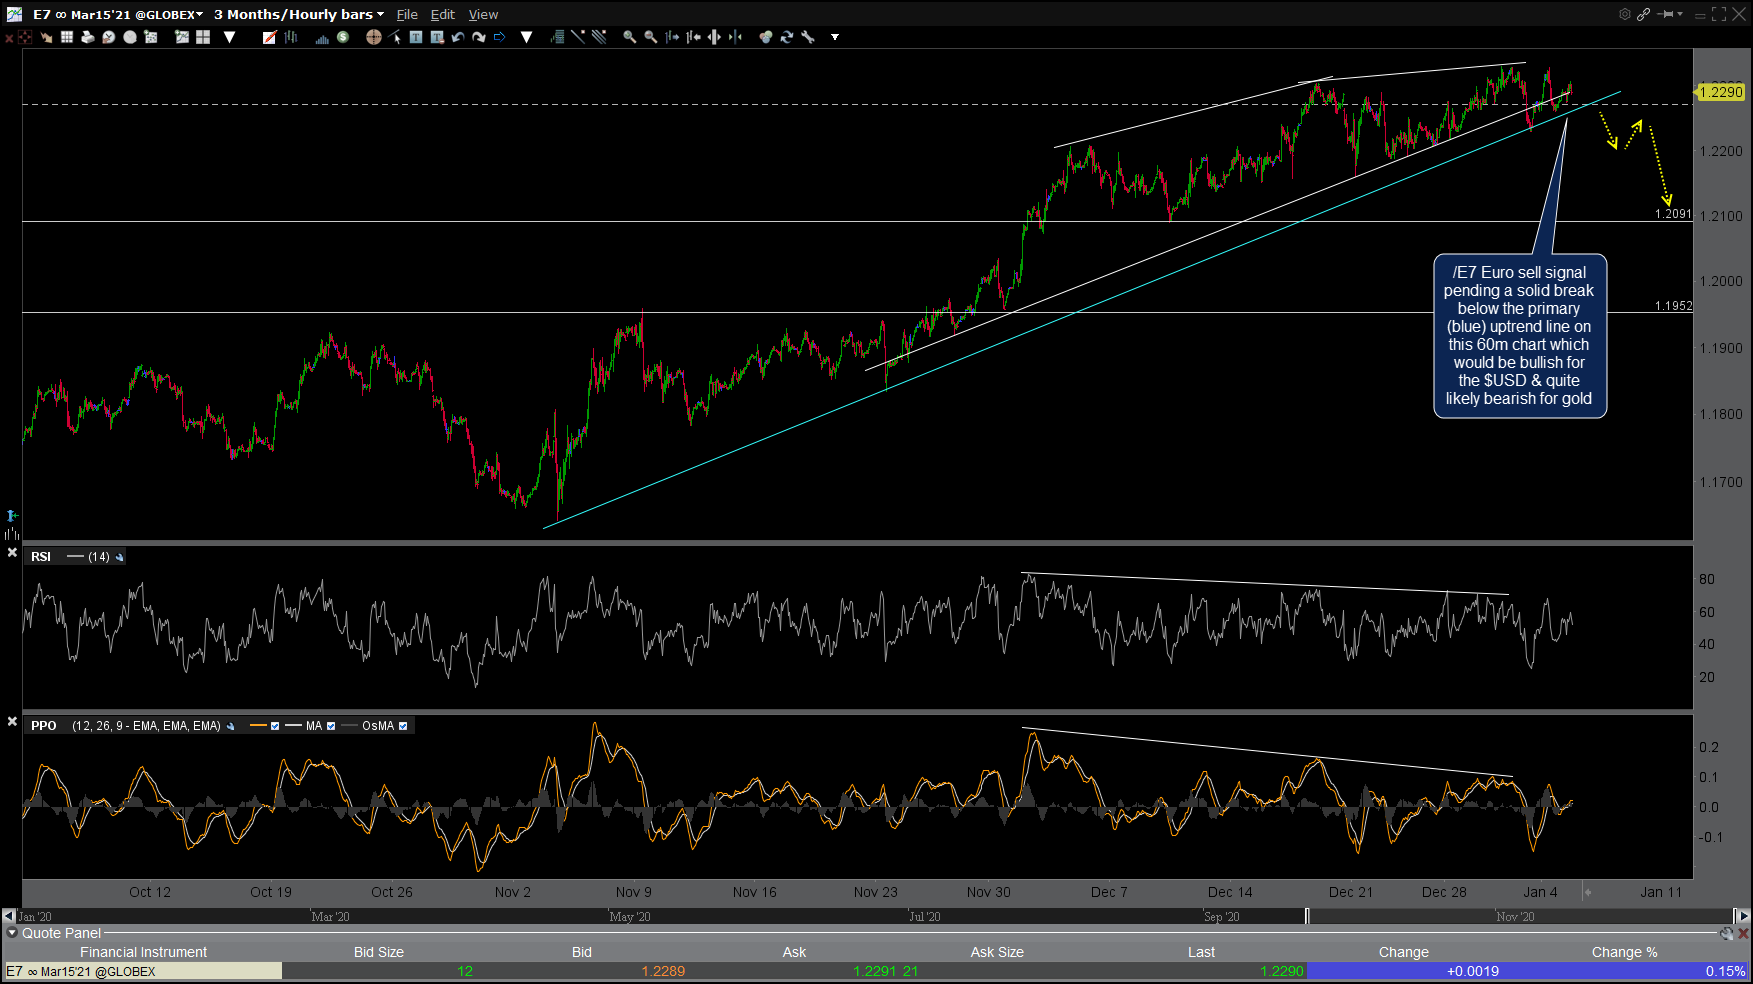
E7 60m Dec 5th
Bottom line: Yesterday’s sell signals in the major stock indices need to be confirmed with additional downside this week, including a solid break & close below yesterday’s lows. A breakout in Treasury bonds, as well as a breakdown in the Euro, would also help to support the case for a swing short trade on any of the major stock indices.