

Technical analysis & predictions on where some of the market-leading stocks scheduled to report earnings tonight & tomorrow are likely heading in the coming days to weeks.
YouTube link: https://youtu.be/Tsv-MxkZ4Q0
Here is the summary of the video analysis by Randy Phinney from Right Side of the Chart, featuring technical analysis, trade setups, and earnings predictions.
Video Overview & Market Context
In this update, Randy Phinney provides technical analysis on major index ETFs, key tech individual stocks, and broader market components ahead of peak earnings season.
-
00:00:01 — Introduction & Earnings Risk Overview: Discussion on the three core stages of an earnings report (the initial release/algo reaction, conference call guidance, and regular session price discovery) plus the broader follow-through over subsequent weeks.
-
00:06:39 — Invesco QQQ Trust (QQQ):
-
Summary: Day 3 of back-testing the bottom of a symmetrical triangle pattern.
-
Outlook: Offers an objective short entry on this back-test up to the top of the triangle. Rejection is expected, aligning with broader market bearishness.
-
Securities Analyzed
1. Tesla Inc. (TSLA)
-
Timestamp: 00:10:14
-
Outlook: Down (Confidence: Medium-Low)
-
Technical Analysis: Coming off a large multi-year divergent high on the daily/weekly charts. Price has slightly broken below a primary uptrend line dating back to 2019/2024. Buying vigor off support has been weakening.
-
Levels & Targets:
-
Objective Short: Current levels (slight breakdown below uptrend line).
-
Bullish Reversal Level: Daily close back above the uptrend line and triangle pattern.
-
2. Alphabet Inc. (GOOGL)
-
Timestamp: 00:23:41
-
Outlook: Down (Confidence: Medium)
-
Technical Analysis: Currently above its 200-day moving averages and primary uptrend line off April lows. However, the PPO indicator is in bearish territory, suggesting a deeper correction is pending despite clearing initial overbought conditions.
-
Levels & Targets:
-
Key Support Zone / Breakdown Level: $314 – $321 (confluence of price support, 200-day SMA/EMA, and primary uptrend line).
-
Downside Target: Needs a ~10% drop to break the $314 zone to confirm a larger ~15% market pullback.
-
3. ServiceNow, Inc. (NOW)
-
Timestamp: 00:29:36
-
Outlook: Neutral / Stand Aside
-
Technical Analysis: Recently hit its 200-day moving average resistance following a long-side trade recommendation from June 1st (which yielded a 40% profit near the $124 target & a 62% gain to the max. price target). Technical indicators are currently neutral in the middle zone.
4. International Business Machines Corp. (IBM)
-
Timestamp: 00:33:45
-
Outlook: Up (Active Long Position)
-
Technical Analysis: Bouncing off key support following a 25% single-day pre-announcement drop. Most negative news appears priced in.
-
Levels & Targets:
-
Stop Level: Suspended for earnings; reinstated on daily close below $208.82.
-
Price Targets: $234.78 (Target 1) and $243.00 (Target 2).
-
Execution Strategy: Proponent of using OCO (One-Cancels-the-Other) limit orders set to execute during extended-hours to catch earnings volatility.
-
5. Texas Instruments Incorporated (TXN)
-
Timestamp: 00:40:43
-
Outlook: Down (Confidence: Low)
-
Technical Analysis: Exhibiting a series of large divergent highs following a breakdown from a bearish rising wedge pattern.
-
Levels & Targets:
-
Support / Price Target 1: ~$274.90
-
Price Target 2: ~$259.85
-
Primary Downside Target: Gap-fill zone near $236.79.
-
6. United Rentals, Inc. (URI)
-
Timestamp: 00:44:57
-
Outlook: Down (Confidence: Fair)
-
Technical Analysis: Formed a textbook bearish rising wedge pattern and recently broke down, currently back-testing a former all-time high breakout level.
-
Levels & Targets:
-
Support Target 1: $907.85
-
Support Target 2: $882.39
-
Major Trendline Support: Primary uptrend line from 2022 lows.
-
7. Nokia Corporation (NOK)
-
Timestamp: 00:47:17
-
Outlook: Neutral (Oversold)
-
Technical Analysis: Already dropped ~44% from its divergent high and hit its 200-day moving average. Too oversold to call down further, but awaiting clearer buy signals before entering.
List of Ticker Symbols
QQQ, TSLA, GOOGL, GOOG, NOW, IBM, TXN, URI, NOK
For reference, were are the charts that were posted on the previous long swing trade on NOW, which was covered in the video above, highlighting the near perfect entry (just off the key March bottom, with the NOW going on to hit my 136.50 & intersecting 200-day MA’s “maximum price target” for a 62% profit from the March entry, and literally topping & immediately reversing (-36%) from there.
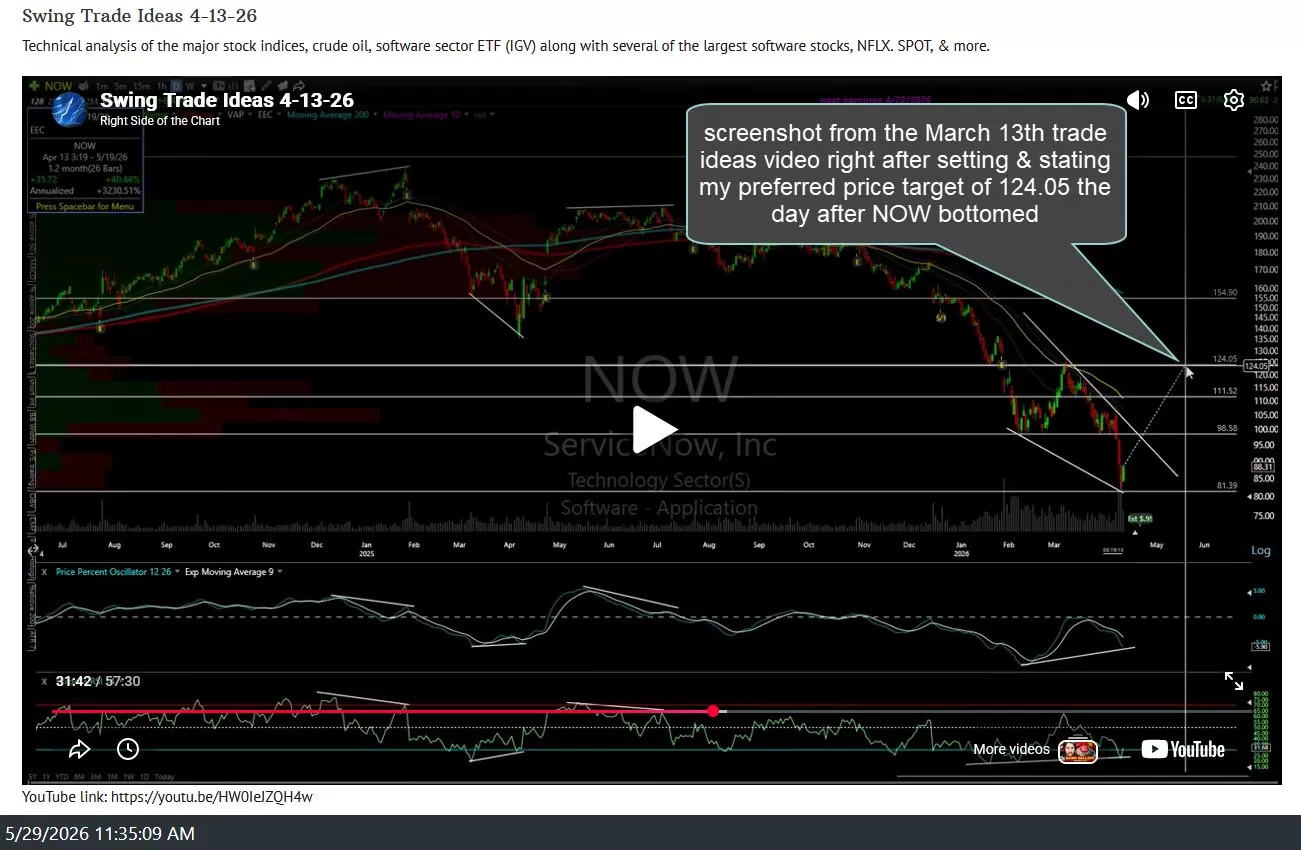
NOW April 13 video screenshot
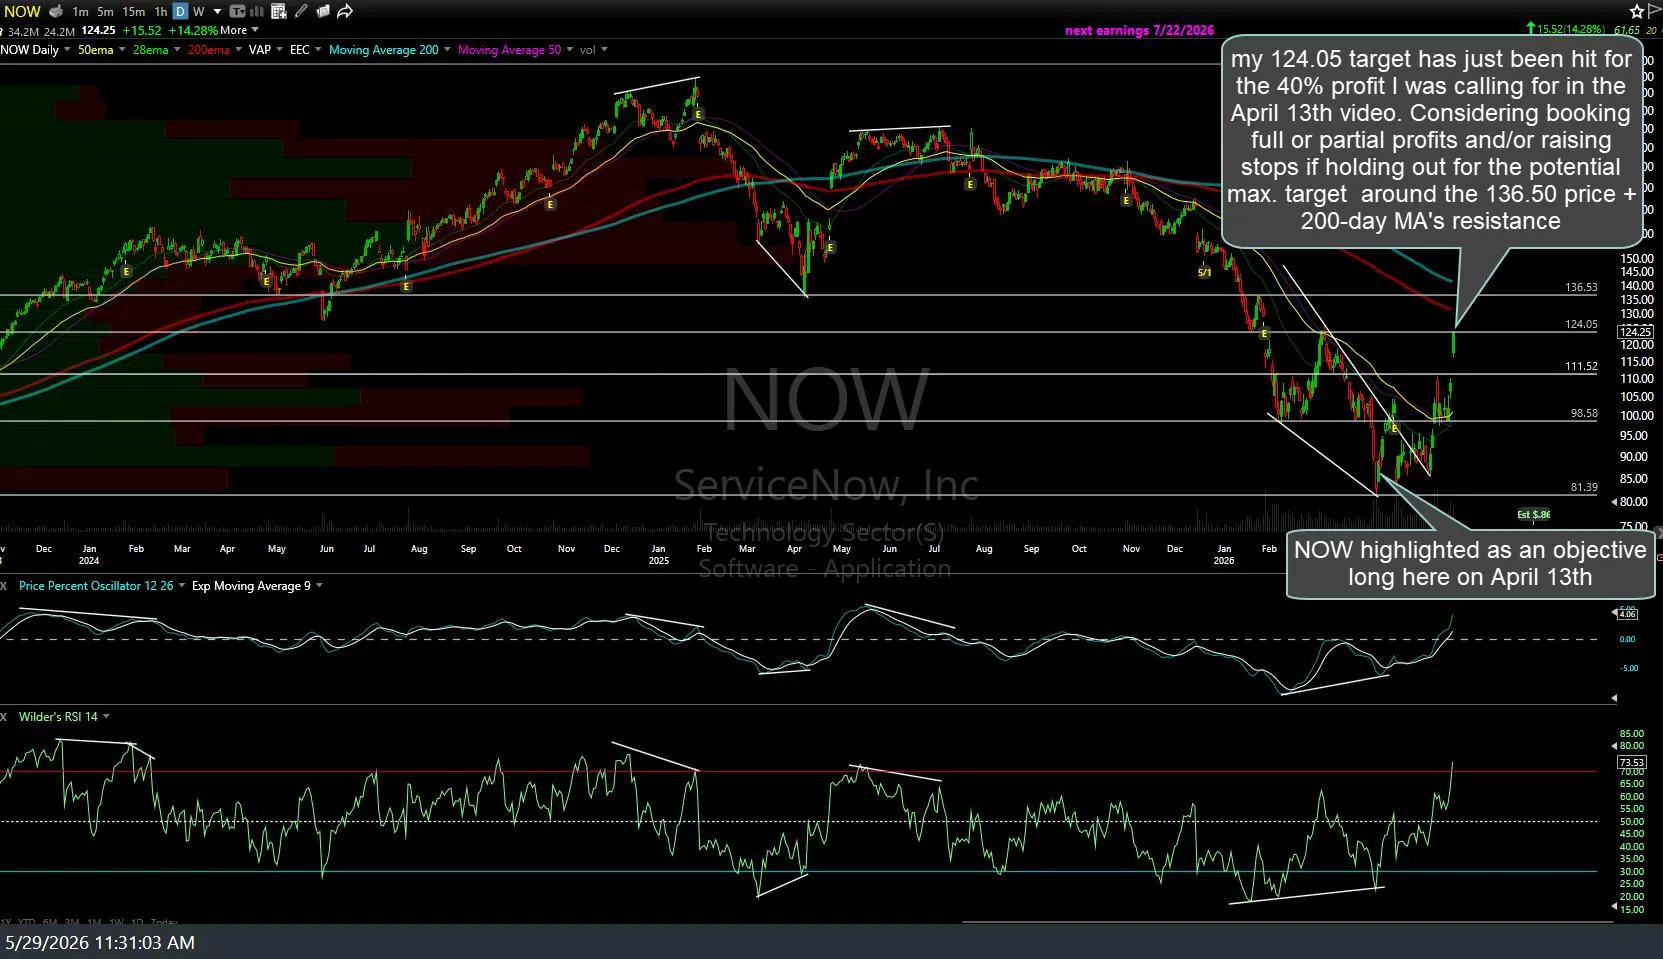
NOW-daily-May-29th
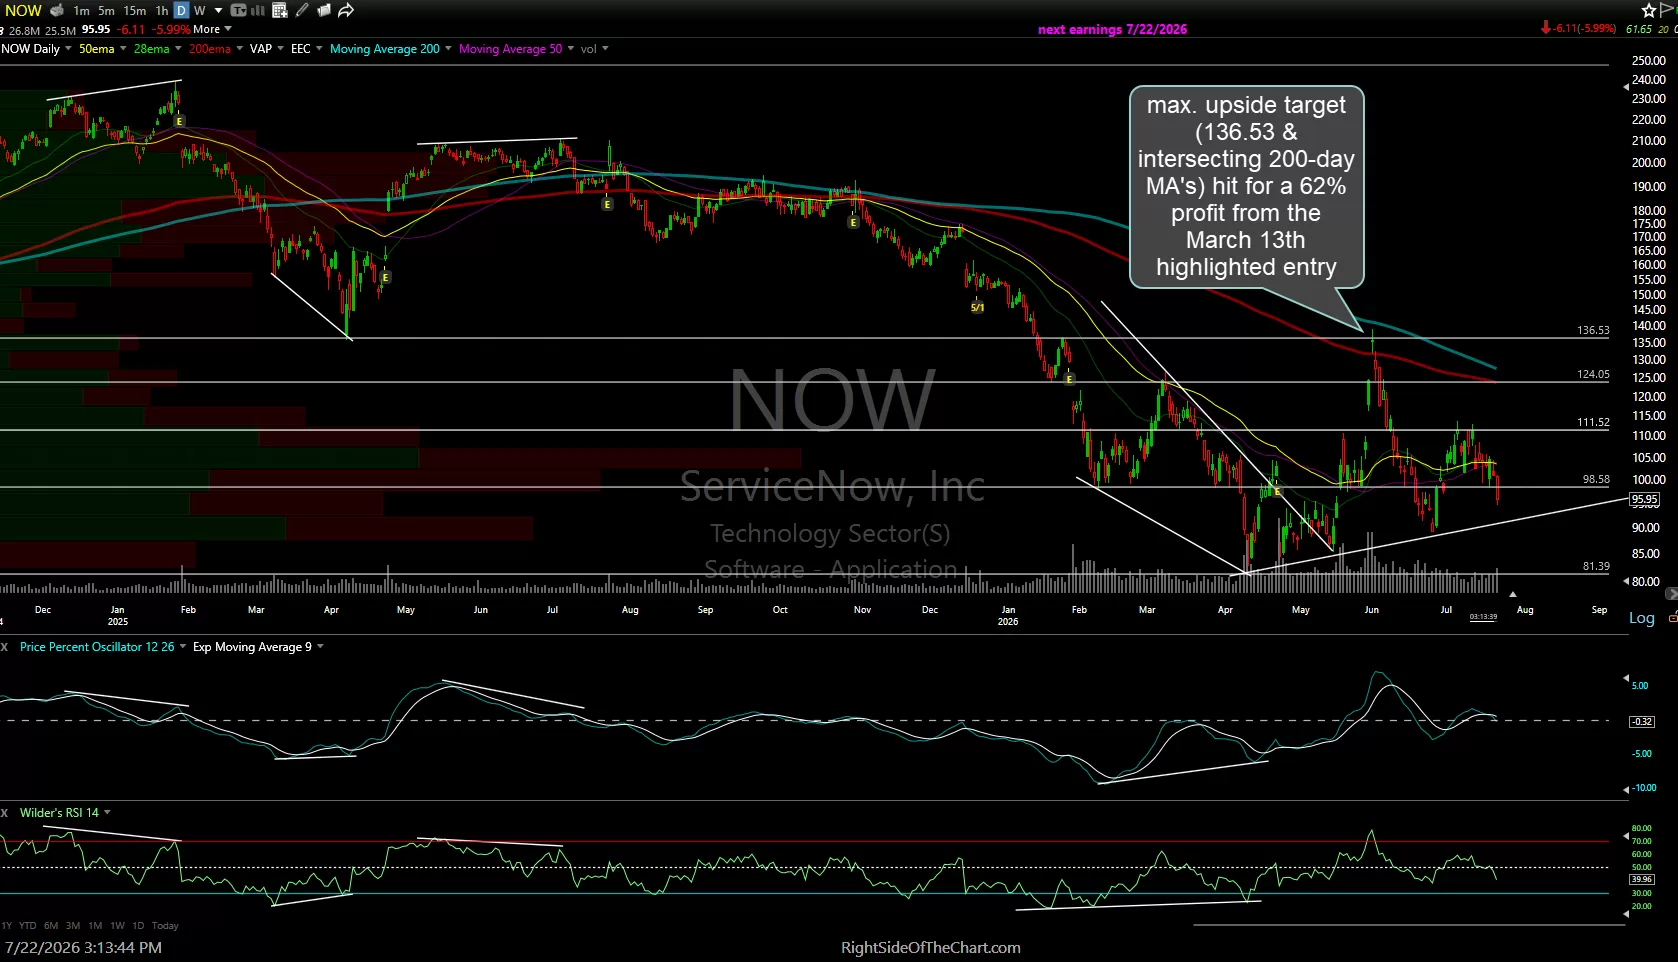
NOW daily July 22nd