
The potential divergences on the 15-minute time frame highlighted earlier today were confirmed with a late session rally that saw QQQ rise 1.35% before falling back slightly but still closing off the lows. Should these divergences continue to play out this week, my expectation would be for a rally of about 3.4% – 4% & possibly more, before any meaningful pullback.
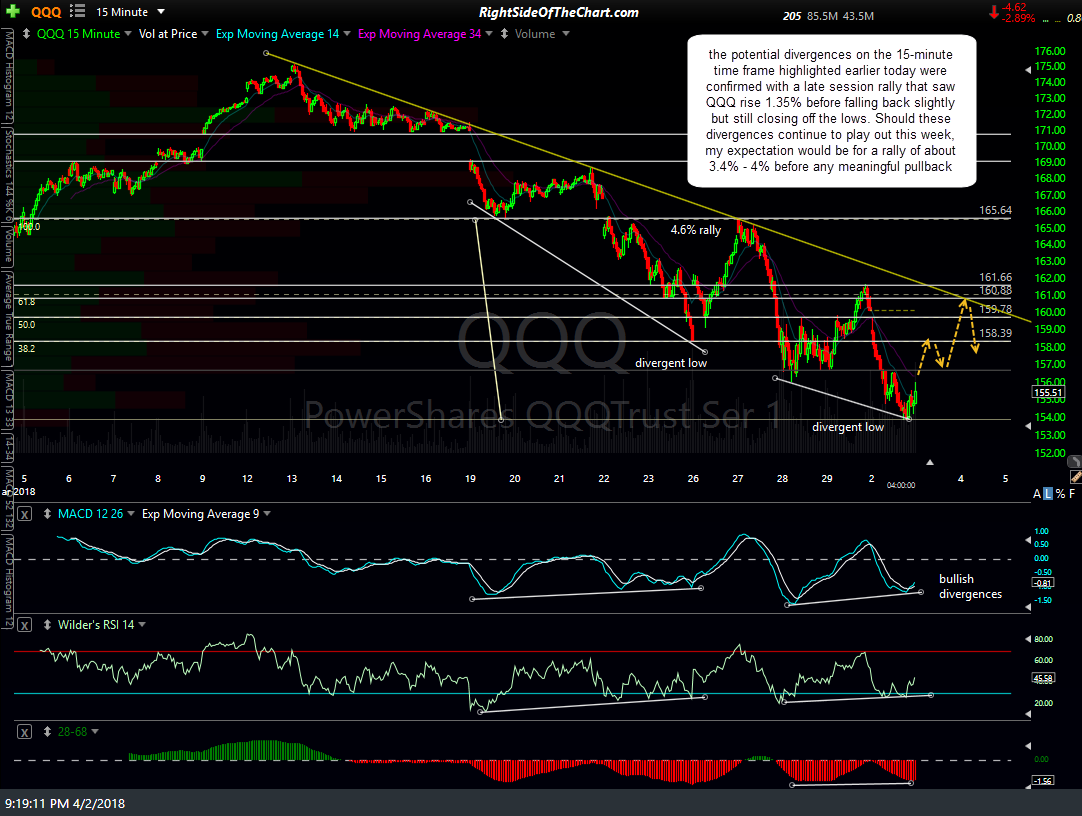
QQQ 15-min 3 April 2nd
Should QQQ gap up substantially at the open tomorrow, this potential bullish divergences that were also highlighted on this 60-minute time frame early today will be confirmed, opening the door for a rally back up to the 158.21ish R level & possibly the 161.66 area by the end of this week.
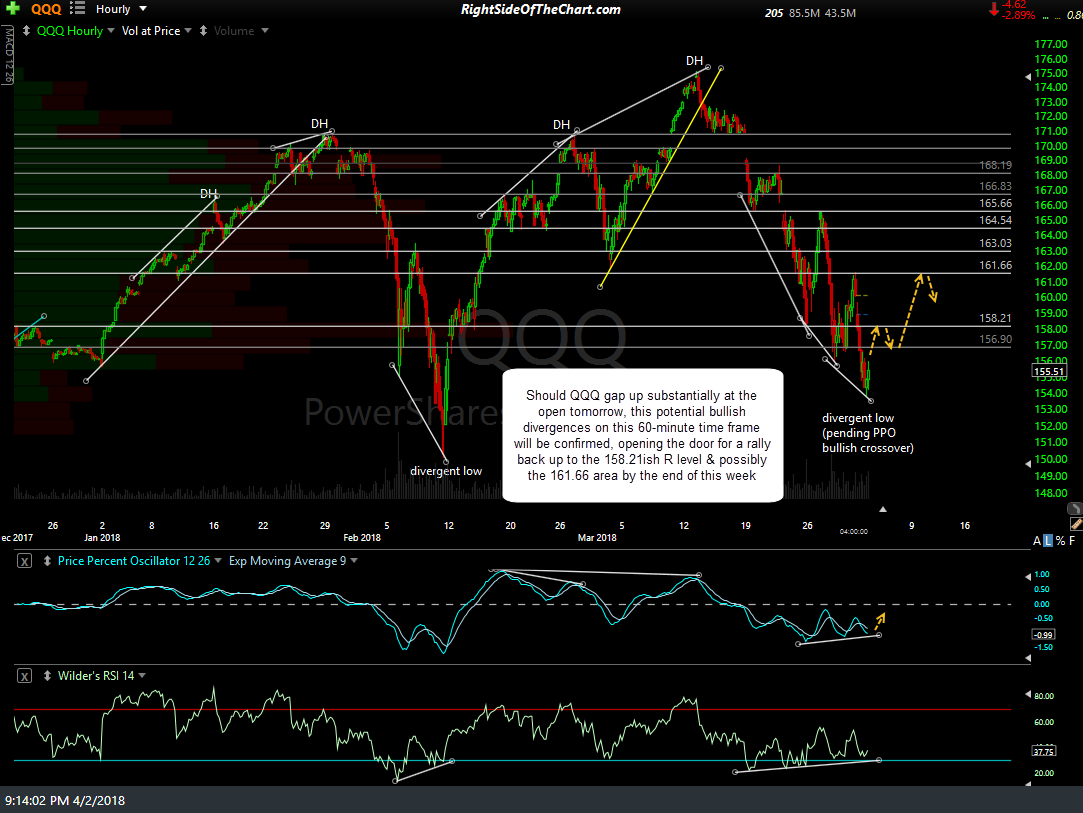
QQQ 60-min 3 April 2nd
I don’t want to sugar coat things here as not only the tech heavy Nasdaq 100 but also the broad market including most of the eleven sectors within the S&P 500 have been inflicted with some significant technical damage recently. However, with the longer-term trend indicators still bullish (nearly all near-term & intermediate-term trends are bearish), one can’t write off this market nor the market leading tech giants like Apple, Microsoft & Alphabet, just yet. AAPL reversed just above support with potential bullish divergences building on this 60-minute time frame which could be the catalyst for a rally back up to the 172- 175 level.
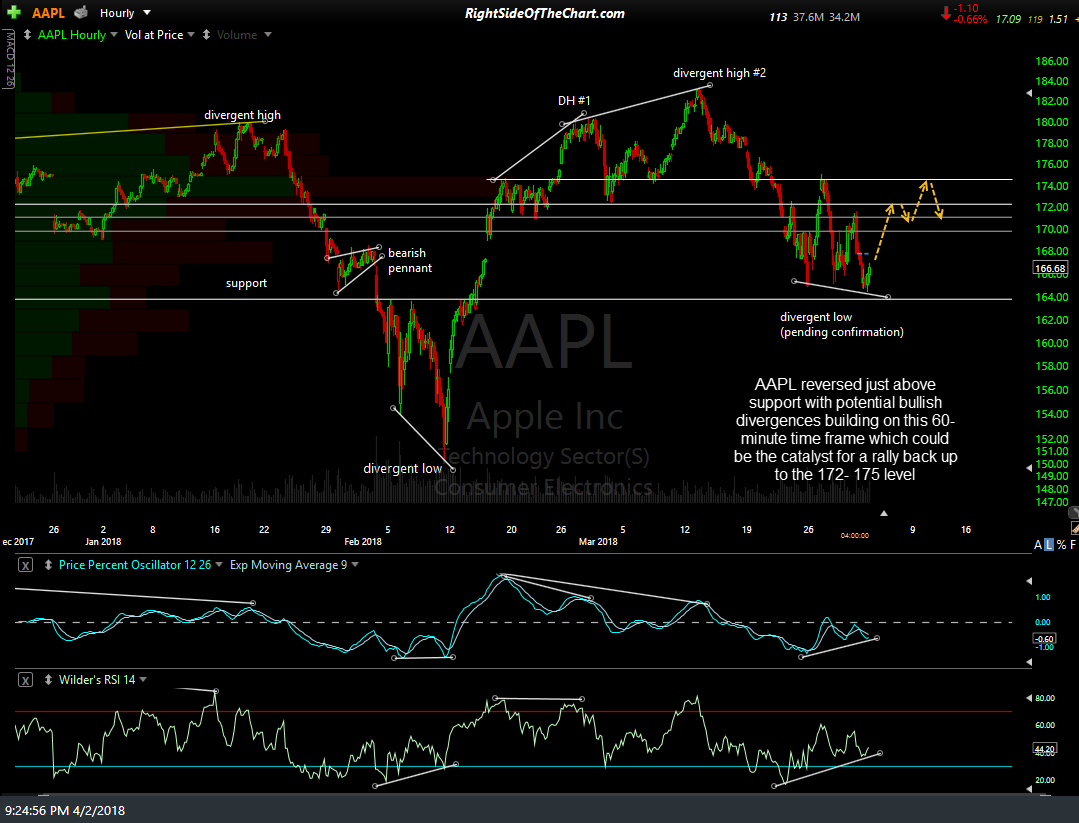
AAPL 60-min April 2nd
While the double negative divergence at the recent highs in MSFT indicates that more downside is likely in the coming weeks to months, MSFT is still above trendline support on this daily time frame for now & could mount one last rally before breaking below trend. Whether it happens tomorrow, next week or months from now, a break & solid daily close above this uptrend line would be bearish & trigger the next sell signal on this market leading stock.

MSFT daily April 2nd
GOOGL (Alphabet Inc. Class A) managed another stick save to close back above the bottom of the 1006.50-1017 support zone today with positive divergence on the RSI. Should the market rally tomorrow (my preferred scenario), look for a backtest of the primary trendline from below. Should the market continue to move sharply lower this week, GOOGL will likely continue down to the 895 – 920 support zone before any meaningful counter-trend rally.
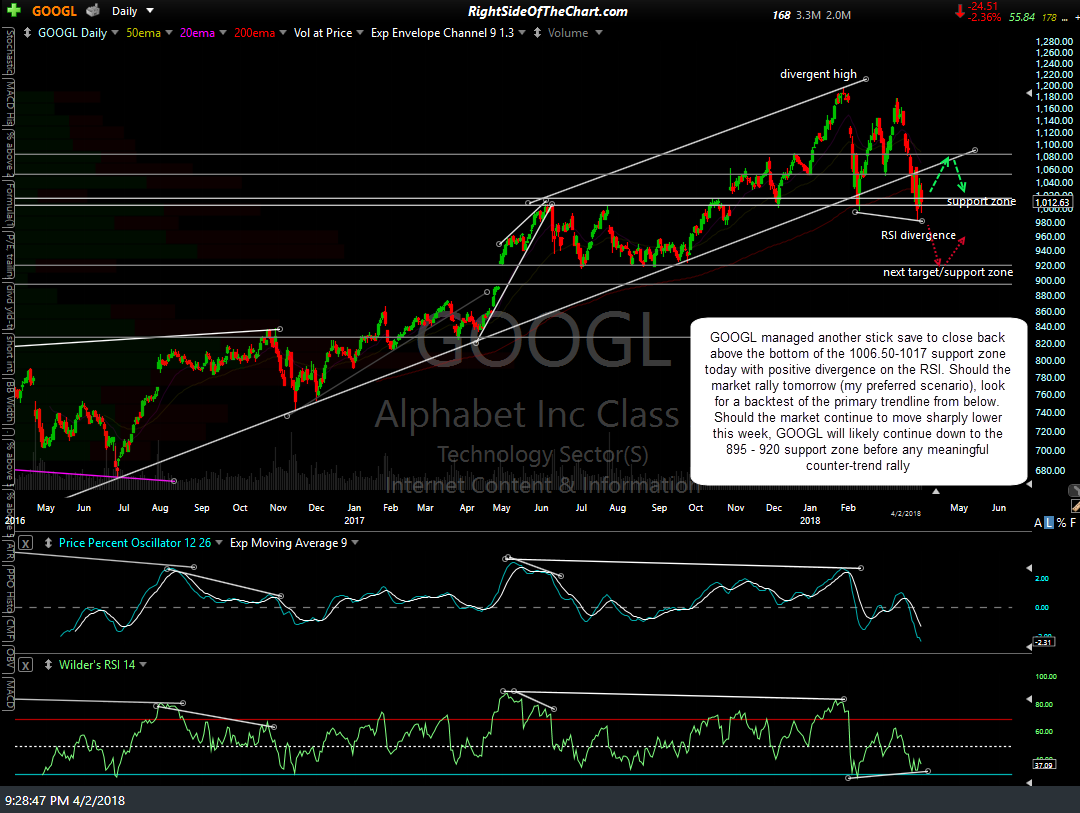
GOOGL daily April 2nd
One other significant technical development worth noting today was the extreme spike in the CBOE options total put-to-call ratio ($CPC). The Put/Call Ratio is an indicator that shows put volume relative to call volume. Put options are used to hedge against market weakness or bet on a decline. Call options are used to hedge against market strength or bet on an advance. The total put-call ratio is the ratio of all index & stock put options vs. call options. As with any other sentiment indicate, I find little predictive values when the P/C ratio is within the upper & lower ends of its historical range but just as other sentiment indicators, such as the AAII Bull/Bear ratio & the University of Michigan market sentiment survey, both of which were indicating extreme bullish sentiment in late January just before the broad market topped, I find them to be very useful in predicting potential tops & bottoms in the market when at rarely seen extreme levels.
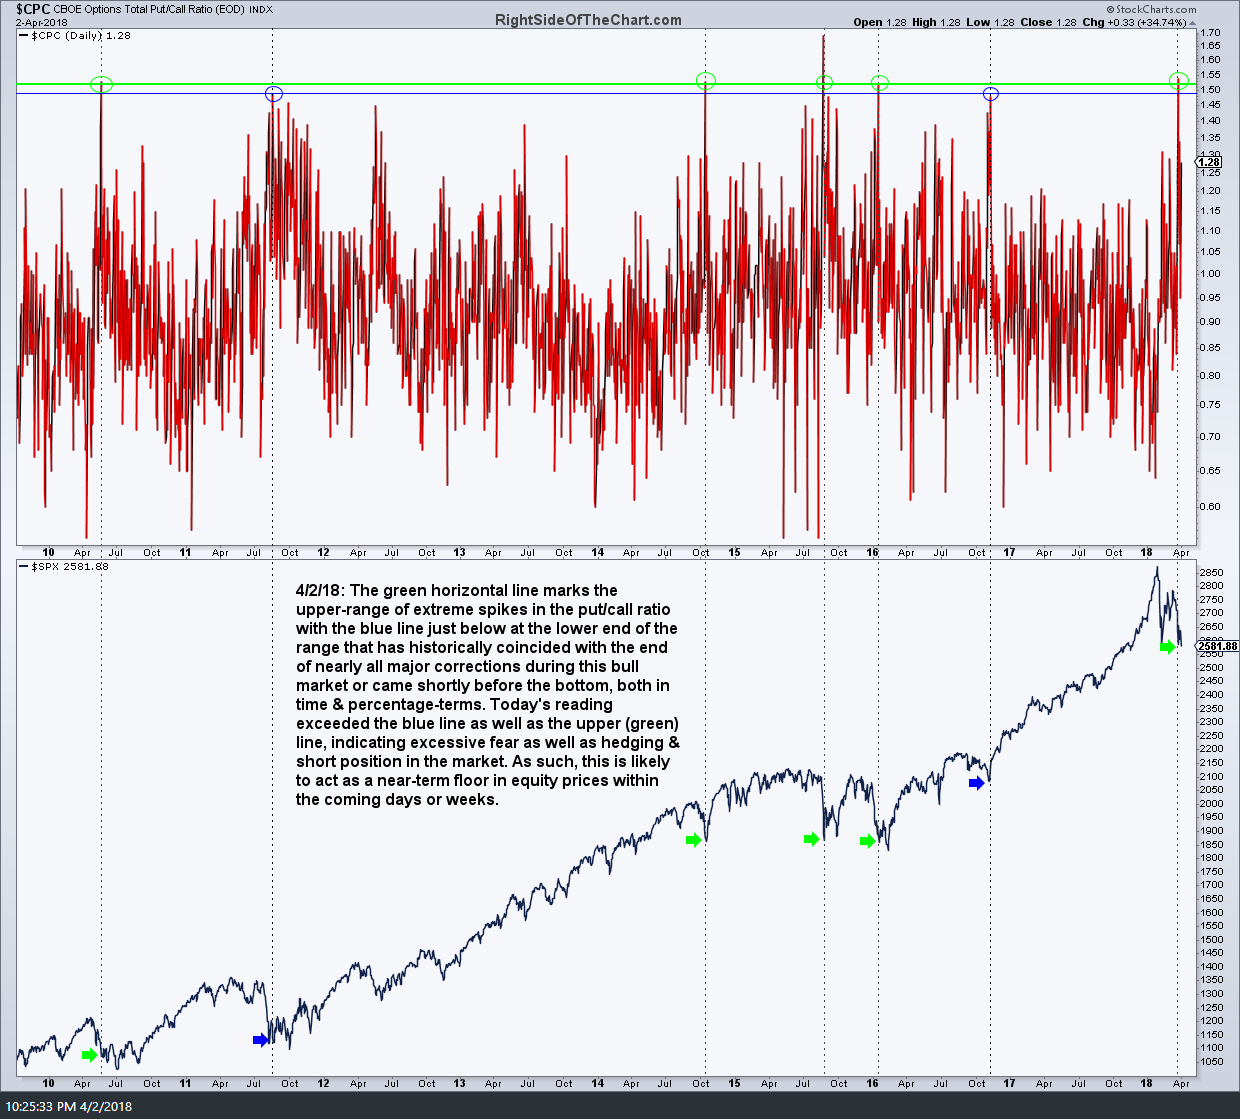
$CPC daily April 2nd
In the chart above, the green horizontal line in the chart on top ($CPC) marks the upper-range of extreme spikes in the put/call ratio with the blue line just below at the lower end of the range that has historically coincided with the end of nearly all major corrections during this bull market or came shortly before the bottom, both in time & percentage-terms. Today’s reading exceeded the blue line as well as the upper (green) line, indicating excessive fear as well as hedging & short position in the market. As such, despite the increasingly bearish technical posture of the major US stock indices, this is likely to act as a near-term floor in equity prices within the coming days or weeks, even if we see a little more (~5%) downside first.