
According to the University of Michigan’s survey, 66% of Americans believe that the stock market will continue to climb over the next year, the most optimistic reading in the history of that survey. Note the date & subsequent performance of the stock market following the two previous extreme readings. The chart below only shows the percentage of households expecting the stock market to rise over the next year, the S&P 500 is not plotted although the performance figures following the previous extreme readings are listed.
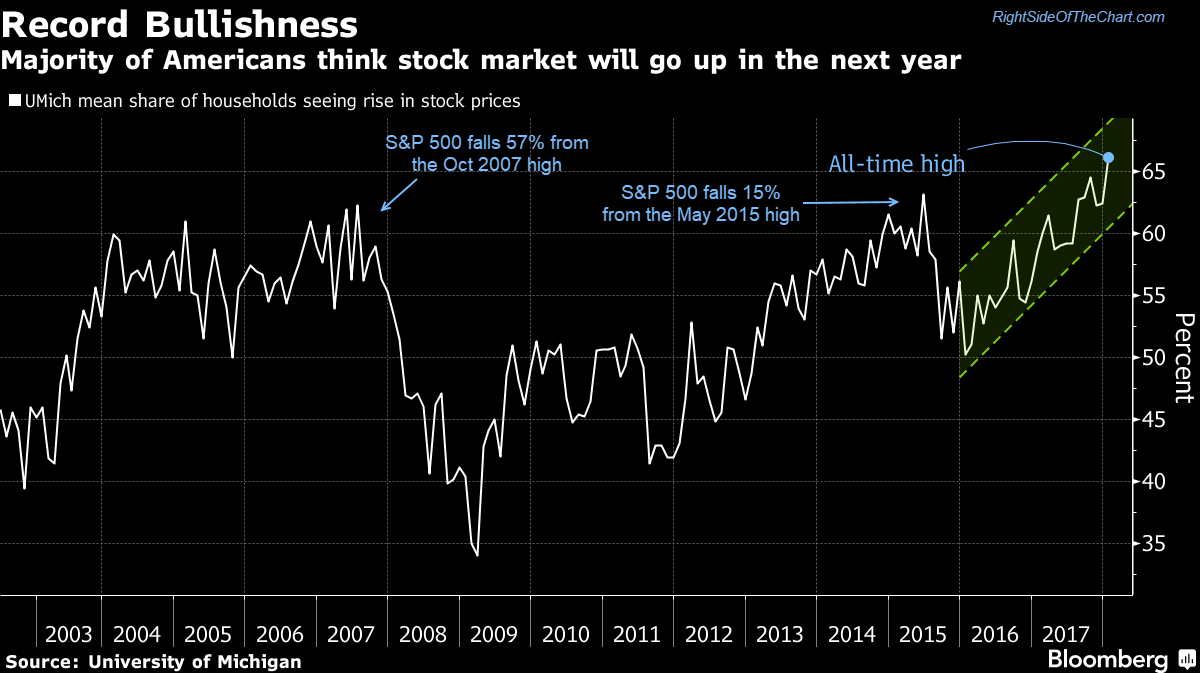
UM Sentiment Survey
I also monitor the AAII (American Association of Individual Investors) sentiment survey for extreme readings into what I refer to as the ‘red zone’. The bars on this chart show the spread between bullish & bearish market participants. Extreme sentiment readings are considered contrary indicators as once an overwhelming numbers of market participants are bullish, there is nobody left (metaphorically speaking) to buy stocks as the majority of market participants are fully invested. Vice versa during periods of extreme bearish sentiment as many investors have thrown in the towel following a downtrend, leaving few potential sellers at that point with a lot of potential buyers (sitting in cash, bonds, etc..). This recent extreme AAII bullish sentiment reading was only matched by that preceding the ~22% drop in the S&P 500 back in 2011.
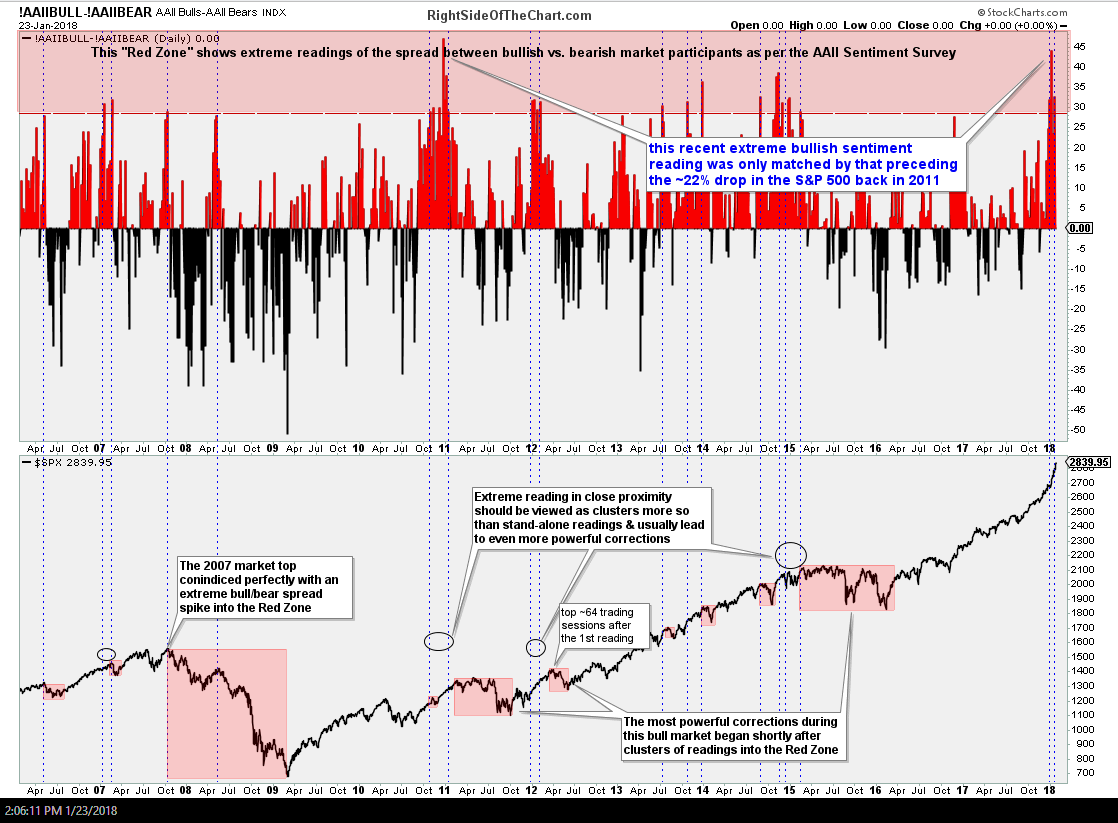
AAII bull-bear spread 1-23-18
I incorporate sentiment extremes into my analysis the same way that I factor on overbought & oversold conditions; they are not buy (or sell) signals, merely an indication that the current trend has most likely gotten ahead of itself and the risk for a correction (or rally) is elevated. I will then look for early signs of a potential trend change such as bearish (or bullish) divergences, buying (or selling) climaxes, candlestick reversal patterns, breakouts below (or above) trendlines & other key support (or resistance levels). Whether those sell signals come in the new few days, weeks or months, it is hard to argue from looking at the charts above that the risk of a substantial correction is building at this time. As such, I’ll continue to closely monitor the 60-minute charts for any early signs of a potential trend reversal while also keeping an eye on the more significant daily & weekly time frames.