
AMZN (Amazon.com Inc.) will trigger a buy signal on a break above this 60-minute bullish falling wedge pattern.
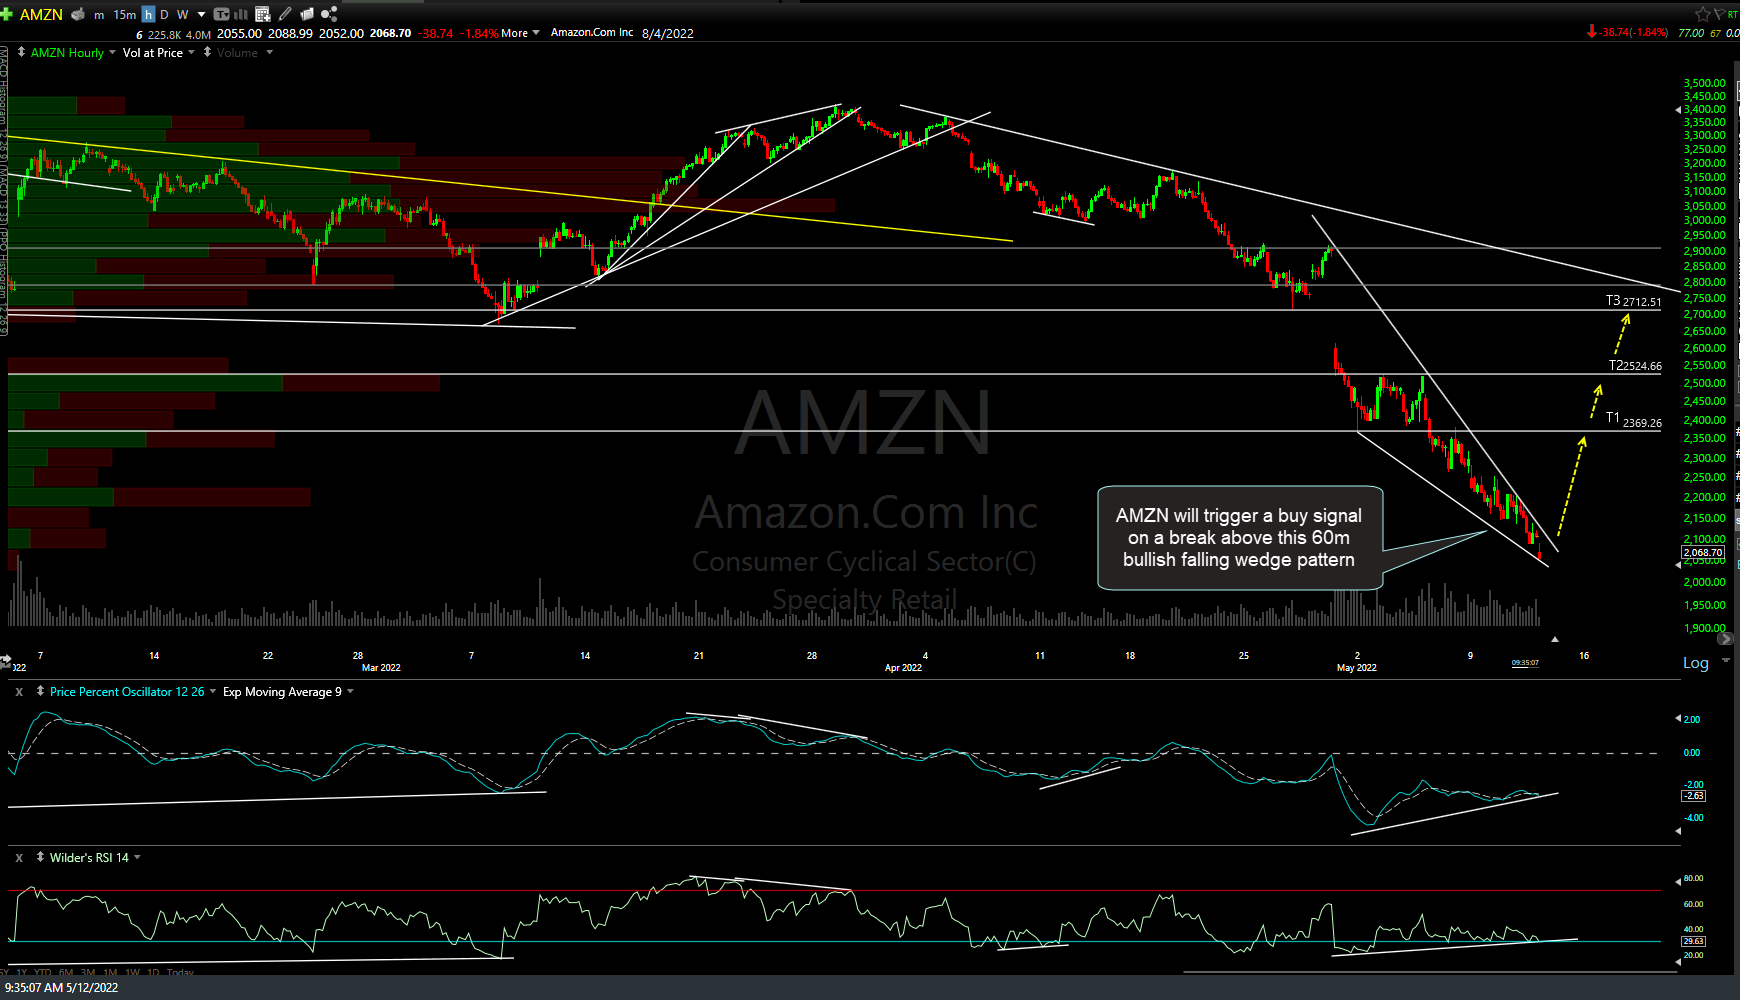
AMZN 60m May 12th
If willing to give the stock a little room in case we get a momentum-fueled overshoot of support, a case can also be made for an objective long entry here at key support on the weekly chart. AMZN has just hit my final target first posted back on Feb 3rd & 4th. As such, this is an objective time to book full profits on a swing/trend short and/or reverse/open a swing long position. Potential trend bounce target is the 2690ish resistance (former key support) with the near-term bounce targets on the 60-minute chart above. Feb 3rd, 4th, & updated weekly chart below.
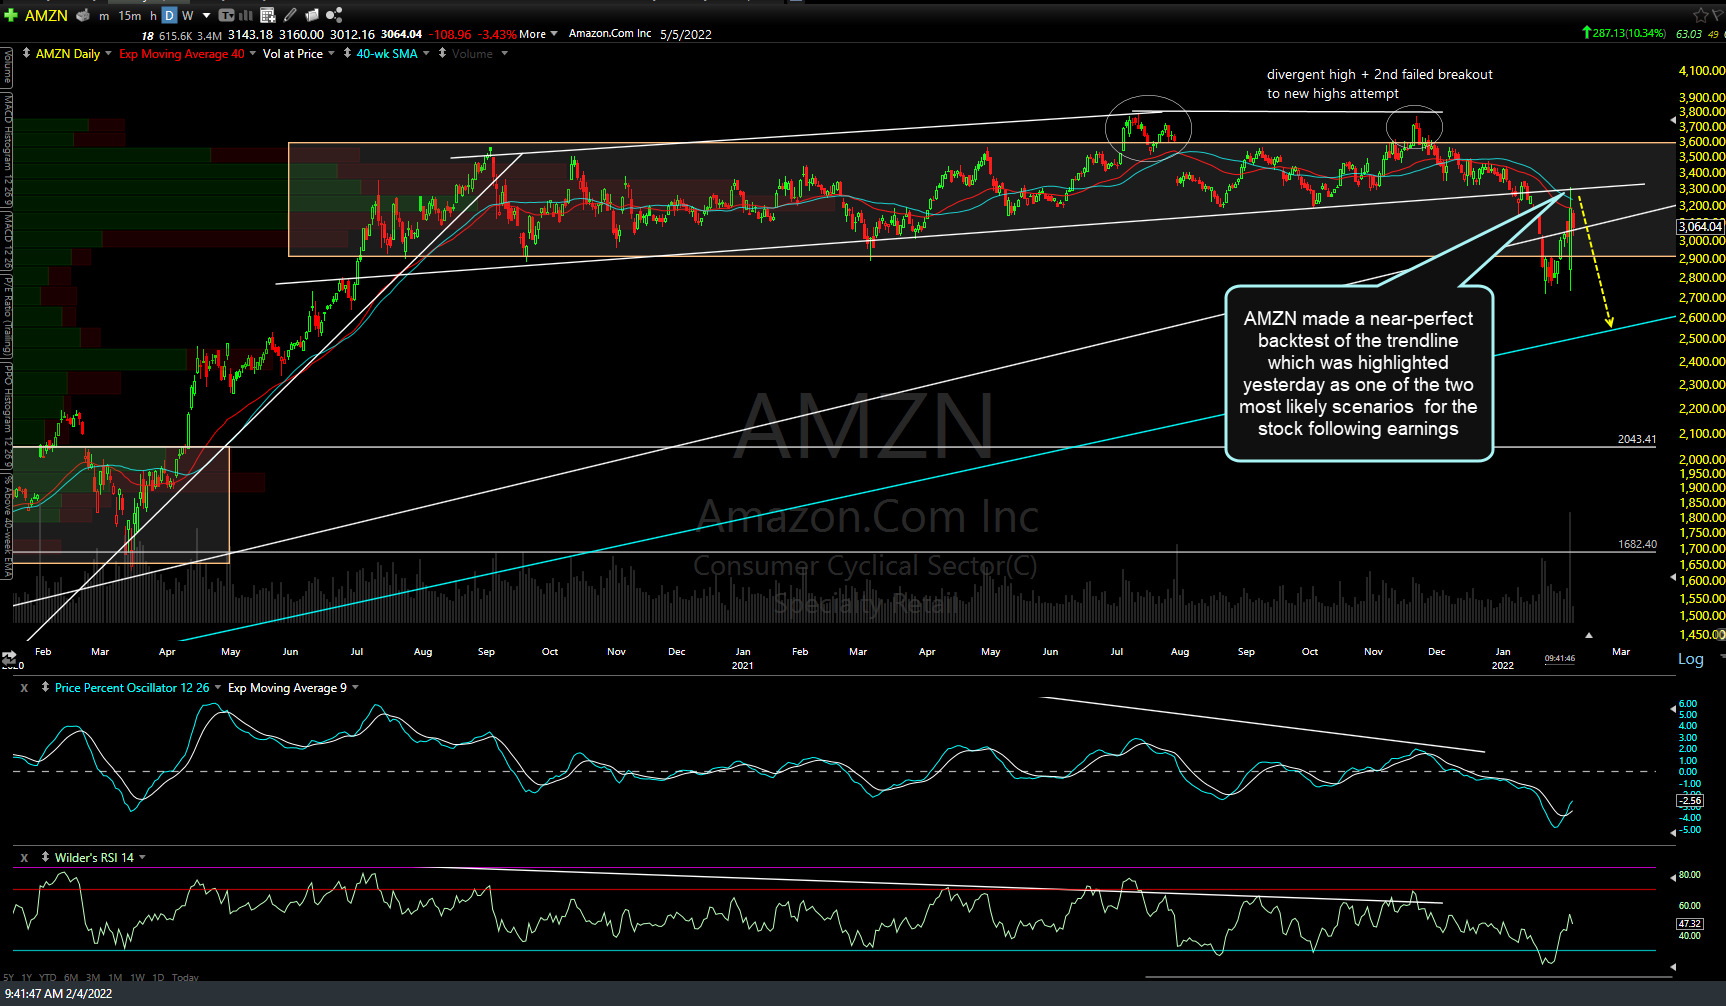
AMZN weekly Feb 4th
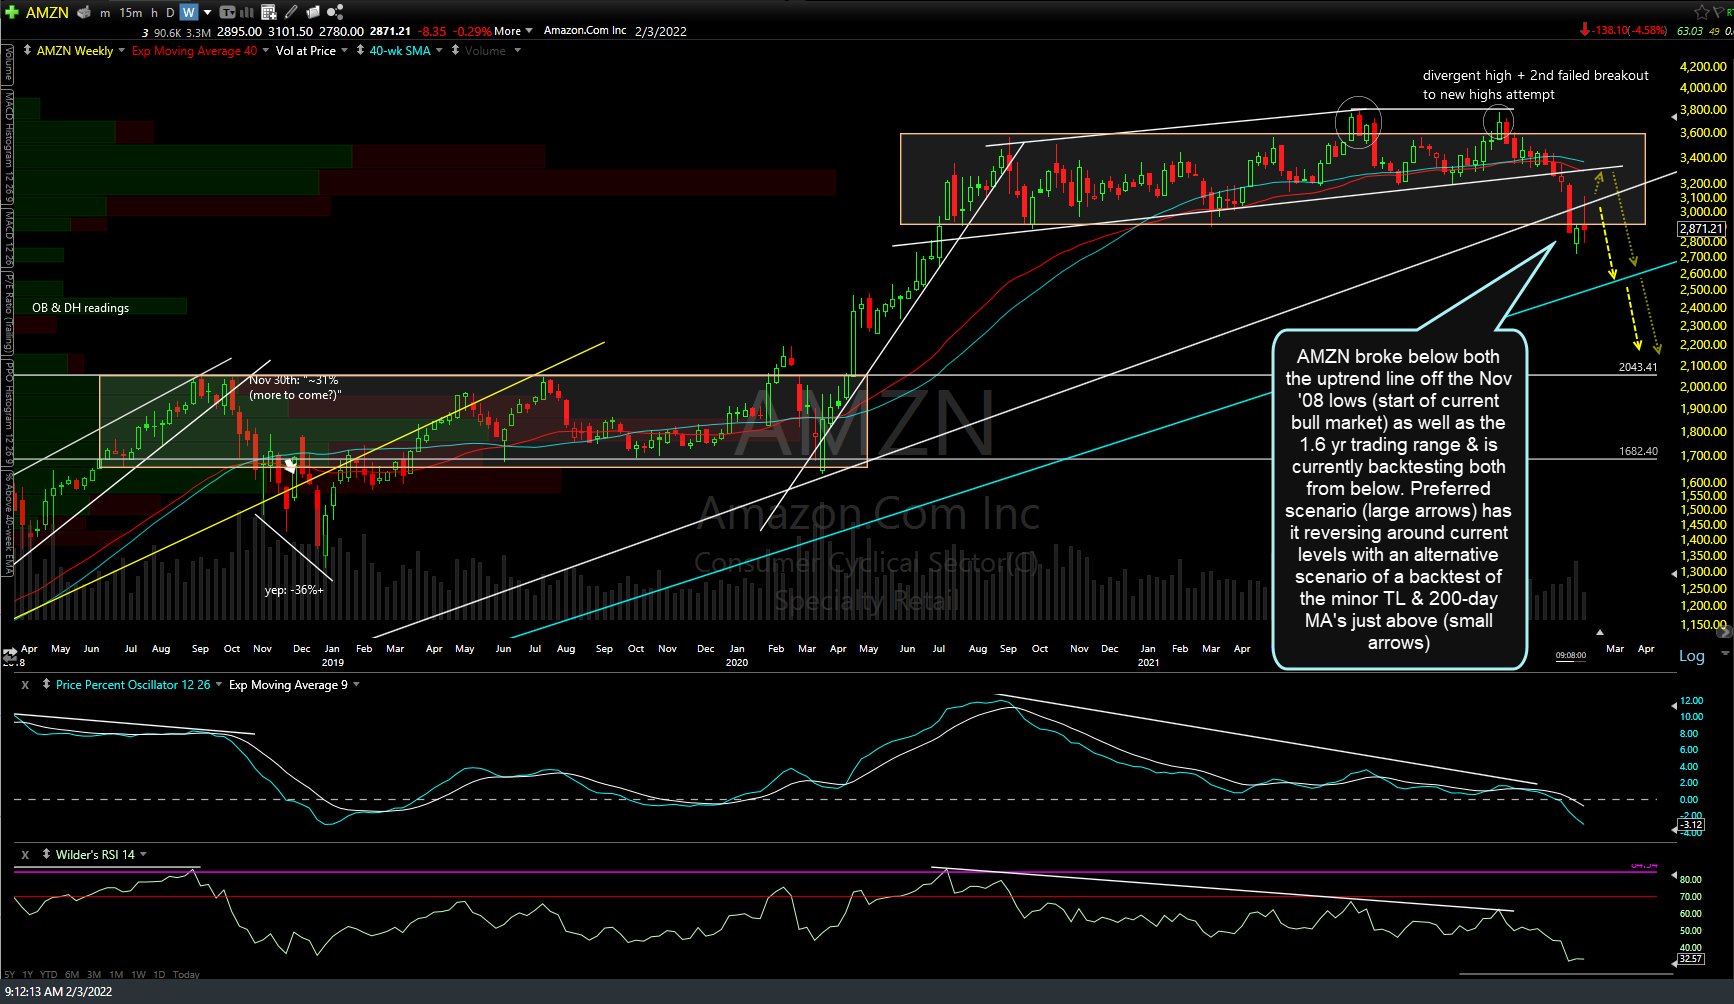
AMZN weekly 3 Feb 3rd
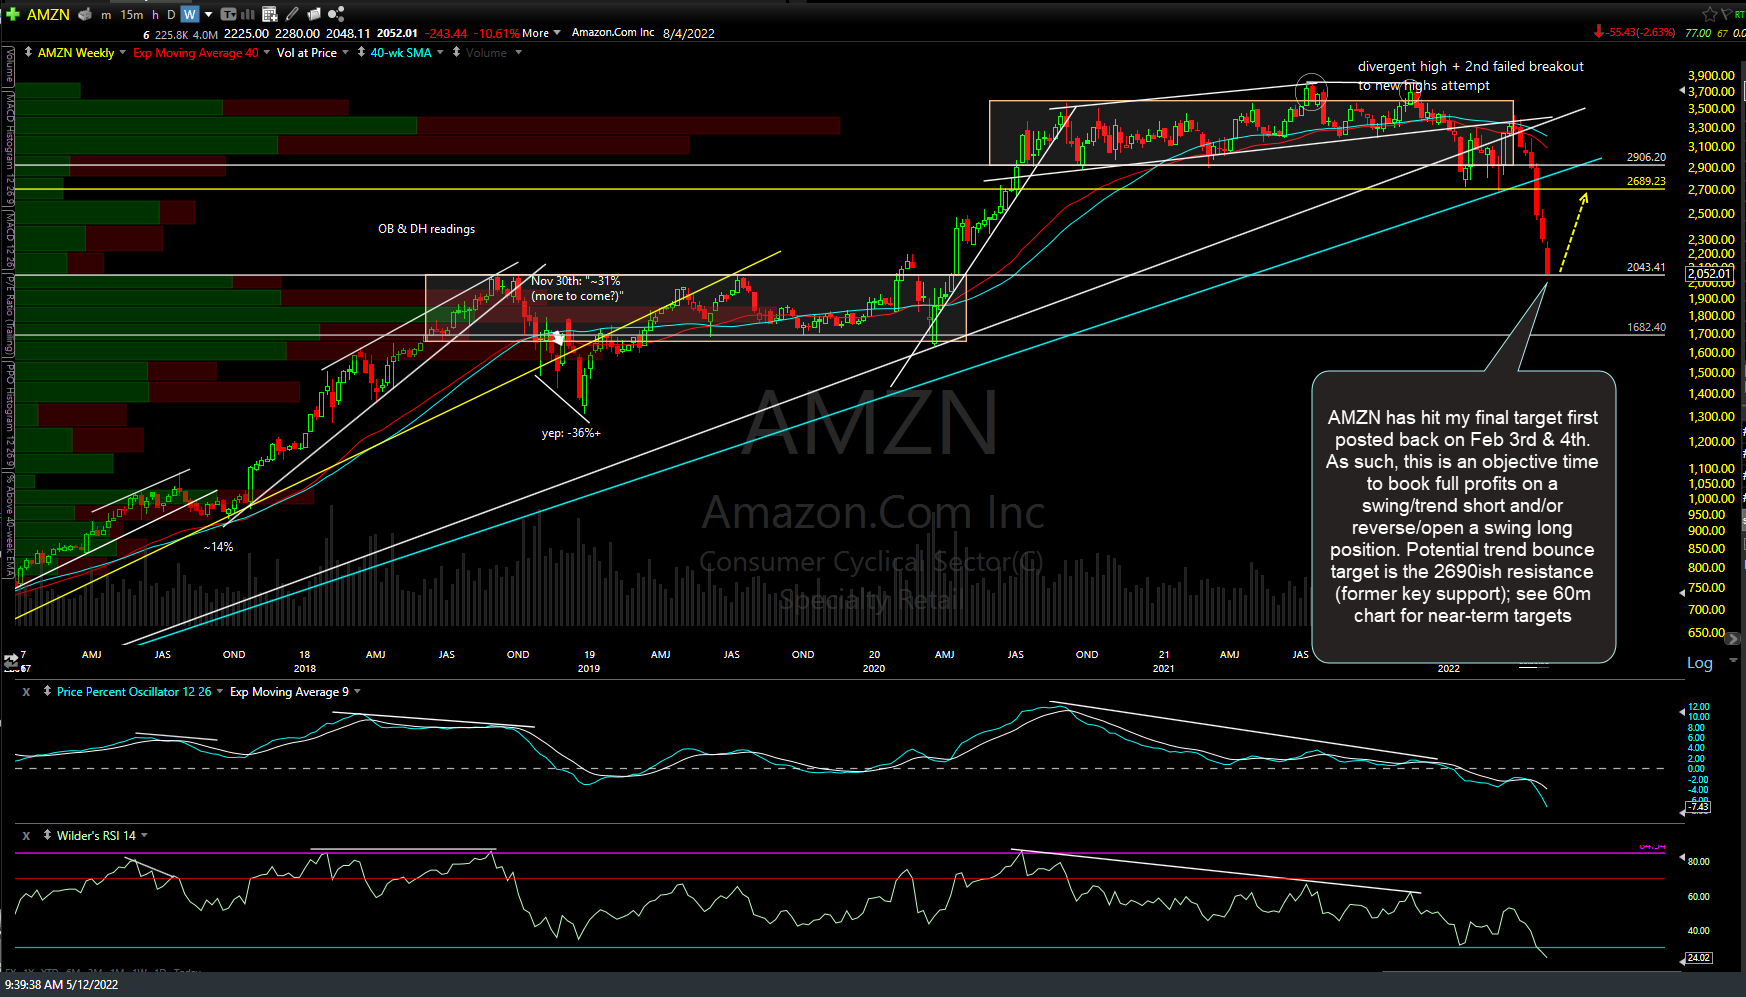
AMZN weekly 2 May 12th
While the potential for additional downside to my 3rd and possibly my 4th long-term targets on the QQQ weekly chart is still very much a possibility at this time, I will start highlighting some of the individual stocks & sectors that stand out as compelling long-side trade ideas. Those still positioned net-short the indexes looking for more downside might opt to begin scaling into individual stocks (long) with the most constructive charts as a partial hedge to existing short positions or those stocks (as well as the indexes themselves) can be taken as pure-play longs for those that already have or soon plan to cover their swing/trrend shorts.
On a somewhat related note, the SOXX/SOXS swing short trade on the semiconductor sector has just hit T1 on the weekly chart today & the IYR/SRS swing short on the REIT sector just hit T3 in the pre-market session today, additional reasons for my pivot from net short to net long today.