
With 4 of the 5 market-leading FAAMG stocks earnings reports now out of the way, that leaves AMZN (Amazon.com Inc) to bring it home today after the market close. I constantly harp on the effect those 5 overweighted mega-cap stocks have on the entire stock market & that impact will be clearly seen when the stock indices make a large gap down at the open today in the wake of a disappointing earnings report & guidance from FB (Facebook) last night.
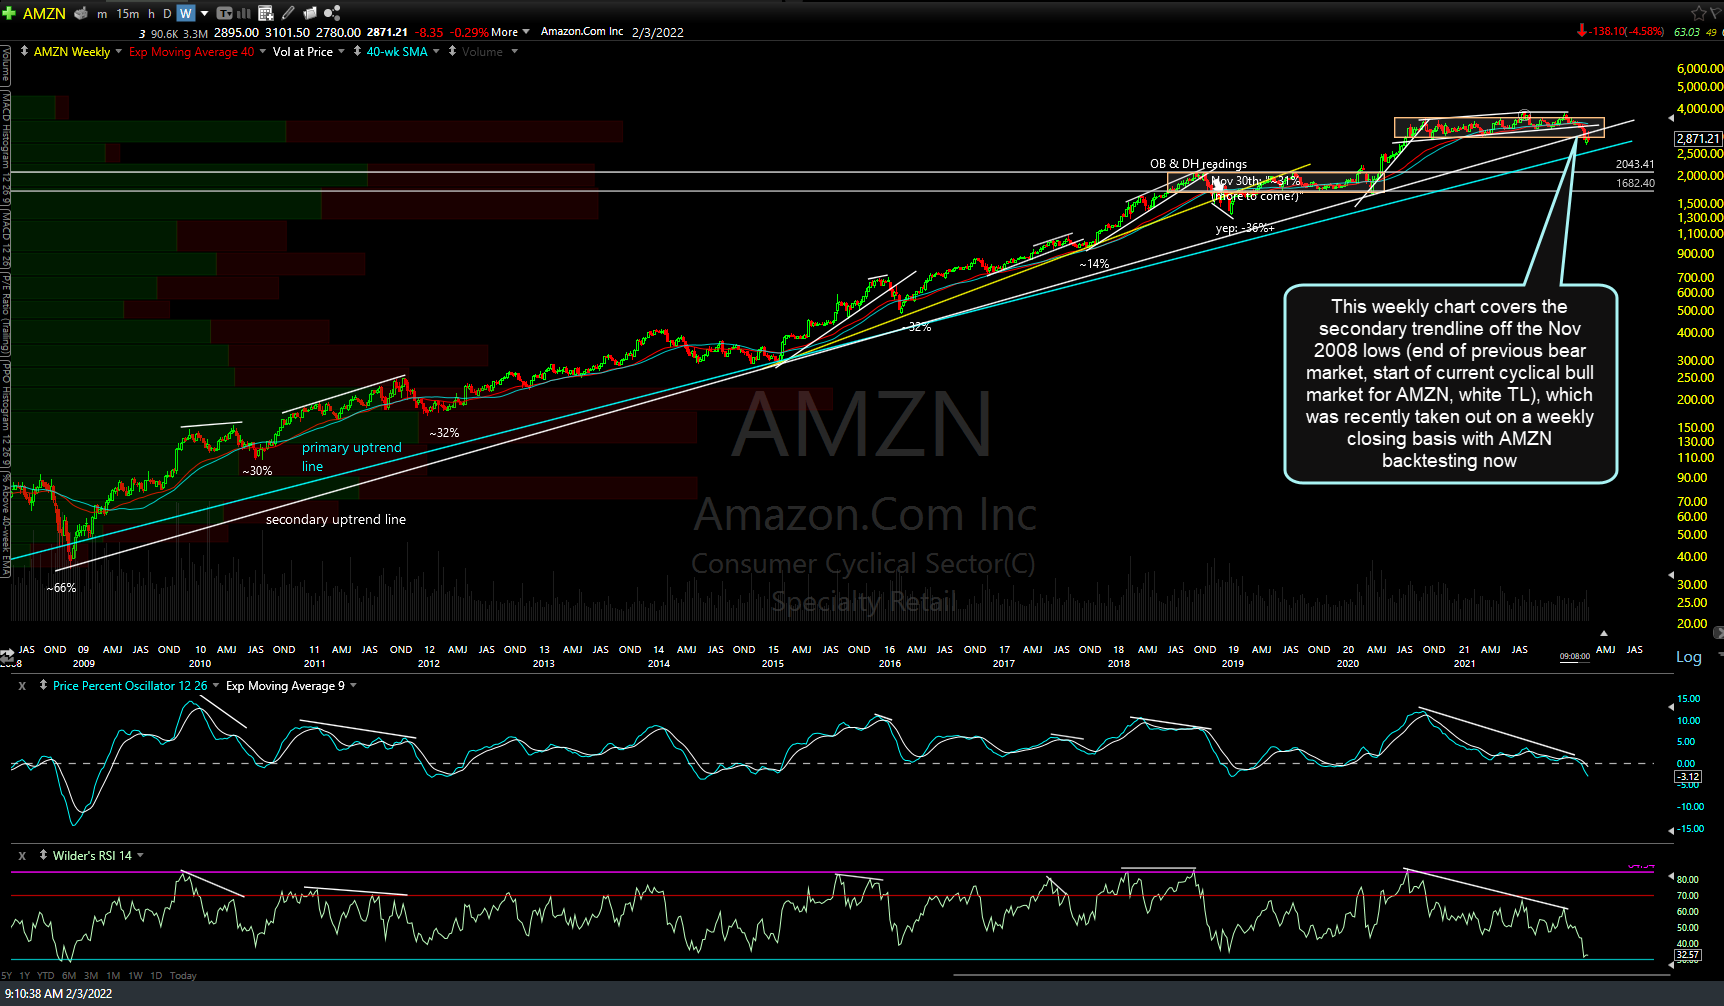
With that being said, here are 3 versions of my weekly chart on AMZN. Starting out with the biggest picture, this long-term weekly chart covers the nearly 25 yrs since AMZN went public back in 1997, highlighting the stock’s primary (secular bull market) uptrend line in blue along with a few of the rare divergent highs on the weekly time frame & the subsequent corrections/bear markets that followed. As of now, the stock remains above that trendline so those bullish could certainly use a pullback to that level to initiate or add to a long position. However, the rarely seen weekly negative divergences coupled with the recent price action & bearish developments on the shorter time frames indicate that the odds are elevated for a break below that primary trendline in the coming weeks to months.

AMZN weekly 1 Feb 3rd
Next up, the weekly chart below covers the secondary trendline off the Nov 2008 lows (end of previous bear market, start of current cyclical bull market for AMZN, white TL), which was recently taken out on a weekly closing basis with AMZN backtesting now.
AMZN weekly 2 Feb 3rd
Zooming down even further but still on the weekly time frame, AMZN broke below both the uptrend line off the Nov ’08 lows (start of the current bull market) as well as the 1.6 yr trading range & is currently backtesting both from below. My preferred scenario (large arrows) has it reversing around current levels with an alternative scenario of a backtest of the minor TL & 200-day MA’s just above (small arrows).
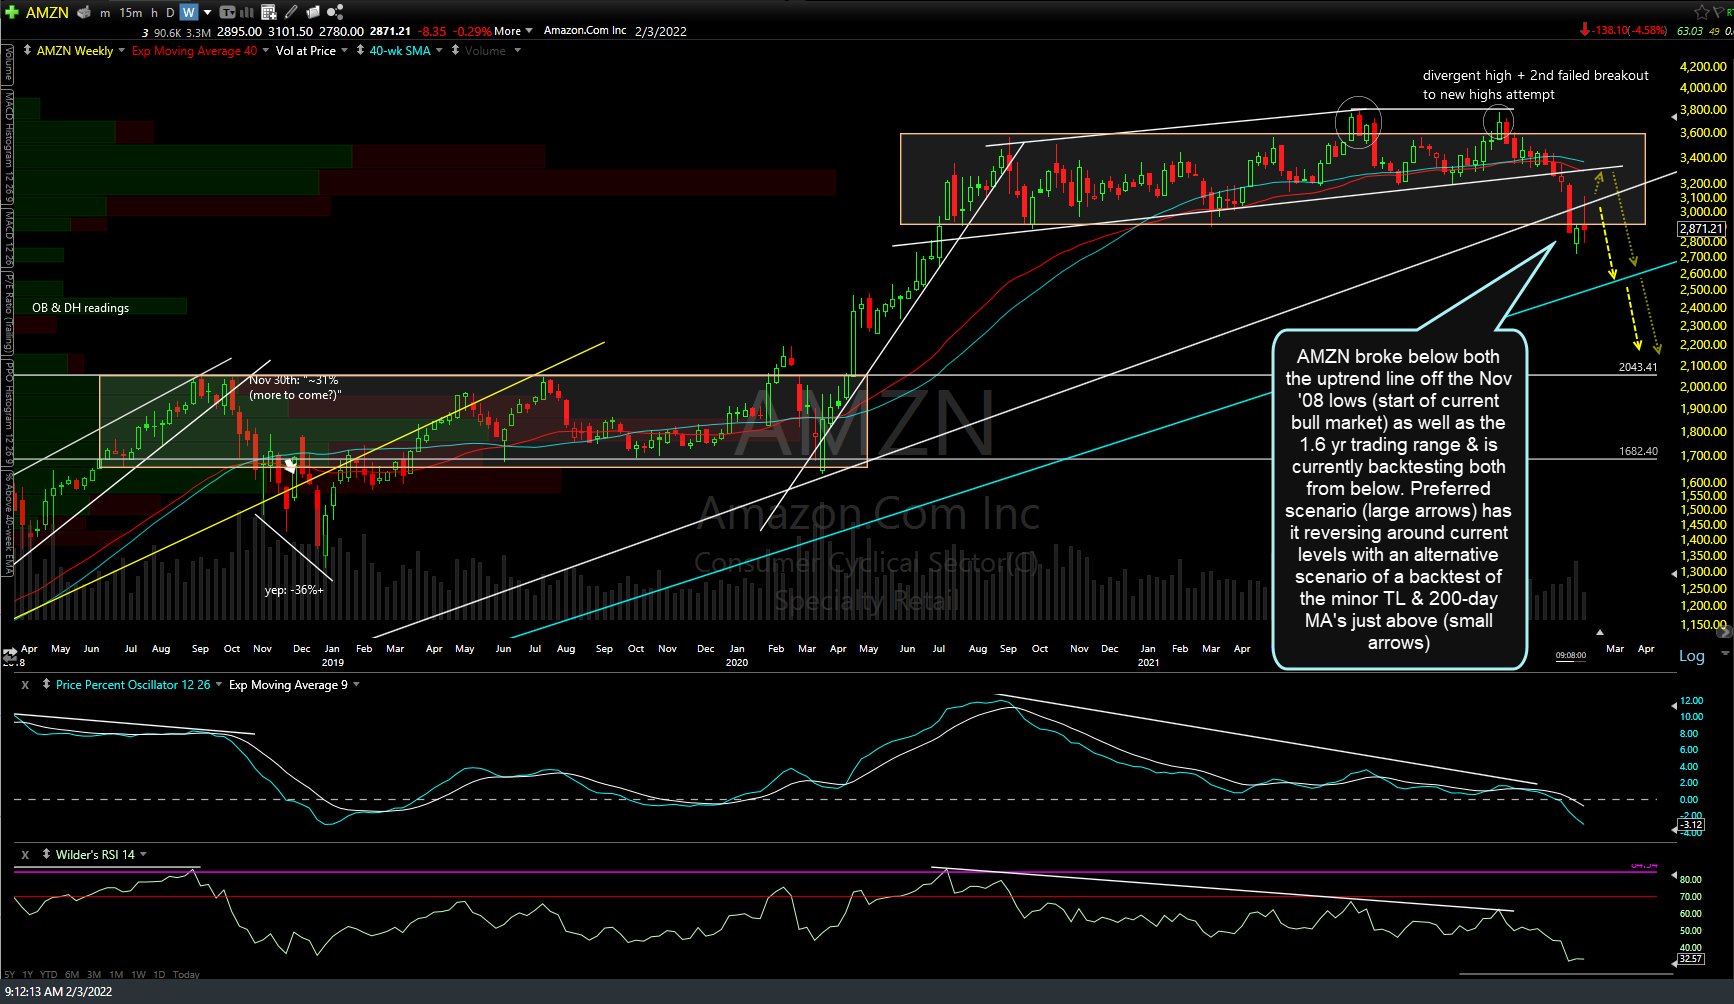
AMZN weekly 3 Feb 3rd
Needless to say, while at times, earnings can be pretty much a non-event for these market-leading FAAMG stocks (i.e.- a muted/little reaction following earnings), as both AAPL (causing a sharp post-earnings rally) and FB (a big gap down today) have shown us recently, how the market reacts to AMZN has the potential to either give the bulls or the bears some check-marks in the coming days & possible weeks.
On a related note, here are the 60 & 120-minute charts of the Nasdaq 100 futures (/NQ) and /ES (S&P 500).
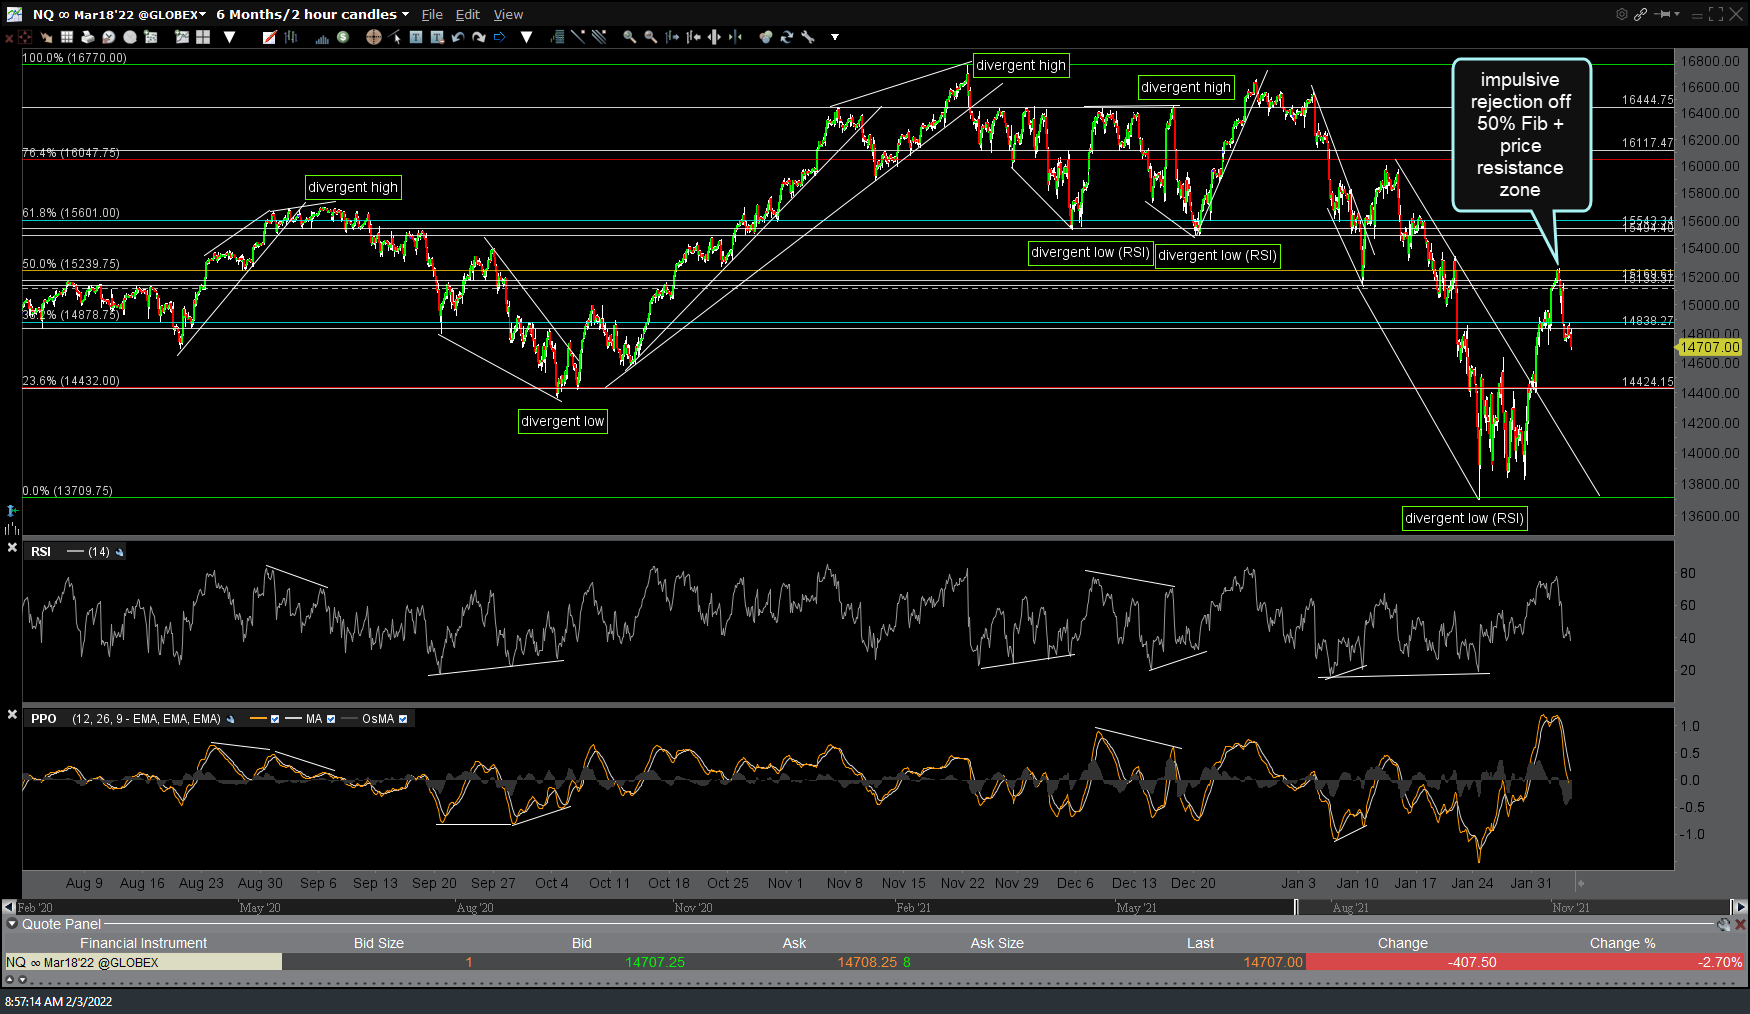
NQ 120m Feb 3rd

NQ 60m Feb 3rd

ES 120m Feb 3rd