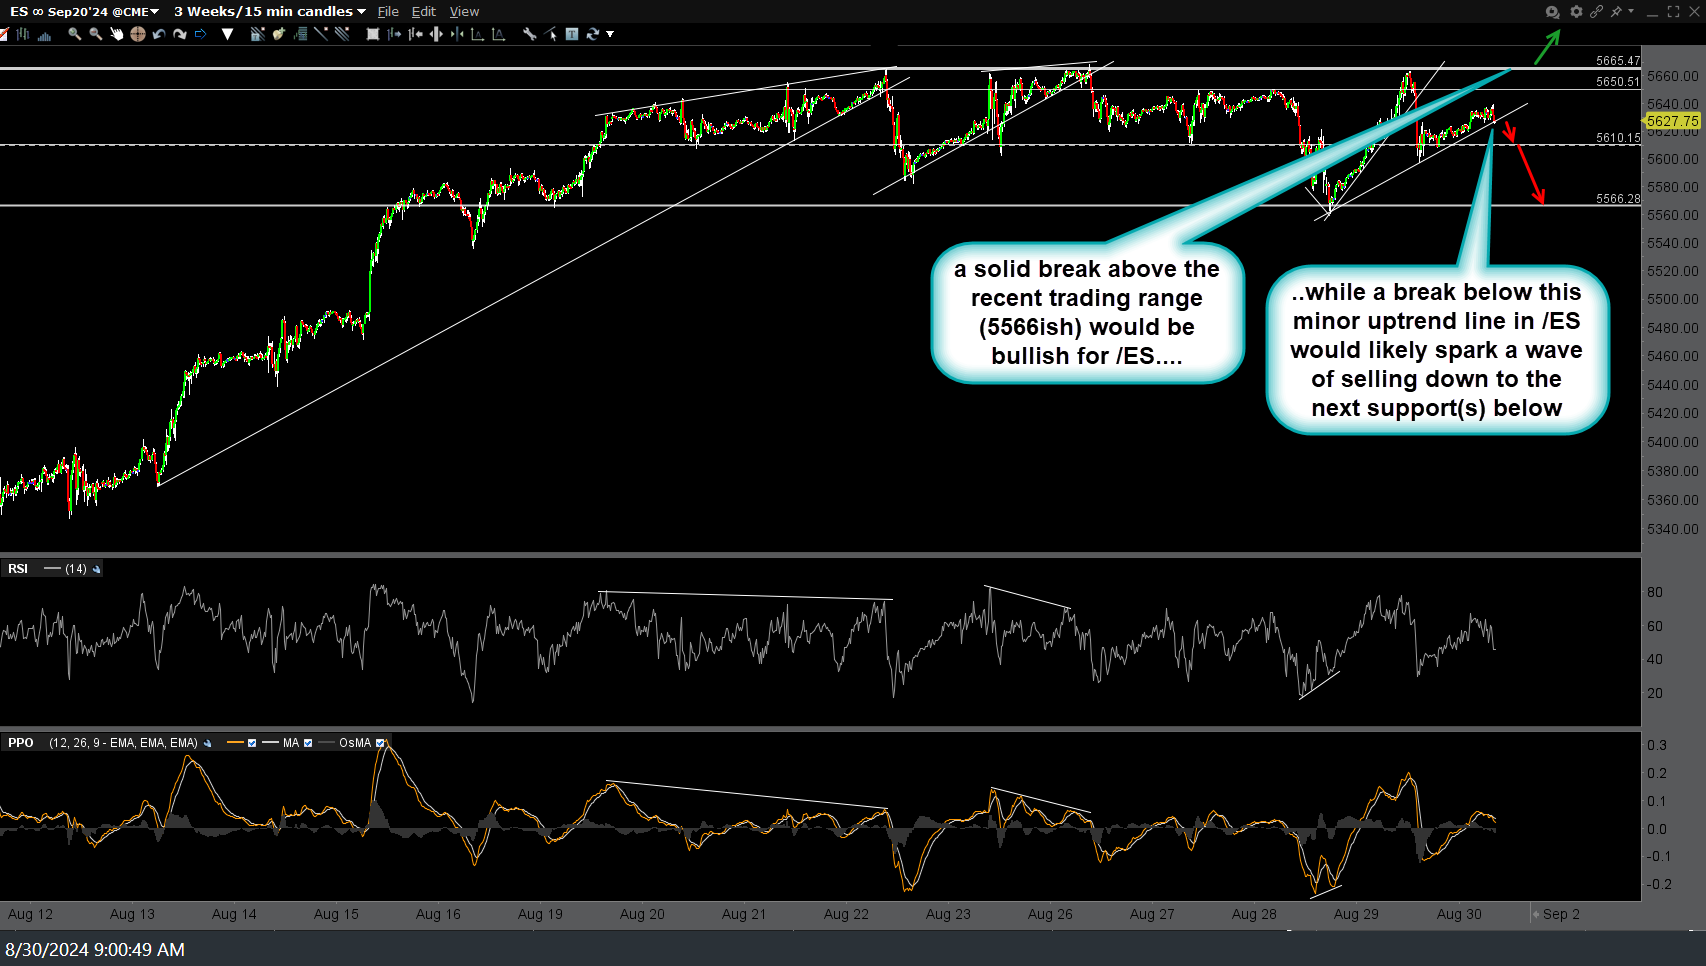
Here are some near-term support & resistance levels on the major stock indexes & a major currencies that I’m watching today. A solid break above the recent trading range (5566ish) would be bullish for /ES (S&P 500 futures) while a break below this minor uptrend line in /ES would likely spark a wave of selling down to the next support(s) below. 15-minute chart below.
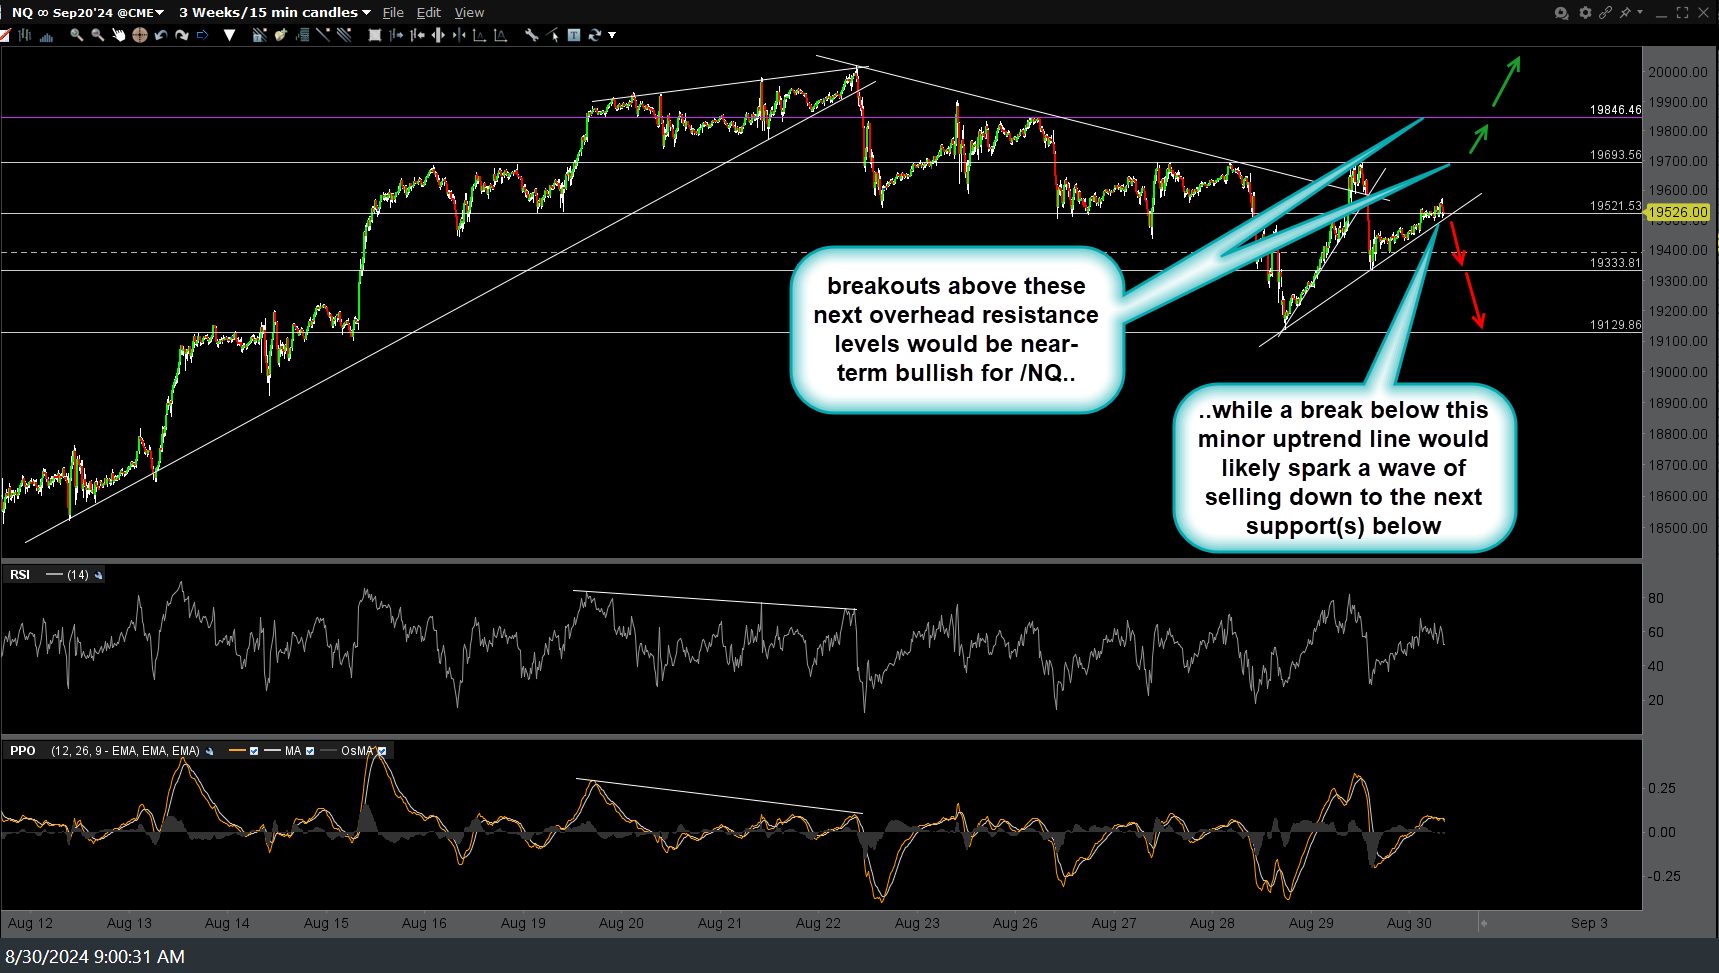
Likewise, breakouts above these next overhead resistance levels would be near-term bullish for /NQ (Nasdaq 100 futures) while a break below this minor uptrend line would likely spark a wave of selling down to the next support(s) below. 15-minute chart:
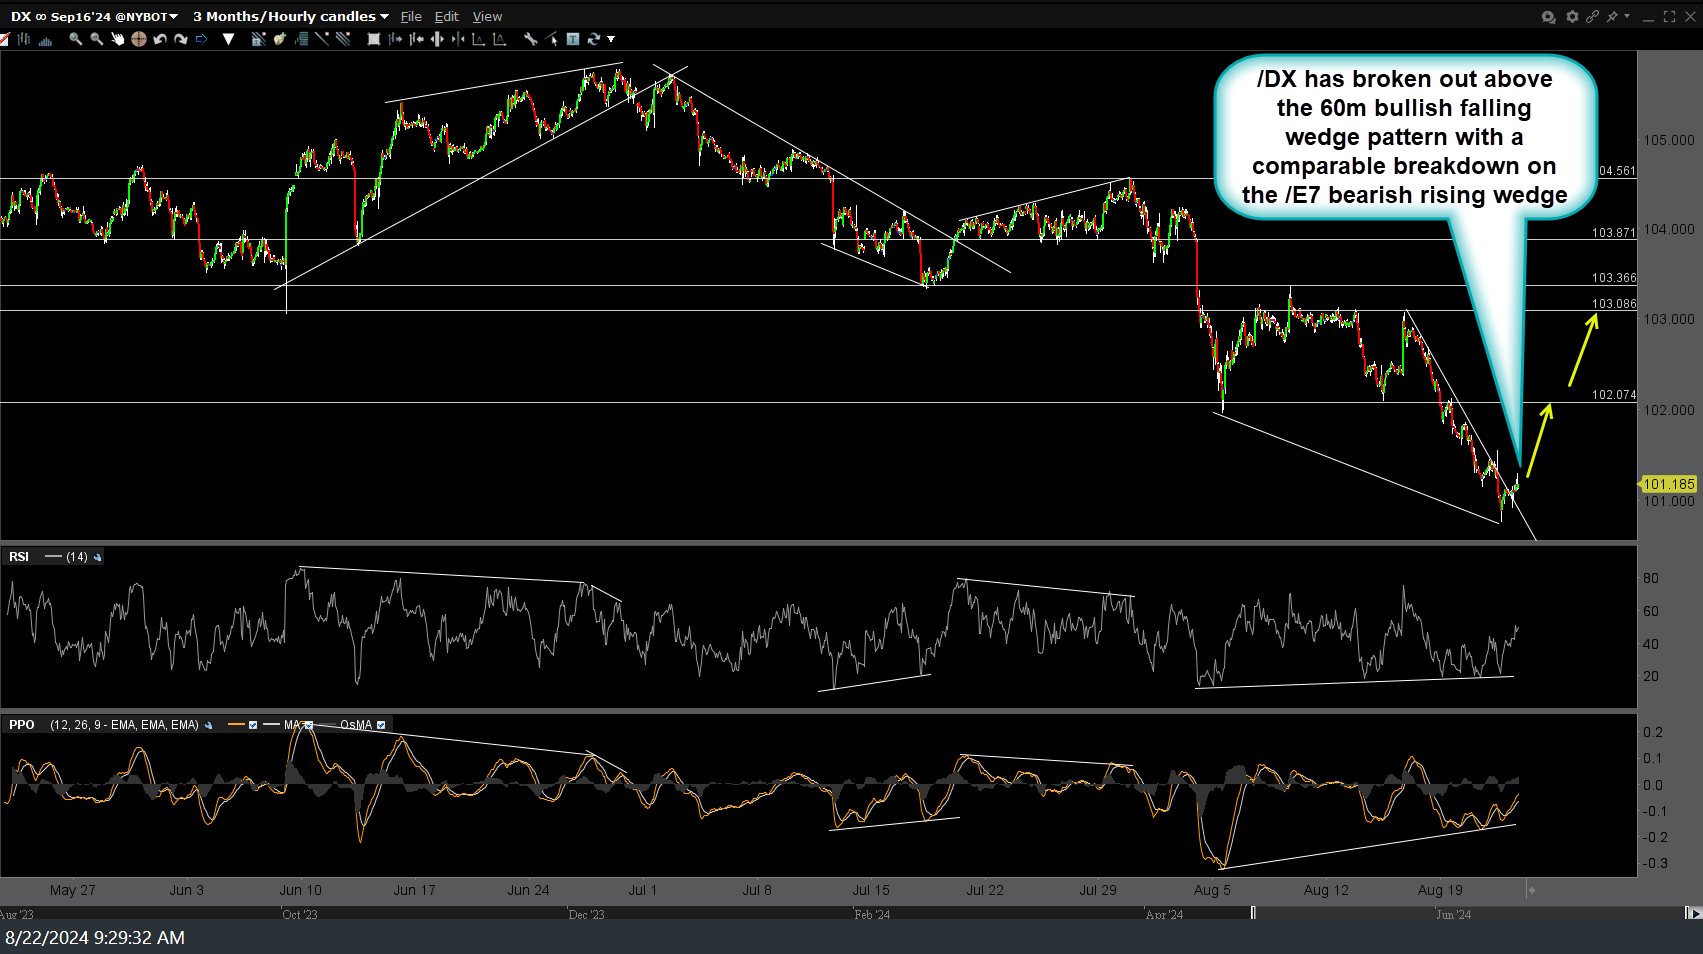
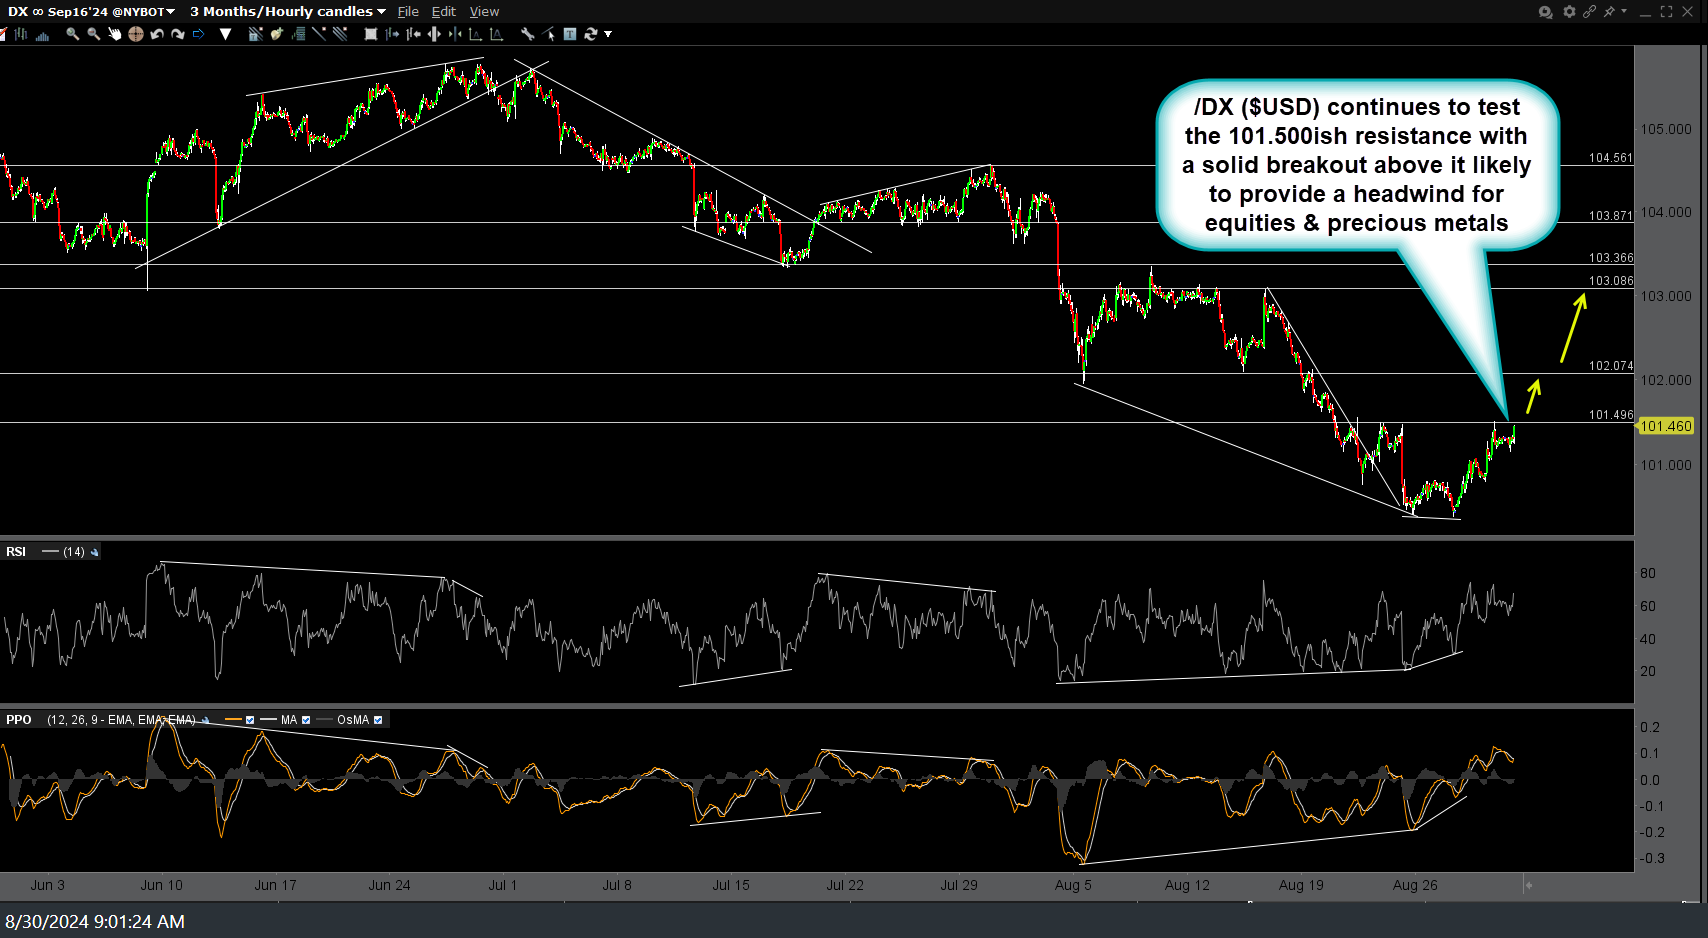
I often highlight the correlations (positive & negative) between the Euro, US Dollar, US stock market, & precious metals. /DX (US Dollar Index futures) continues to test the 101.500ish resistance with a solid breakout above it likely to provide a headwind for equities & precious metals. Of course, that will likely work the other way, should /DX get rejected off this resistance & head much lower. Previous (Aug 22nd) & updated 60-minute charts below.
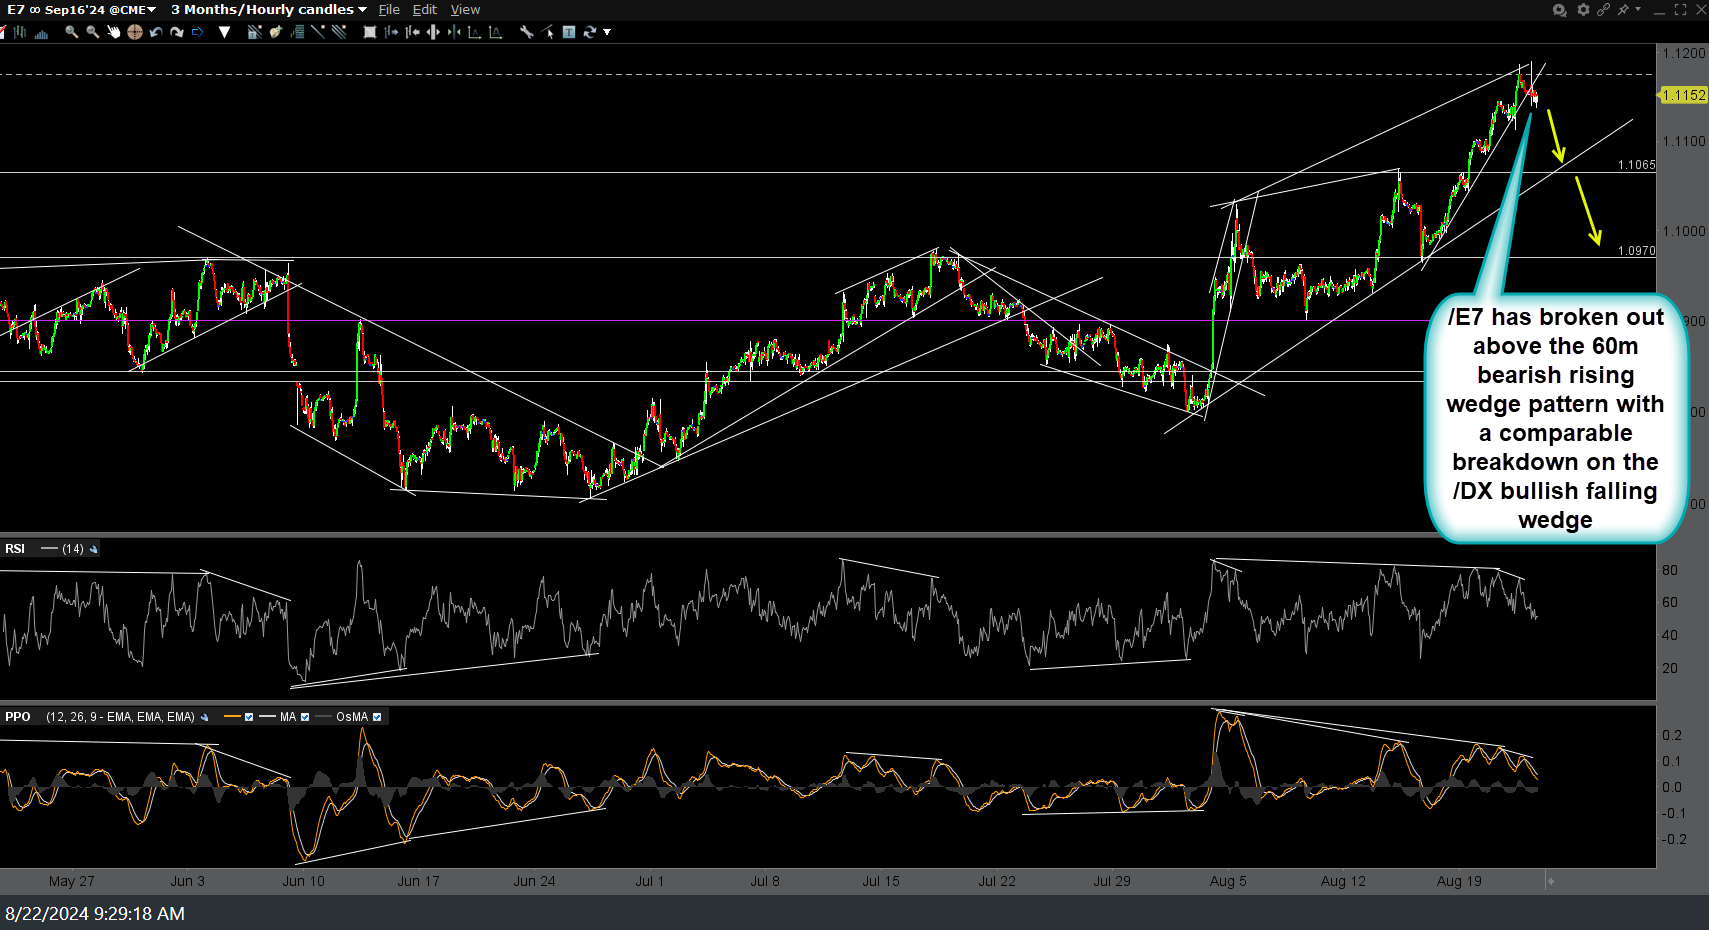
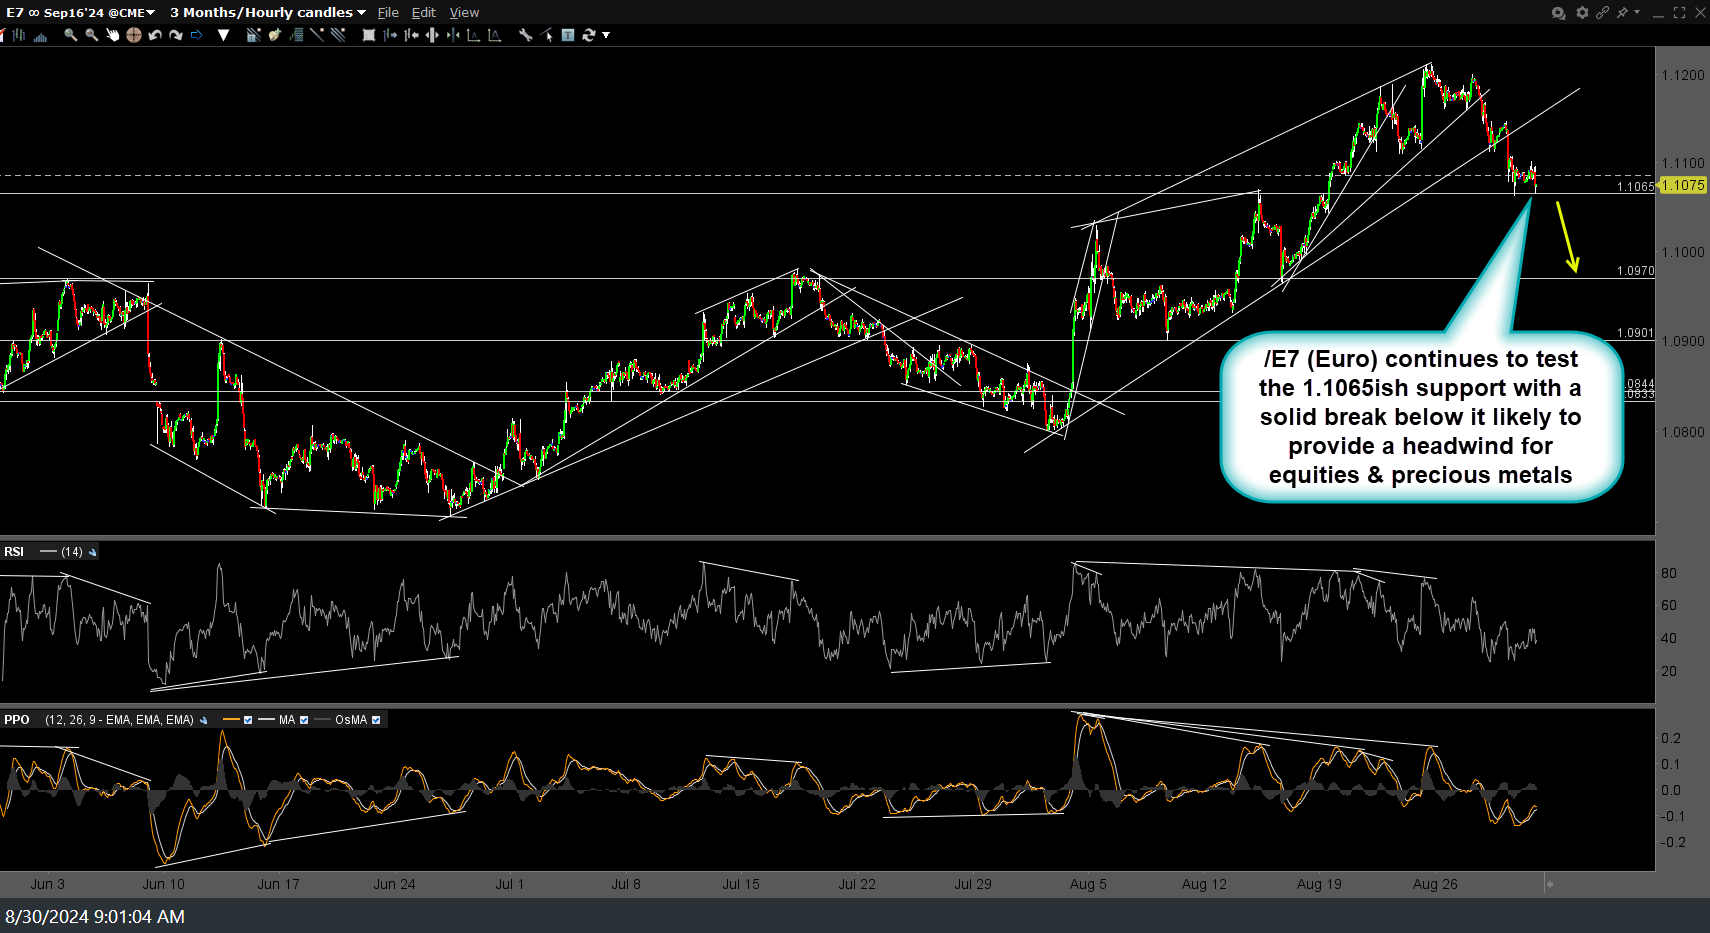
Likewise, /E7 (Euro futures) continues to test the 1.1065ish support with a solid break below it likely to provide a headwind for equities & precious metal. Previous (Aug 22nd) & updated 60-minute charts below.


