
I continue to monitor the US Dollar & Euro for signs of a trend reversal which the charts are indicating as likely to occur soon. Looking at the bigger picture via the 20+ year weekly chart of $USD (US Dollar index) below, the Greenback is once again coming off overbought readings (RSI 70+) following a divergent high, with all similar technical postures in recent decades followed by substantial corrections and/or bear markets in the Dollar.
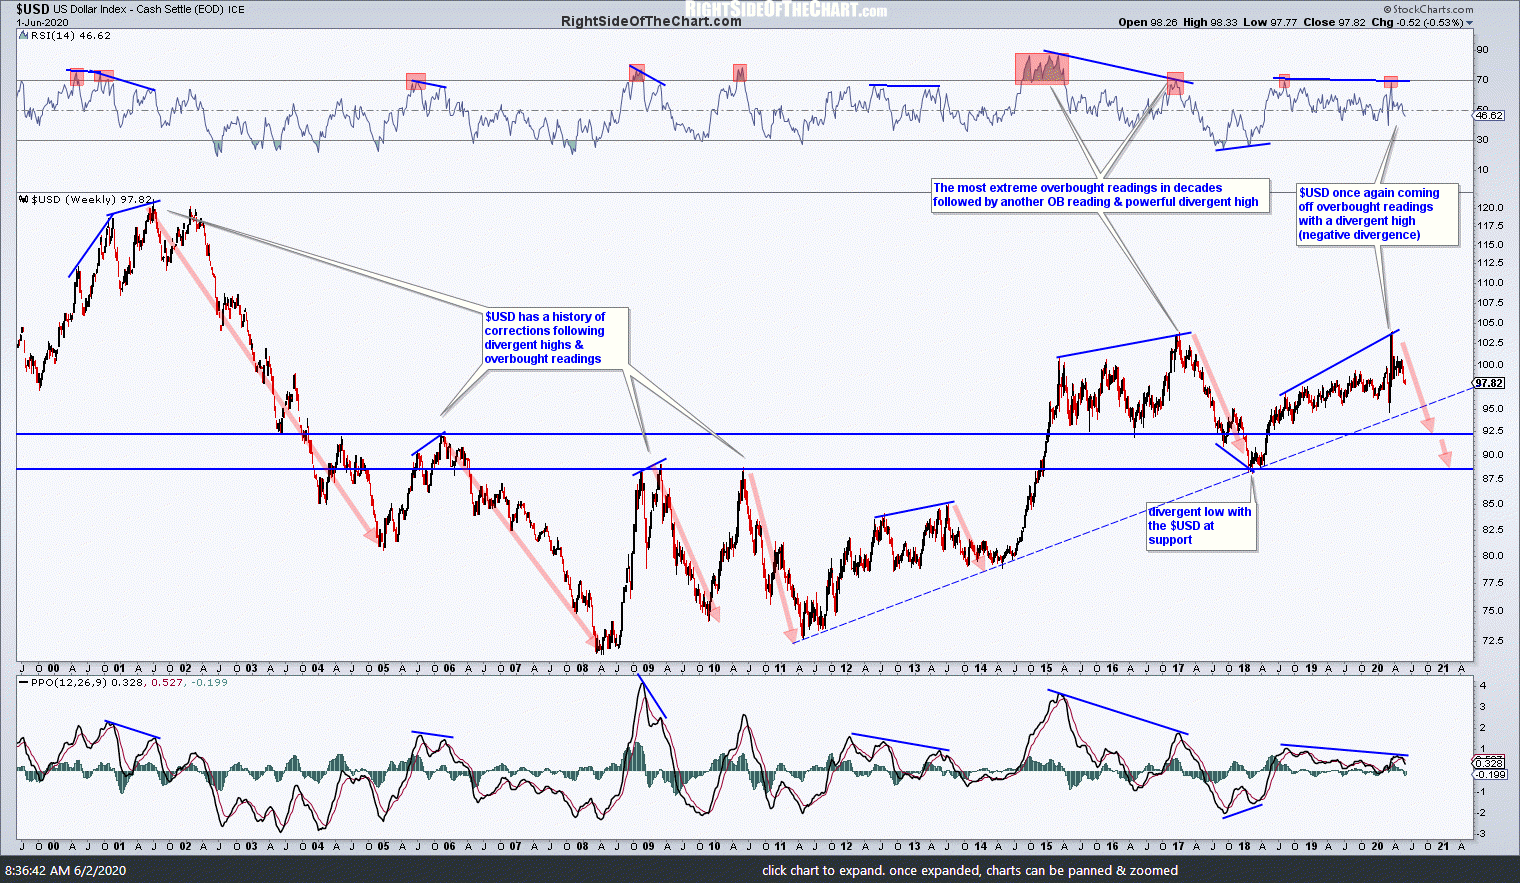
USD weekly June 2nd
While the weekly charts help to provide the intermediate & longer-term outlook for a security, the shorter-term charts such as the daily & 60-minute timeframes help to provide the near-term outlook as well as timely buy & sell signals. As of now, the $USD remains in a near-term downtrend, which has been the primary catalyst behind the recent rally in the Dollar-sensitive assets such as crude oil & silver. However, despite the longer-term bearish outlook for the Dollar on the weekly chart above, the $USD appears to be setting up for a near-term rally as the positive divergences continue to build on this 60-minute chart of /DX (US Dollar futures), with buy signals to come on solid breaks & 60-minute closes below both the minor & secondary downtrend line below.
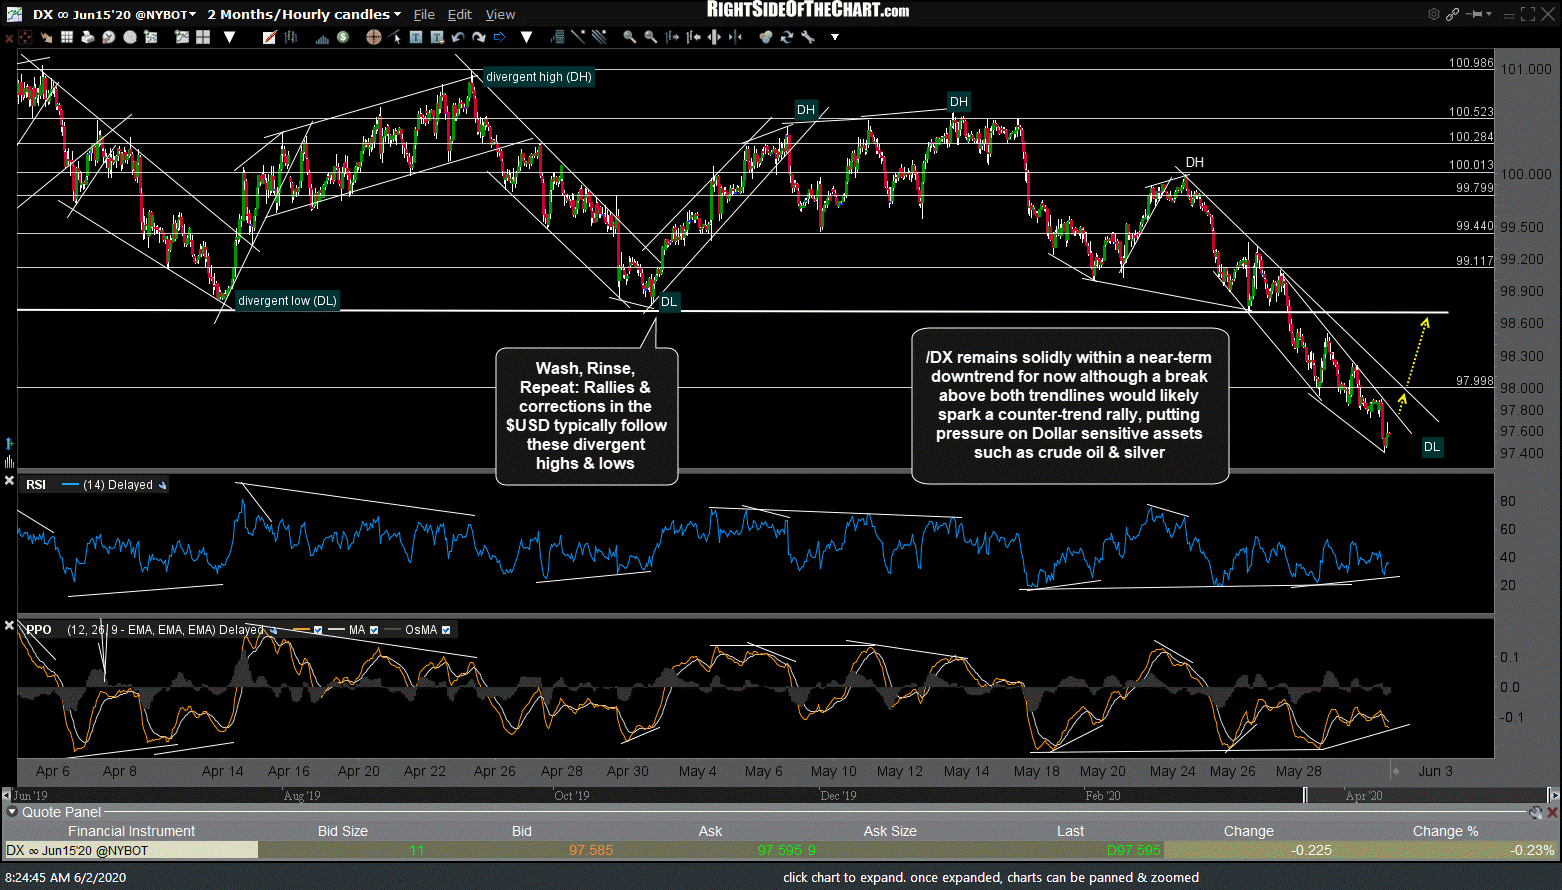
DX 60m June 2nd
As the largest component of the US Dollar index, the Euro is nearly a mirror inverse to the Dollar (Euro up = Dollar down & vice versa). As the 60-minute chart of /E7 (Euro futures) below highlights, there is an extremely clear pattern of rallies & corrections following the divergent lows & highs. With negative divergences currently in place, the next sell signals on /E7 will come on breaks below these nearby uptrend lines.
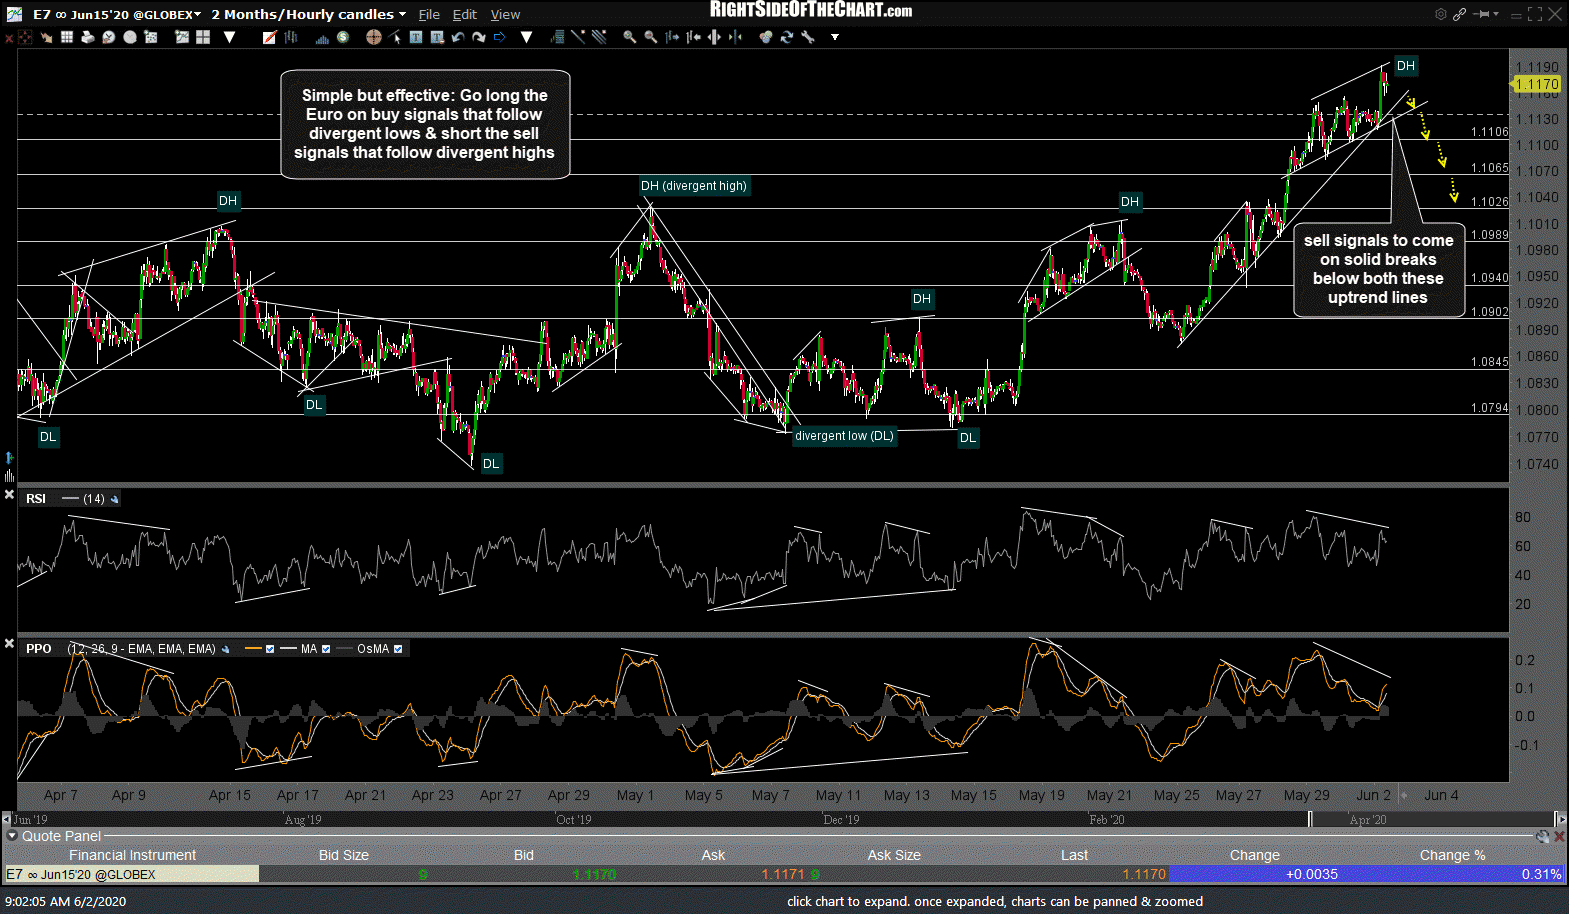
E7 60m June 2nd
As mentioned above, crude oil & silver are two Dollar-sensitive assets that were recently lifted in large part by the drop in the $USD with both likely to correct if/when Dollar rallies. The charts below highlight the inverse correlation between silver & crude oil by flipping it around to a positive correlation using UDN (the inverse or bearish US Dollar ETN) instead. That makes the impact of a rising or falling Dollar stand out more clearly compared to viewing a chart where one is moving up while the other is moving lower.
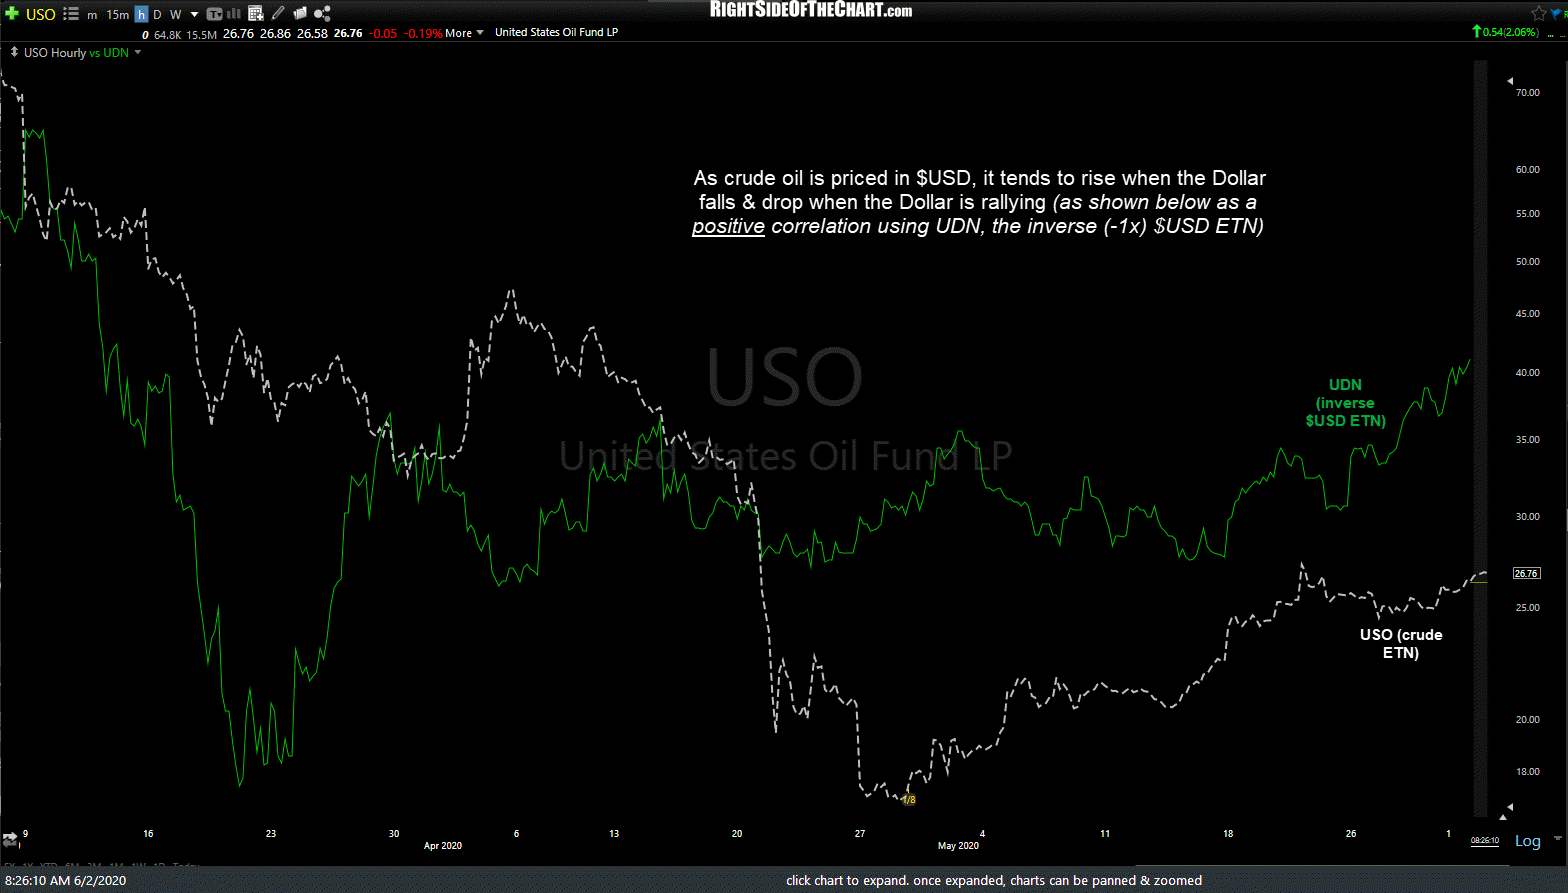
USO vs UDN 60m June 2nd
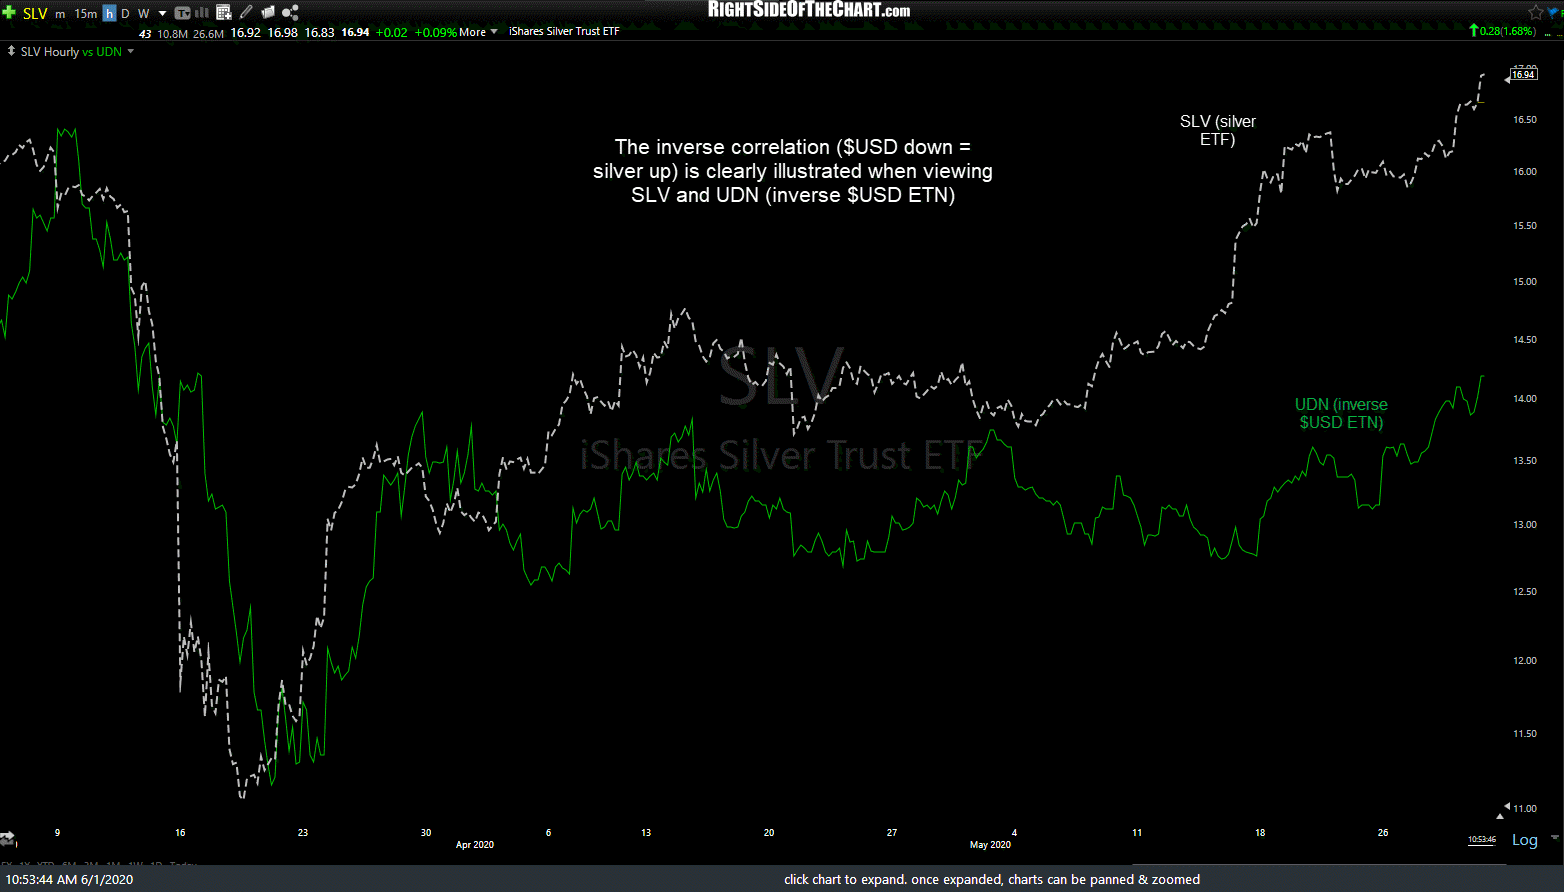
SLV vs UDN 60m June 1st