
The five charts below help to support my case for a rally in gold in the coming weeks to months. The EUR/USD is, by far, the largest component of the $US Dollar Index at a 57.6% weighting. The currency pair looks poised for a substantial rally following this extreme oversold reading & drop to support with bullish divergences on both the 60-minute & this daily chart.
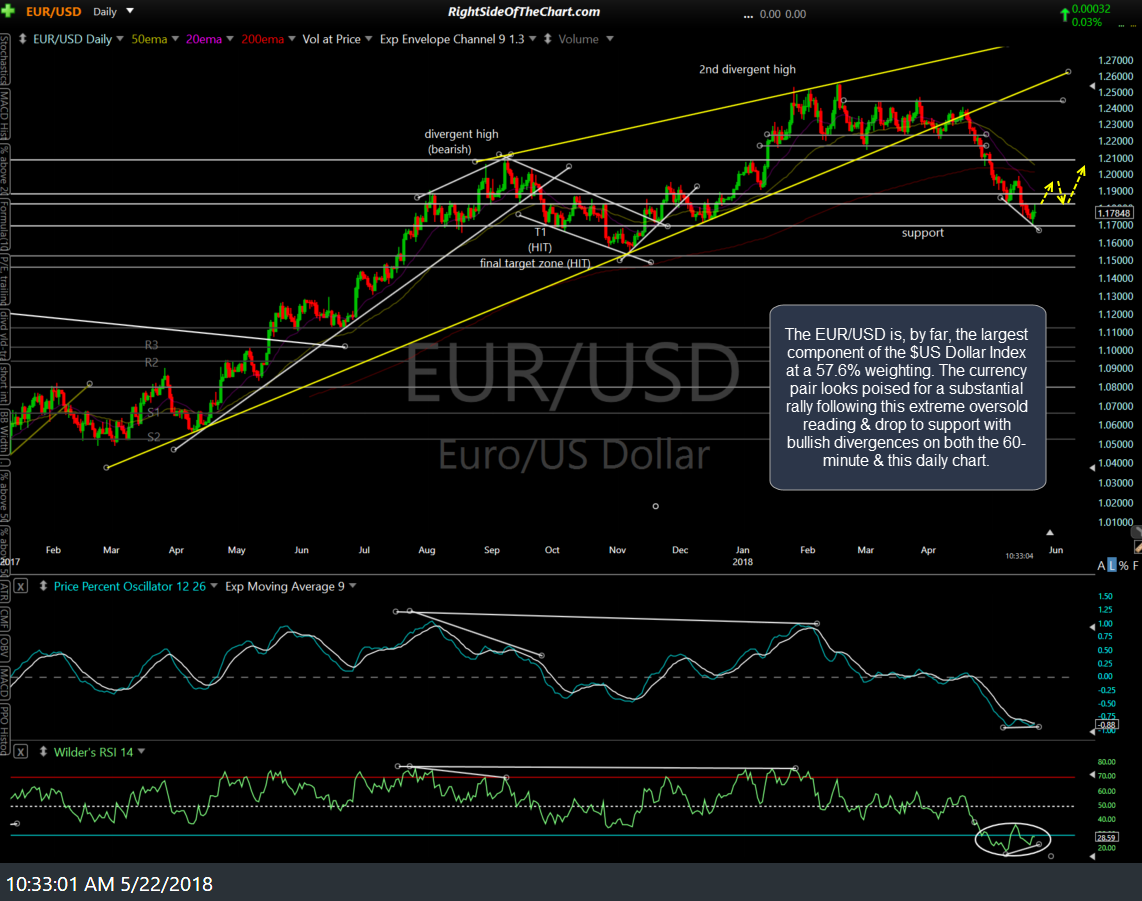
EUR-USD daily May 22nd
The EUR/USD just put in a divergent low on this 60-minute chart as well as the daily chart while falling to key support. Should the EUR/USD rally in the coming weeks+, as I highly suspect, that will mean $USD down & gold up.
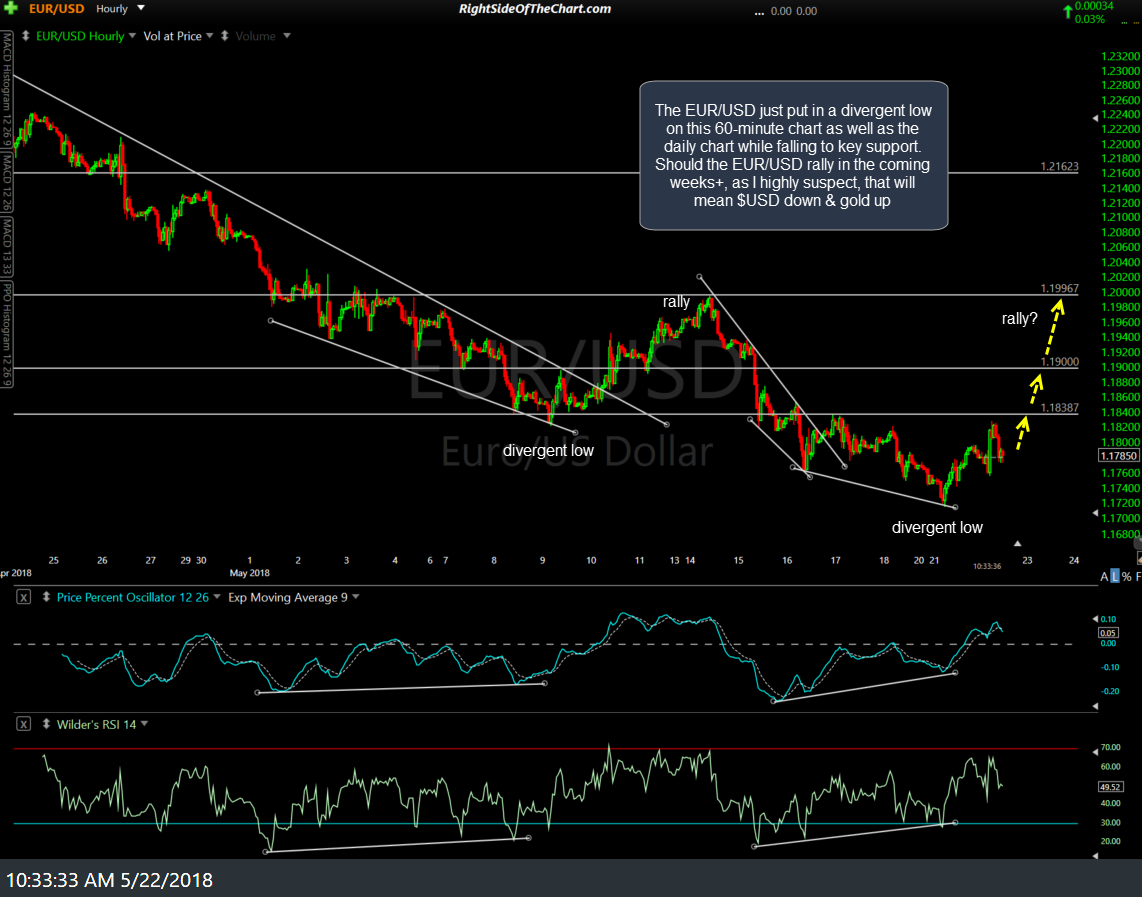
EUR-USD 60-min May 22nd
The next chart below is a daily chart of the US Dollar/Japanese Yen currency pair. The white arrows show the RSI overbought readings on USD/JPY, all of which were followed by corrections as well as the 3 overbought + divergent highs, including the current one. I don’t see why this time will be any different.
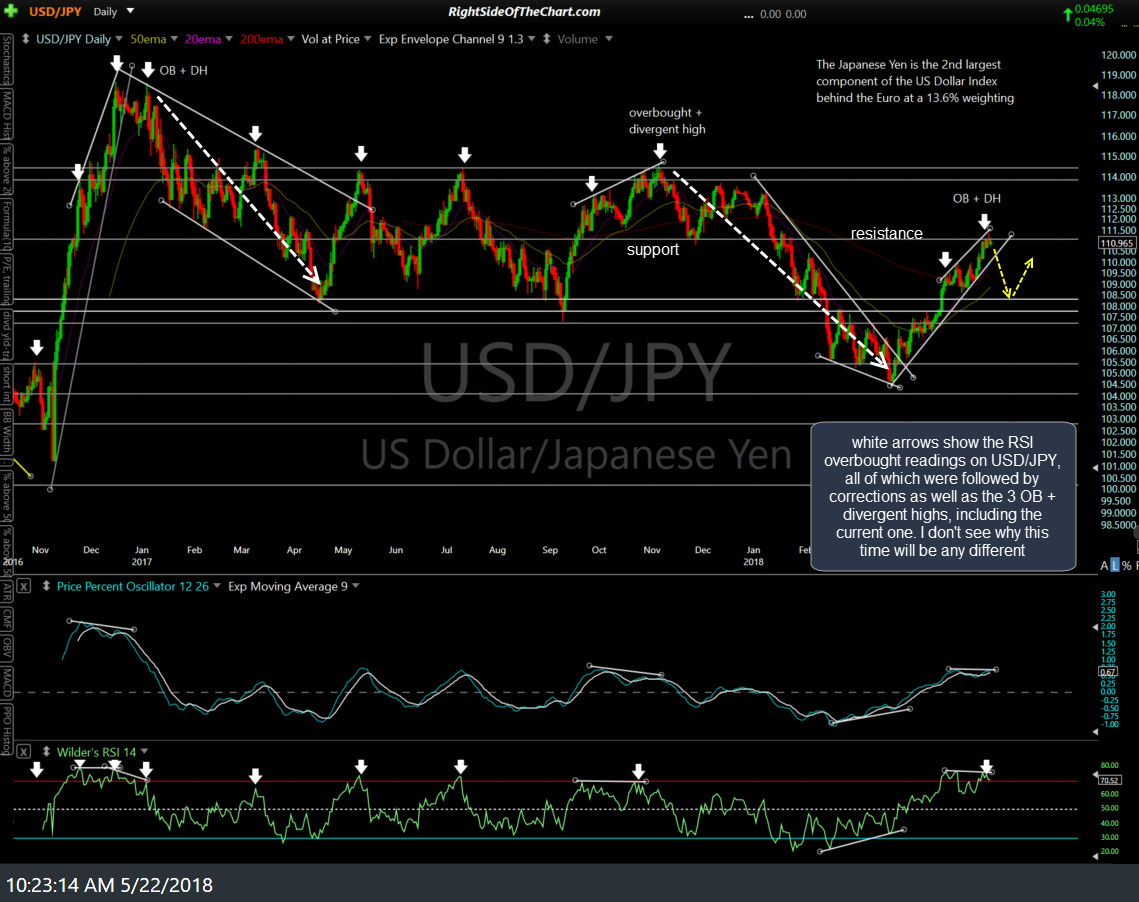
USD-JPY daily May 22nd
Zooming down to the 60-minute timeframe, USD/JPY has broken down below the ascending price channel following the recent divergent high which also coincided with an even more powerful divergent high & the currency pair making an over-extended run into solid resistance on the daily chart.
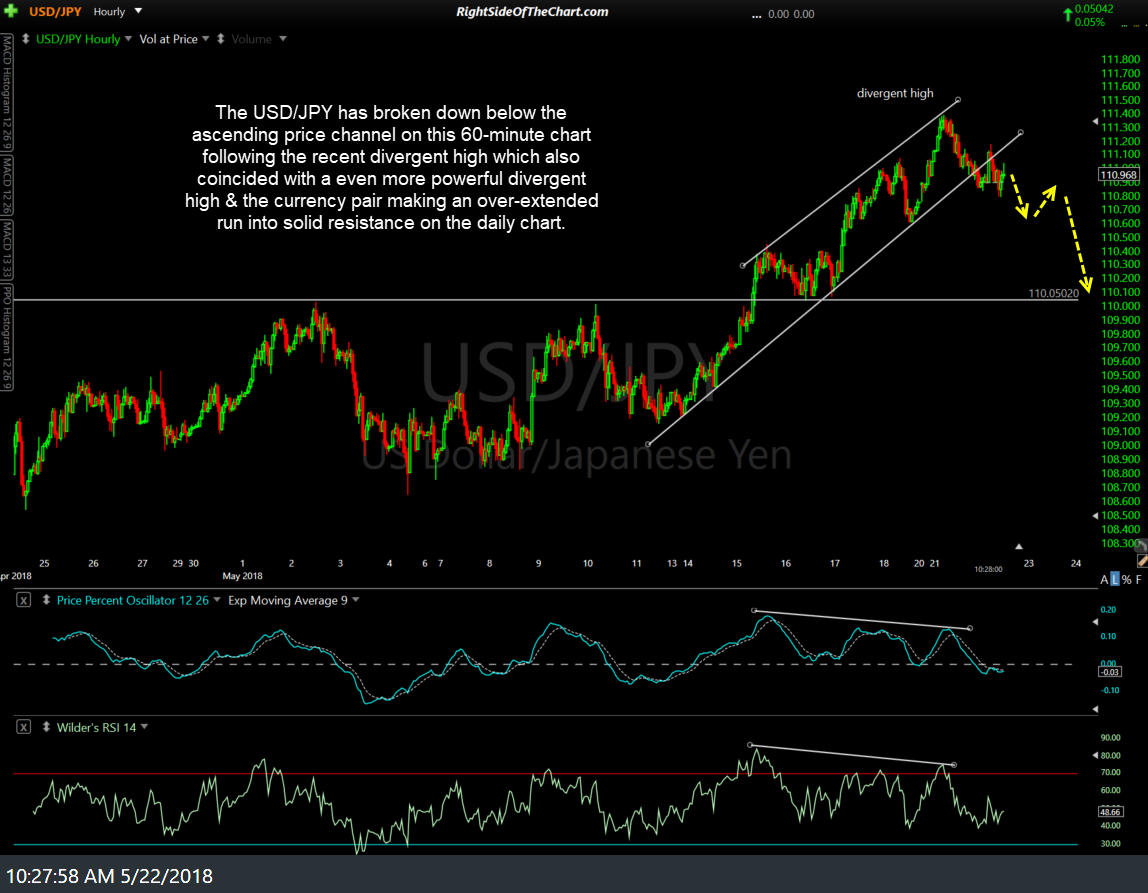
USD-JPY 60-min May 22nd
Last but not least, why have I posted four charts on currencies to support the case for a rally in gold? Lest there be any confusion as to just how strong the inverse correlation between gold & the $USD, this comparison of GLD (yellow) & UDN (inverse $USD Index ETF) over the past 4 years should help clearly illustrate the correlation. Note the direction of both during the bullish & bearish trends as the price differential between the two is to be expected as gold & the US Dollar does not move in equal percentage terms on a daily basis.
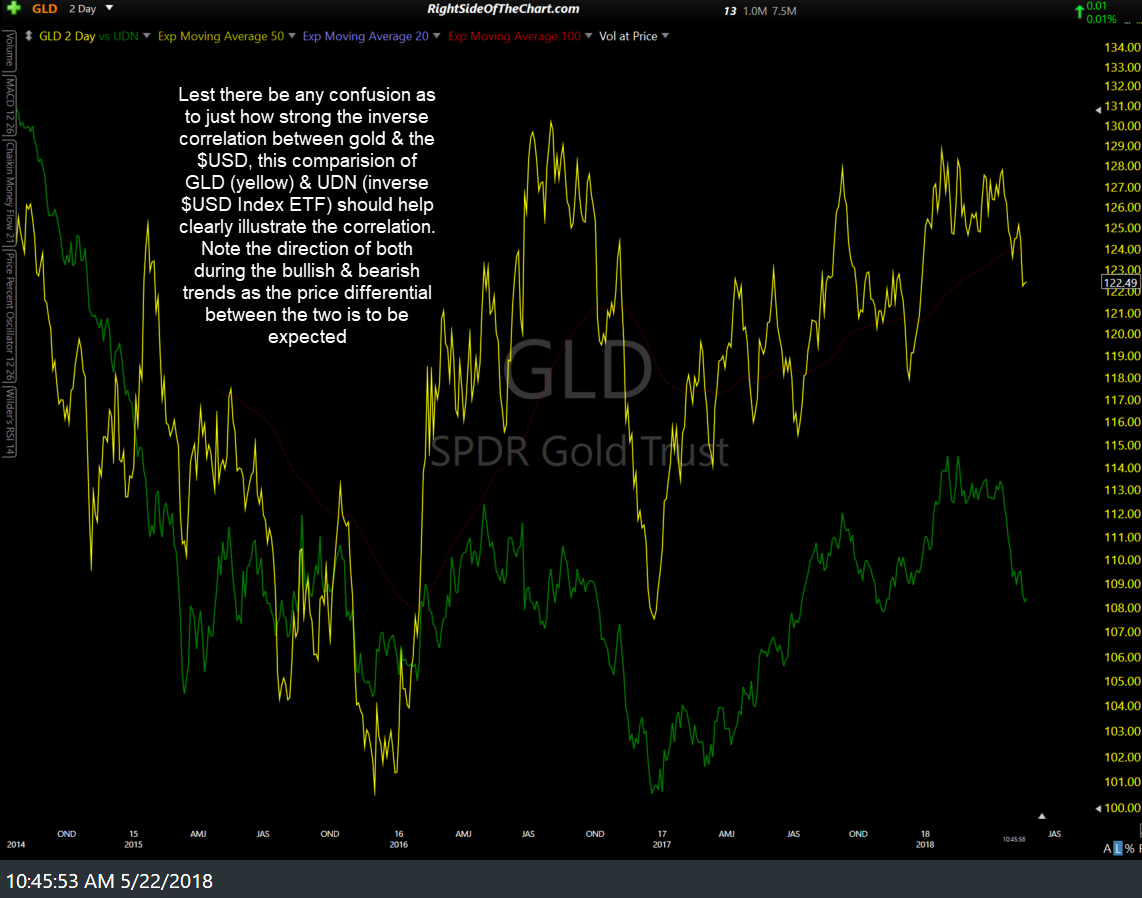
GLD vs UDN 4-year chart May 22nd