
Wash. Rinse. Repeat: After milking nearly all of the previous drop from the Oct 22nd highs to the recent lows by shorting /ZB & TLT (30-yr T-bond futures & ETF) on the bearish rising wedge break & covering at the final target (first of the uptrend line or 87.24 price support level on TLT), it now appears to be an objective time to run it the other way (long) as TLT has now hit that 87.24 price support level with bullish divergences in place on the 60-minute chart. Stops should be relative to one’s preferred price target(s). Updated TLT 60-minute chart & /ZB 120-minute charts below.
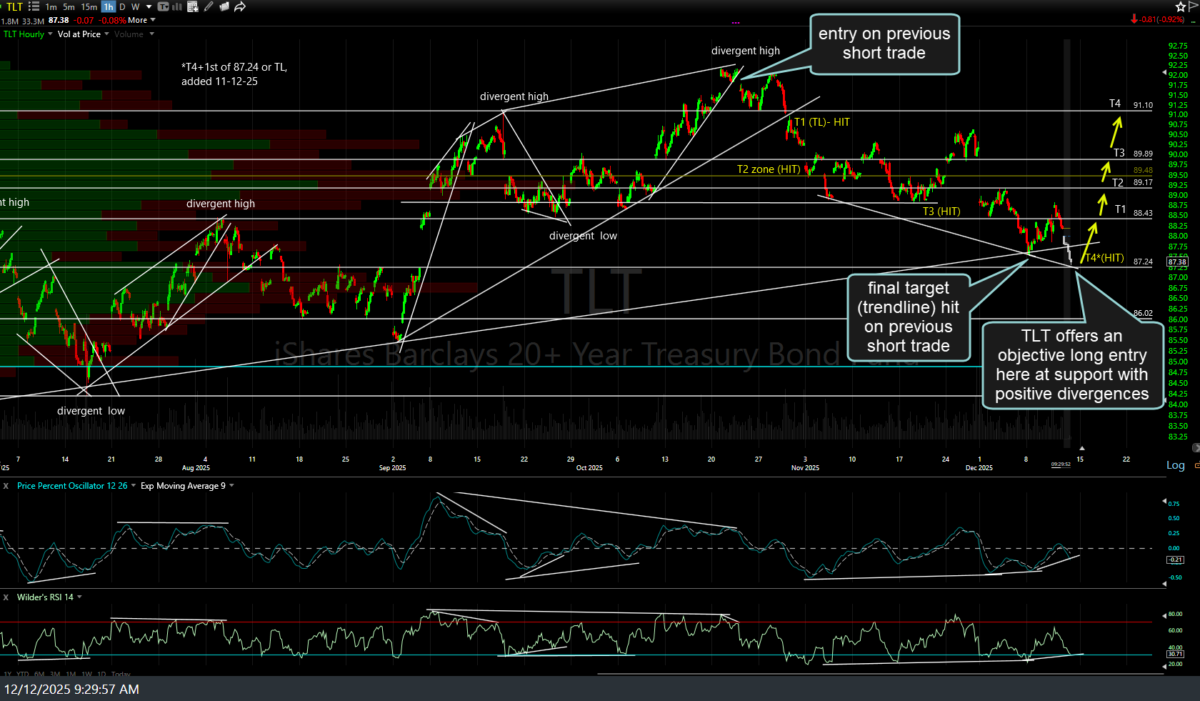
TLT 60m Dec 12th
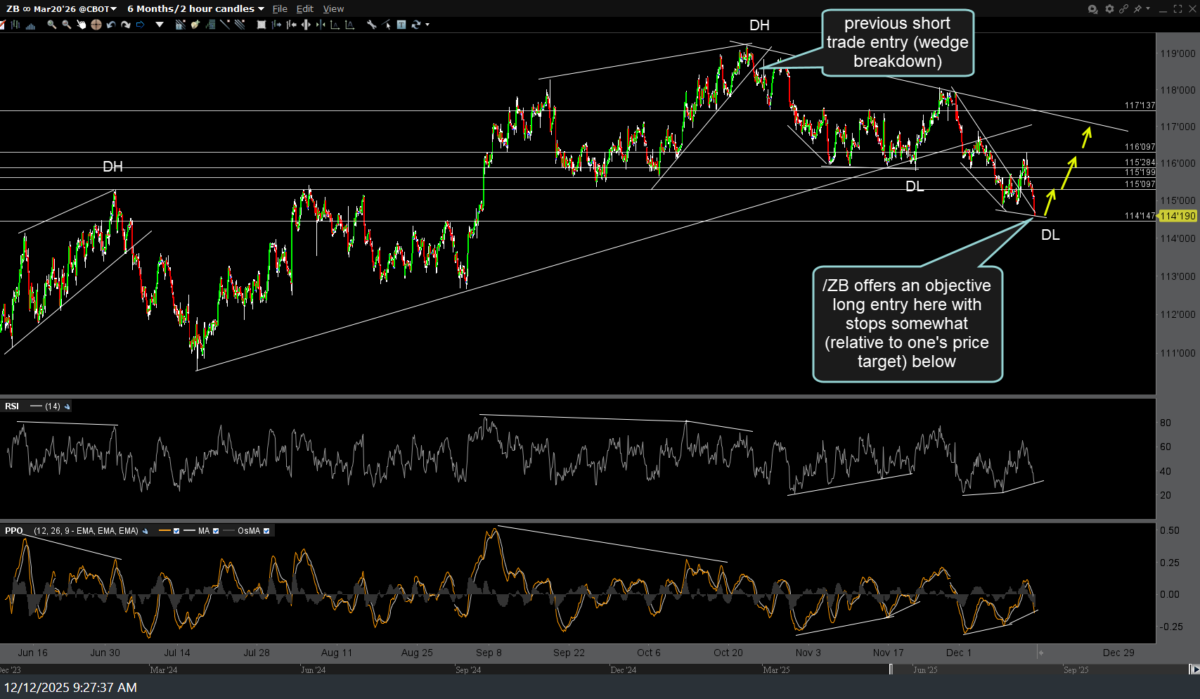
ZB 120m Dec 12th
As per recent videos, $TYX (3o-yr Treasury bond yield) and $TNX (10-yr T-bond yield) are both testing key resistance, which correlates to TLT & IEF (10-yr T-bond ETF) testing support. Should yields solidly break out above those downtrend lines, that would be a net-bearish event for the stock market (bullish for yields, bearish for bond prices..i.e., TLT & /ZB).
As such, a TLT or /ZB long could also be viewed as an indirect hedge to a short position on the major stock indices. (i.e., If Treasury bonds continue to fall from here, yields will continue to rise & most likely cause stocks to fall).