
The major stock indexes have formed what appear to be bear flag continuation patterns, as show on the 60-minute charts of /NQ & /ES (Nasdaq 100 & S&P 500 index futures) below. Similar areas of consolidation can also be viewed on the SPY & QQQ 60-minute charts.
-

- NQ 60-min Nov 13th
-
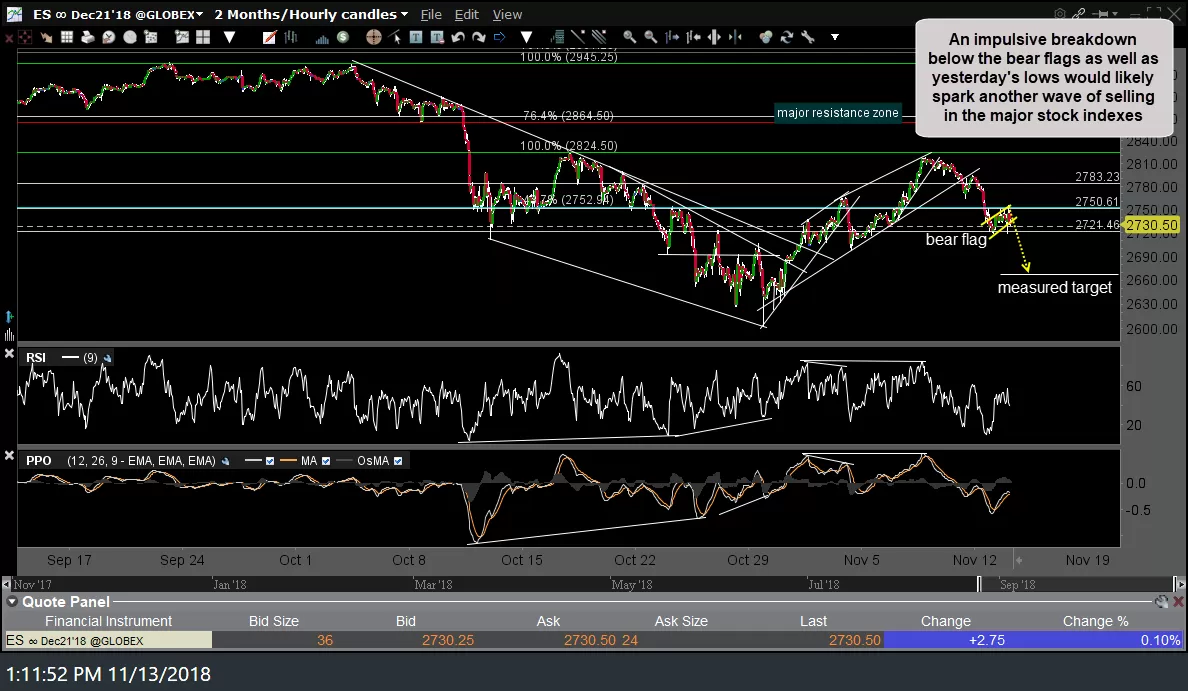
- ES 60-min Nov 13th
Impulsive breakdowns below the bear flags, as well as yesterday’s lows, would likely spark another wave of selling in the major stock indexes. So far today the indexes have been holding up, trading about flat to slightly positive with /ES bouncing between the 2755ish resistance & 2720ish support.
-
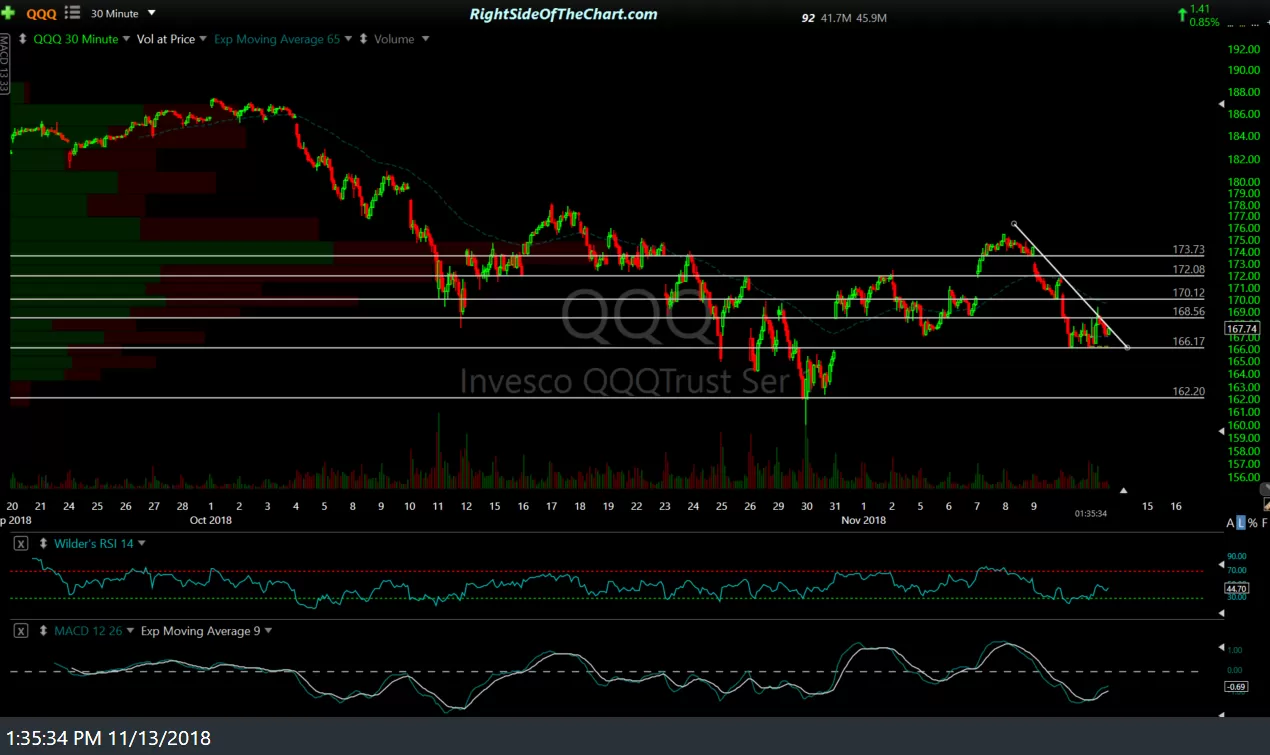
- QQQ 30-min Nov 13th
-
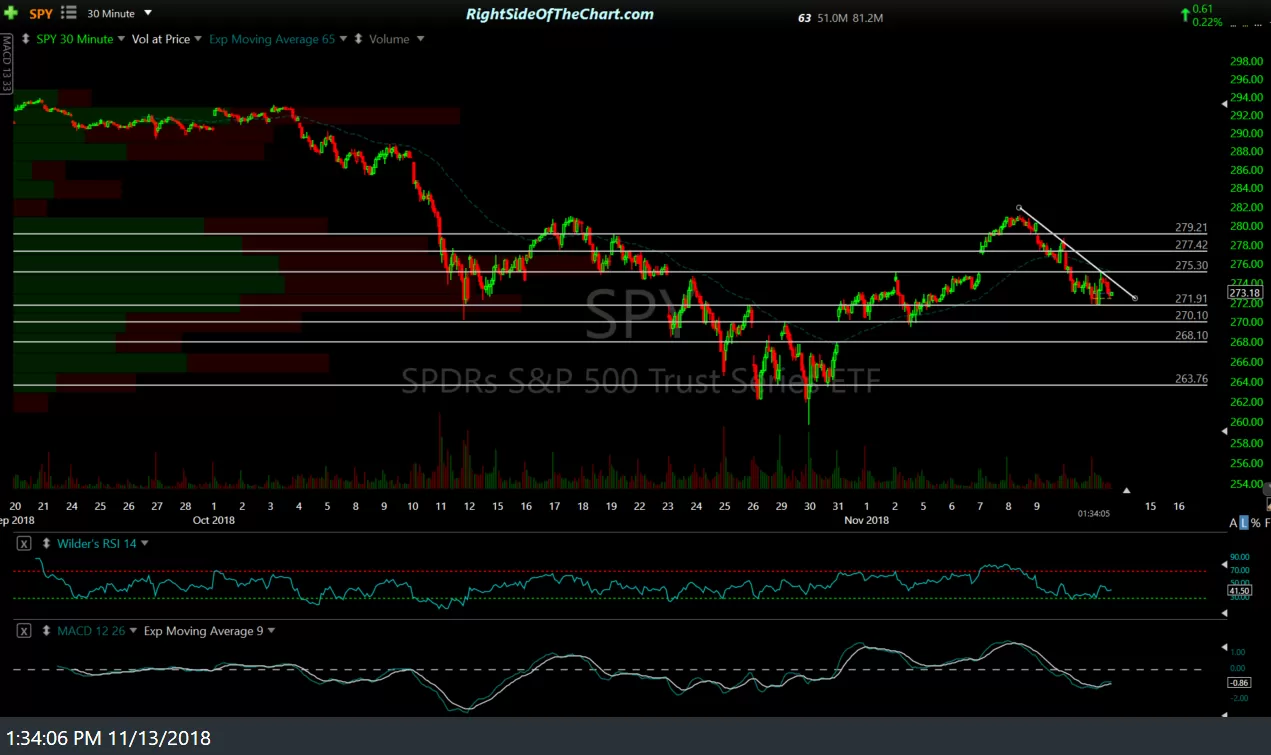
- SPY 30-min Nov 13th
As the near-term trend & as well as the technical posture of the charts on most time frames remains bearish, the odds favor more downside to come, most likely this week. However, an impulsive break above today’s highs in SPY & QQQ has the potential to foil these bearish continuation patterns. Should that prove to be the case, I have listed some overhead resistance levels that are likely to come into play, as well as some support levels below, which may or may not produce a reaction should the market break to the downside soon.
Just to reiterate, these are some potential short-term targets & possibly scenarios for SPY & QQQ. Nothing material has changed in the intermediate-term outlook that would warrant any revisions to the trade parameters (price targets & stop) on the QQQ official swing trade at this time.