
As I’ve recently posted extensive coverage on the stock market via the major stock indexes as well as the market-leading FAAMG stocks, let’s try a different approach to see where the stock market might be headed by looking at some of the risk-off assets, which tend to trade inversely to the stock market.
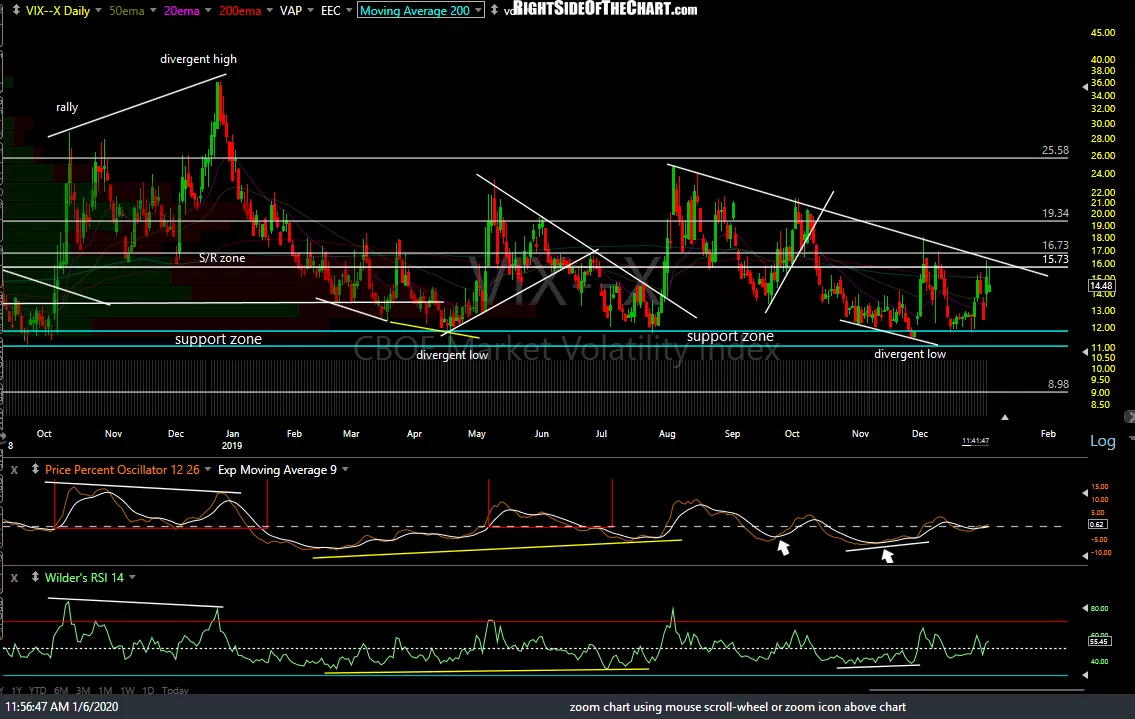
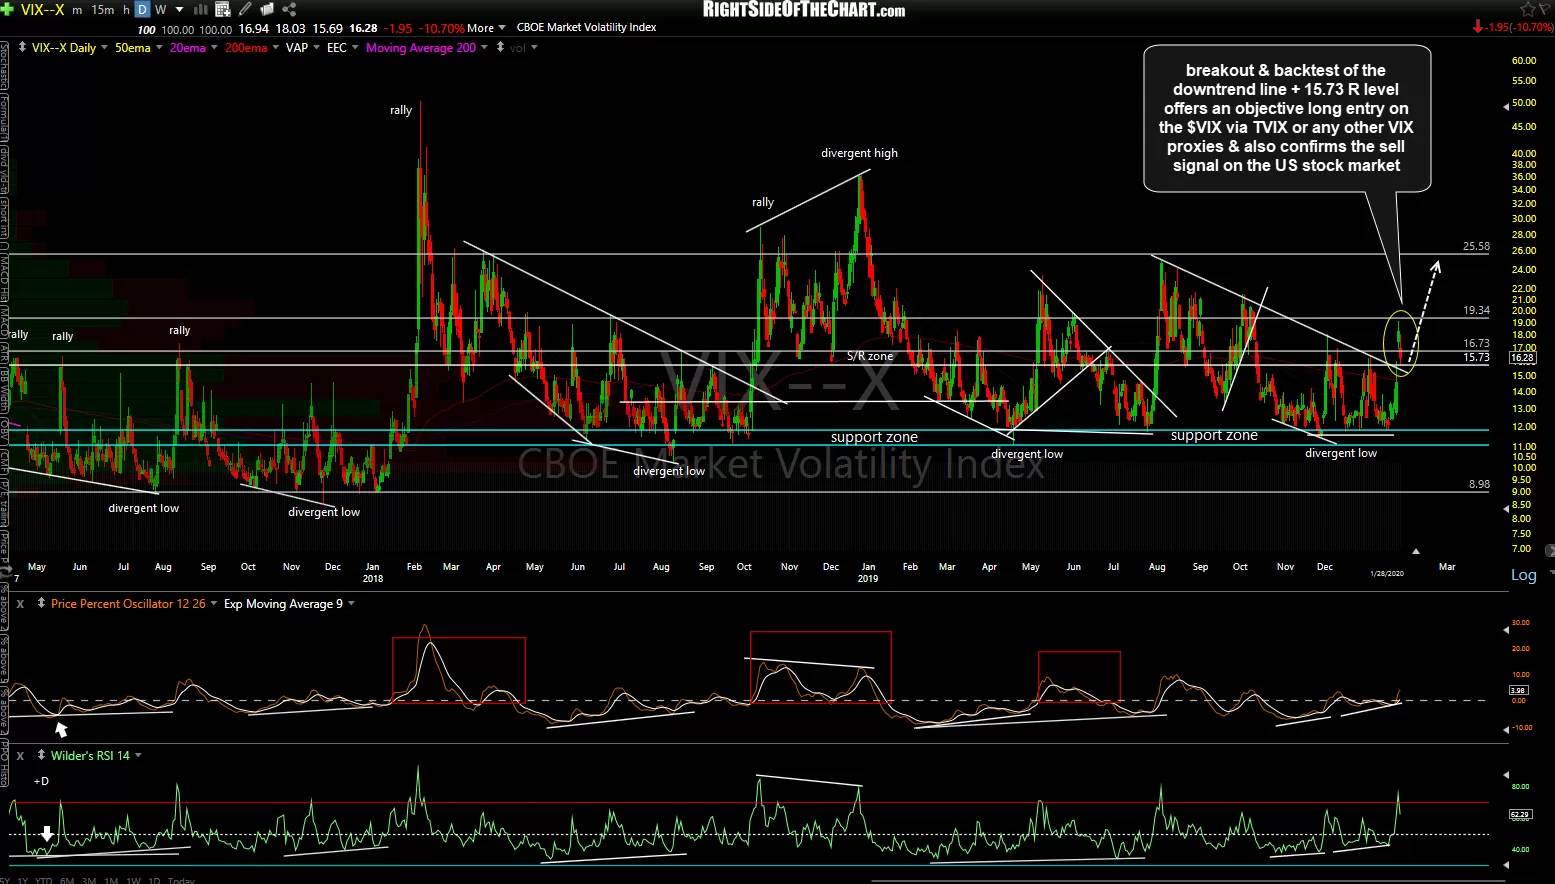
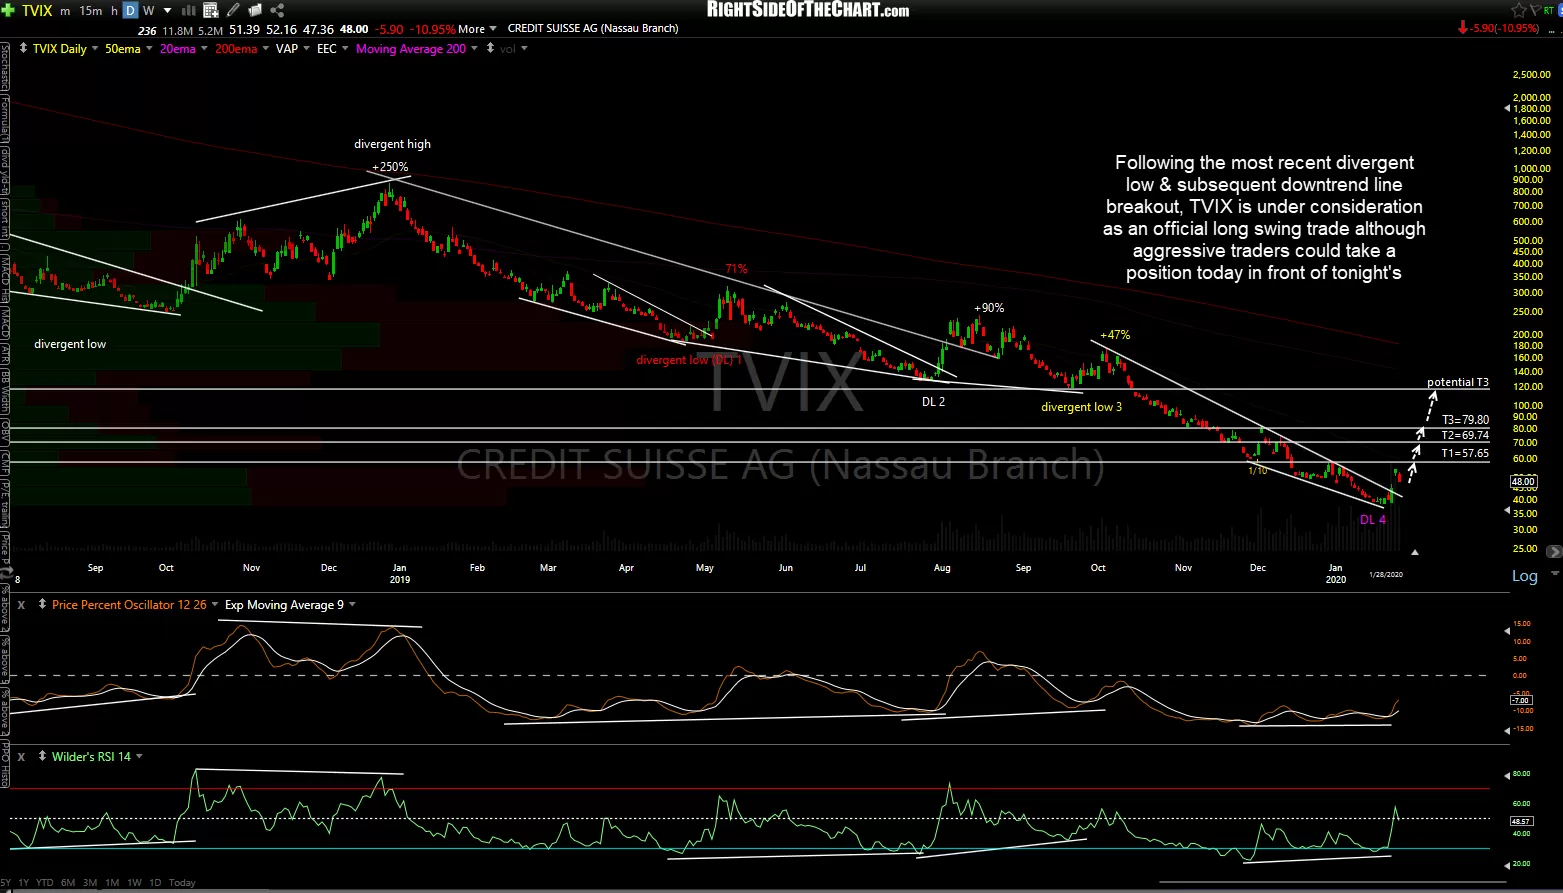
The $VIX (CBOE Market Volatility Index) has one of the tightest inverse correlations to the stock market & can often provide some useful clues to help differentiate between the typical counter-trend pullbacks with an ongoing uptrend in the stock market with more room to run compared to the pullbacks that are often the start of a much larger correction. For the latter, I look for clear breakouts above well-defined resistance levels (downtrend lines and/or price resistance) that coincide with breakdowns of well-defined bearish technical patterns and/or other support levels (uptrend lines, solid price support, rising wedges or other bearish patterns, etc…).. $VIX daily & TVIX daily chart (offering an objective but aggressive entry here with price targets listed) below.
-

- $VIX daily Jan 6th.png
-
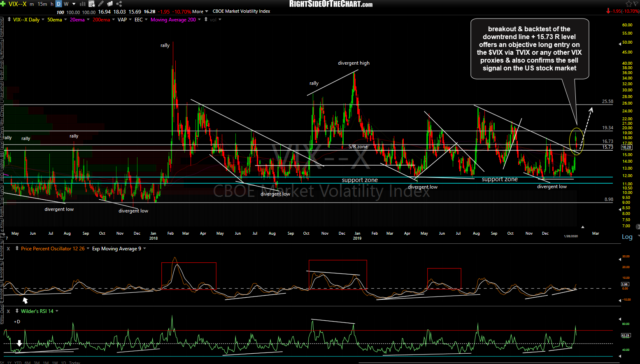
- $VIX daily Jan 29th
-
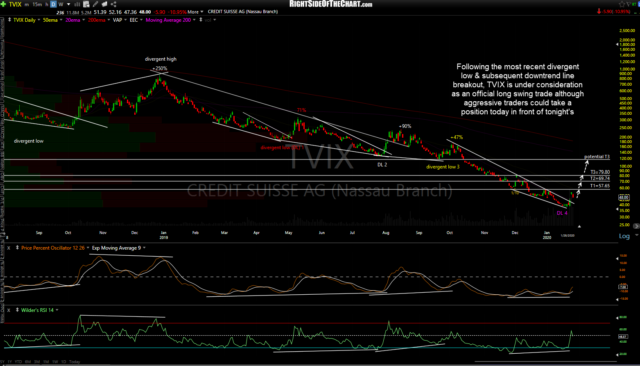
- TVIX daily Jan 29th
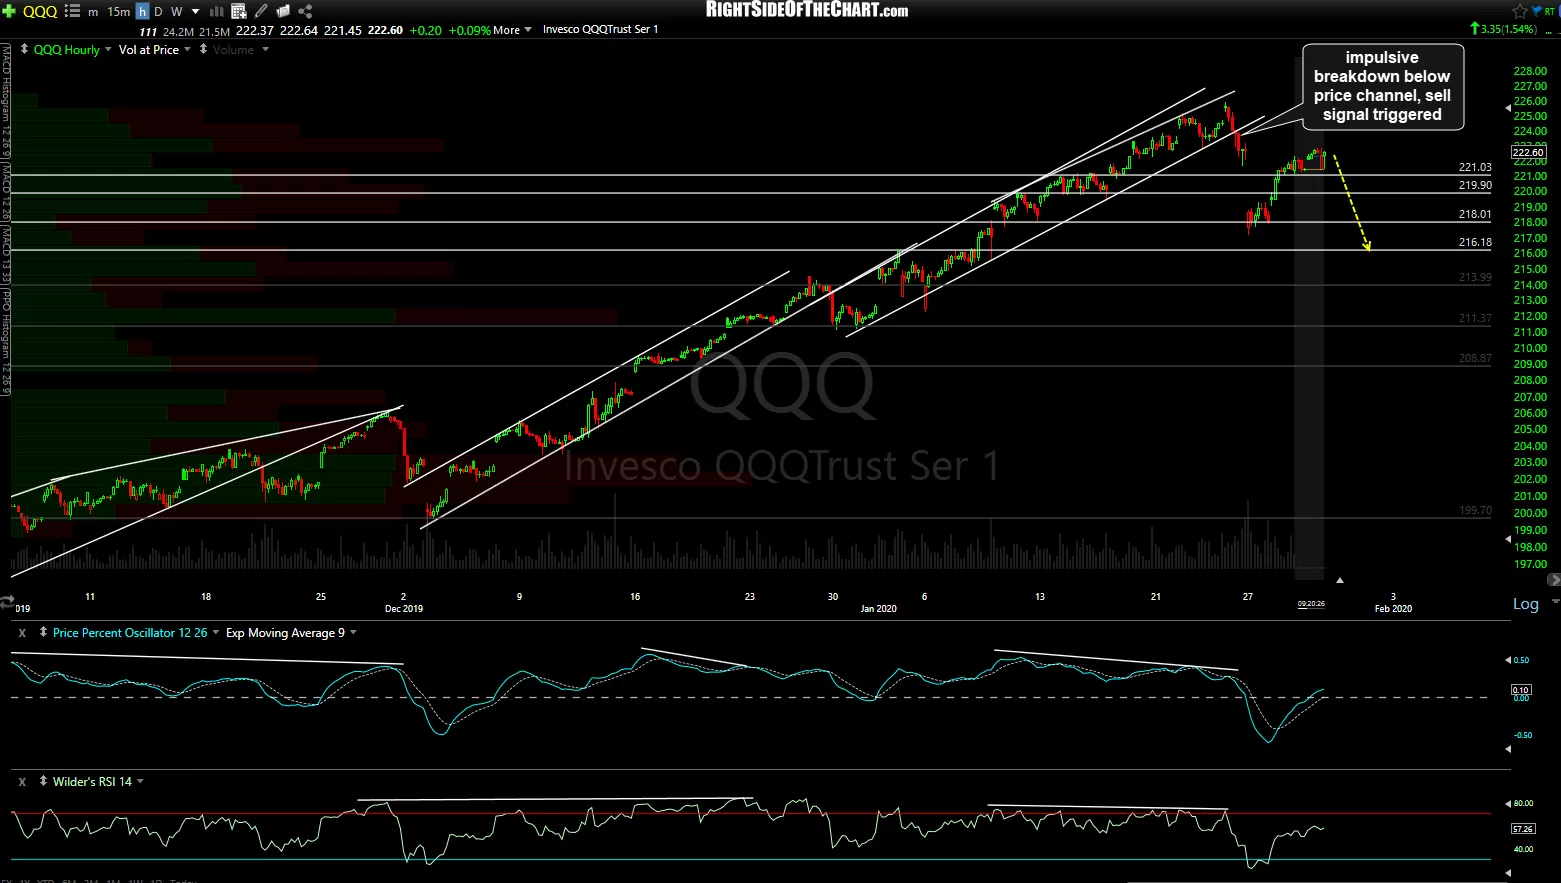
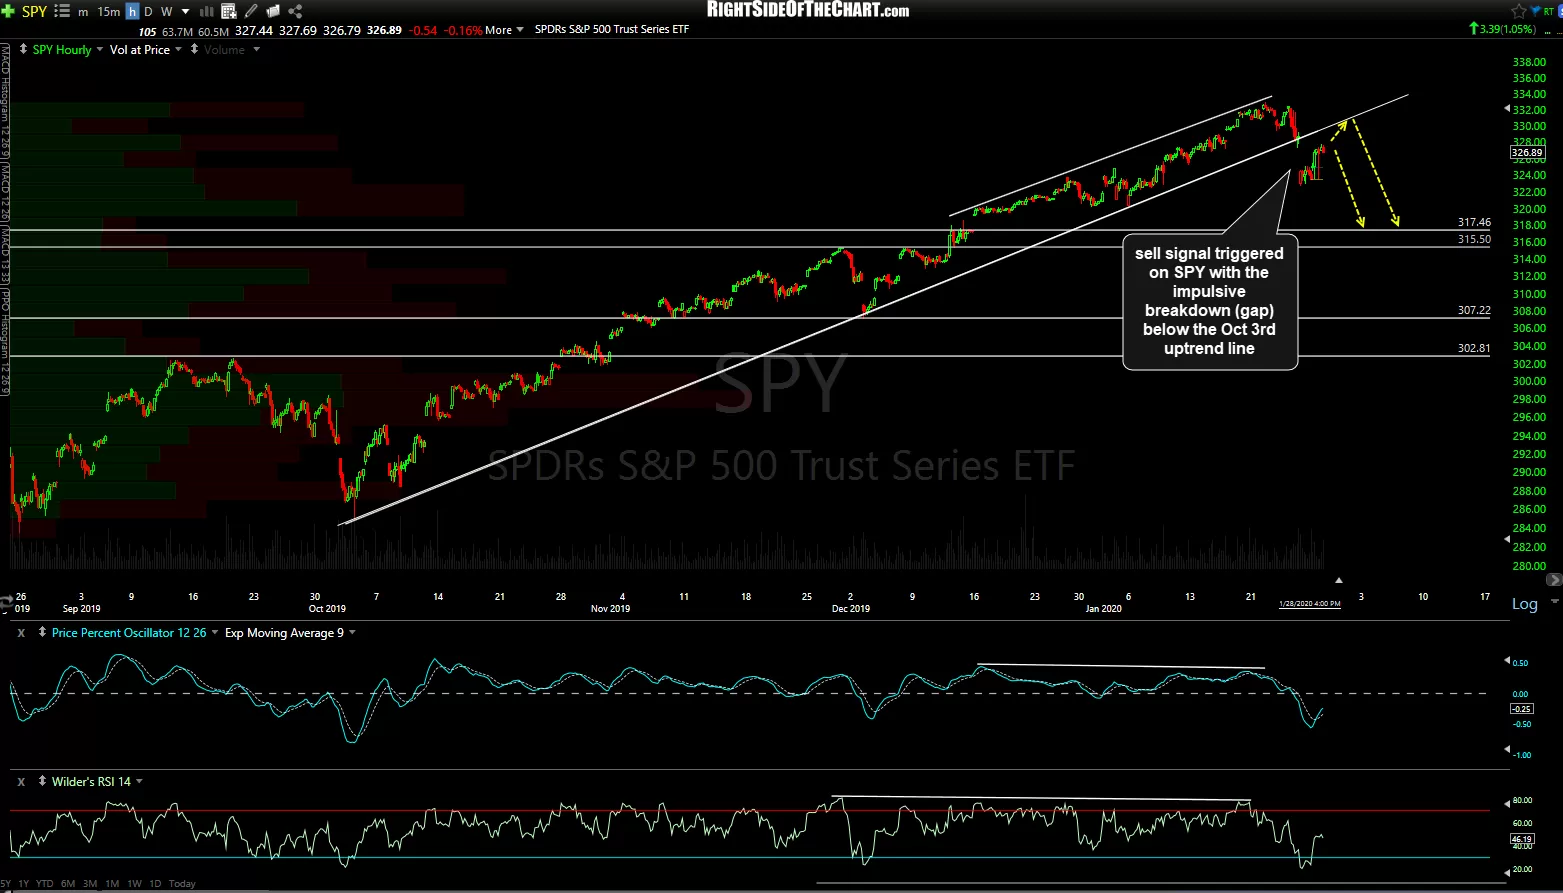
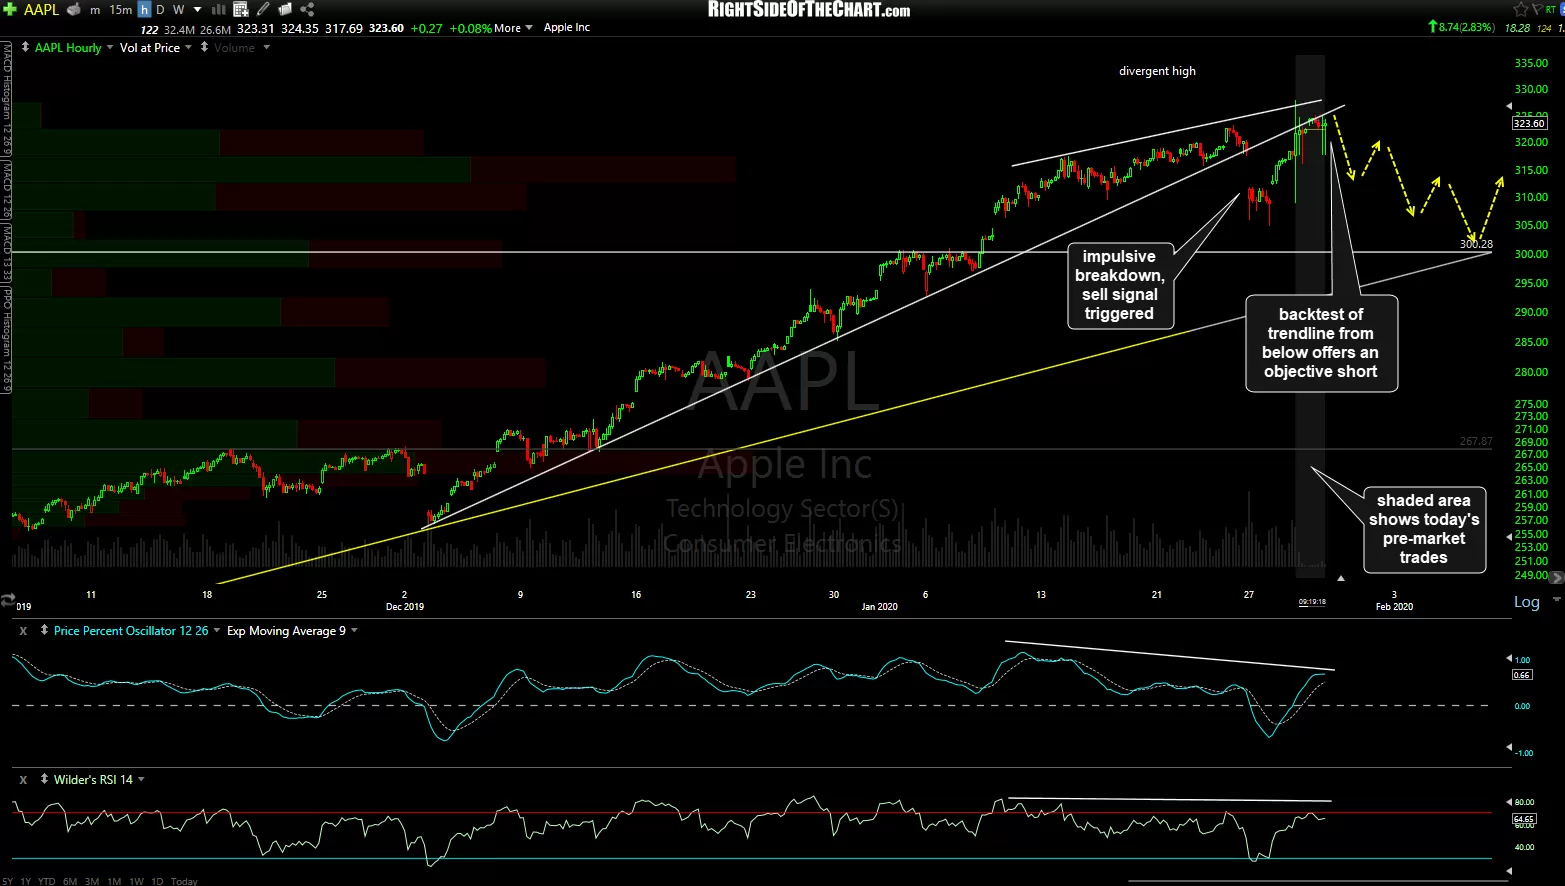
Following the sell signals that were triggered on the major stock indexes on Friday when QQQ broke down below the uptrend line off the late December lows (on the 60-minute chart) as well as the breakdown below this even larger uptrend line off the October 3, 2019 low in SPY (60-minute chart below), we had additional sell signals triggered on Monday with the impulsive breakdown below the uptrend line off the Dec 3rd lows on AAPL, the largest component of both SPY & QQQ. Additionally, we also had a solid breakout of the downtrend line + intersecting 15.73-16.73 resistance zone that I had been highlighting on the $VIX for a while now (see the first $VIXdaily chart from Jan 6th above). Essentially, we have a cluster of sell signals on multiple “stock market proxies” in addition to the stock indices themselves. With 4 of the 5 FAAMGs earnings reports still to come over the next week, each trader will have to decide whether or not to start scaling into short positions or even long positions for that matter, if they are near-term & intermediately bullish, or wait until the bulk of the FAAMG earnings are out of the way. AAPL, SPY & QQQ 60-minute charts below.
-
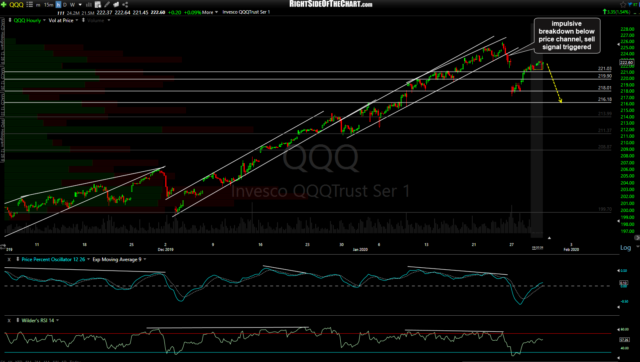
- QQQ 60m Jan 29th
-

- SPY 60m Jan 29th
-

- AAPL 60m Jan 29th
In addition to using the $VIX and AAPL as indirect proxies for confirming analysis & key technical events (buy & sell signals) on the major stock indices, the two major risk-off assets, US Treasury bonds & gold can also provide some useful clues. Similar to the recent triangle/consolidation pattern breaking in gold back in late-December, TLT (20-30 year Treasury Bond ETF) more recently broke out above a similar triangle pattern and has been moving impulsively higher since. Could this be a sign that the smart money (institutional investors) have been stealthily moving money out or equities & into the safe haven of T-bonds in anticipation of a post-FAAMG earnings correction?

TLT daily Jan 29th
Finally, GLD (gold ETF) is attempting to clearly put the key 147 level in the rear-view mirror… longer-term bullish for gold (and most likely bearish for equities) if it can while near-term bearish if these small divergences play out for a break below the minor uptrend line.

GLD daily Jan 29th
I believe that any of all of the ETFs or stocks above (GLD, AAPL, TVIX, QQQ, SPY, and TLT) with my favorites being a short on QQQ (and/or AAPL) and a long position on TVIX. Unofficial trades for now due to the upcoming FAAMG earnings although I have laid out the objective entry levels along with price targets for those interested.