
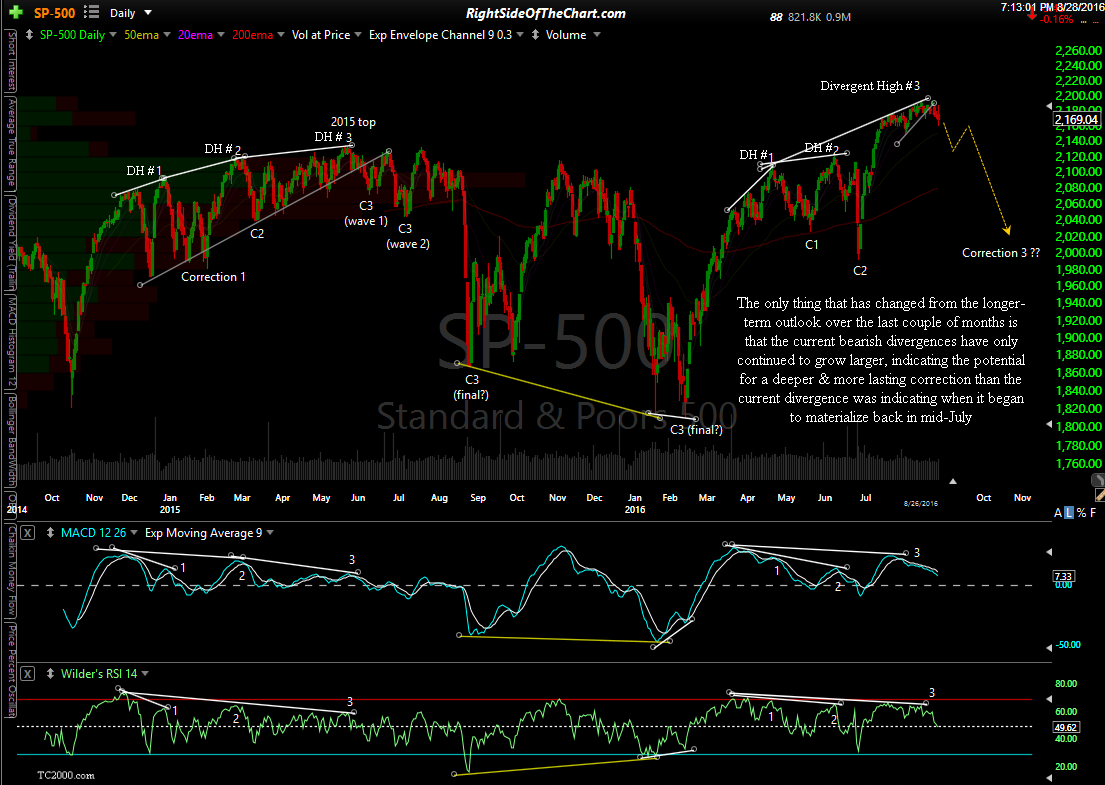
As it’s been a while since I’ve posted any updates on the bigger picture (intermediate-to-longer-term outlook) for the U.S. equity markets, let me start by saying that there really haven’t been any new developments to report. The only thing that has changed from the longer-term outlook over the last couple of months is that the current bearish divergences that I’ve pointed out have only continued to grow larger, now indicating the potential for a deeper & more lasting correction than the divergences were indicating when they began to firm up back in mid-July.
This 2-year daily chart highlights the current series of three consecutive divergent highs as well as the similar trio of divergent highs, both of which culminated as one, very large & potentially powerful divergent top with the previous divergent top back in May of 2015. That large divergent top resulted in a correction that lasted for 9 months & resulted in 15% drop in the S&P 500 before the market put in a lasting bottom in February & ultimately went on to move back above that previous high.
$SPX daily Aug 26th close
The next two charts below speak to not only the fact that the market has traded in a range of less than 2.5% over the last month and a half, trading at the same level on Friday that it traded at back on July 14th but more importantly, as indicated by the extreme pinch in the Bollinger Bands, such periods of extreme price compression are almost always followed by sharp, unidirectional moves. What I find interesting on the 7-year daily chart below is that despite the fact that the stock market was in one of the most powerful bull markets in history, you can see that, without exception, not a single one of the initial moves following a drop of the Bollinger Band widths to this level (the blue horizontal line that we just tagged) was a stock market rally, rather all were corrections ranging from about 5% to 15%.
-
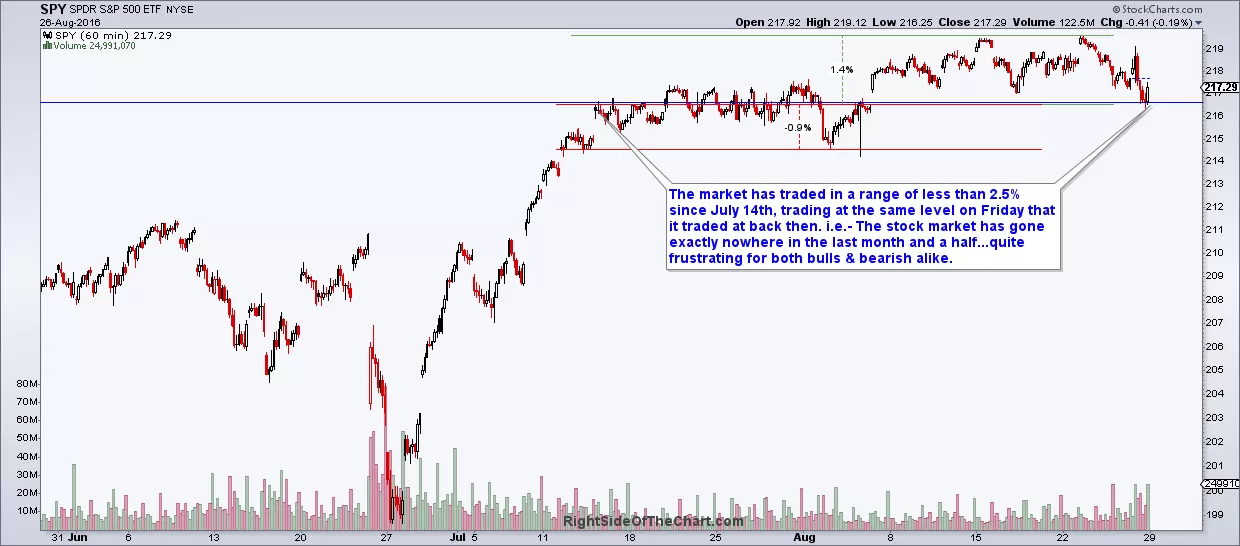
- SPY sideways trading range Aug 28th
-
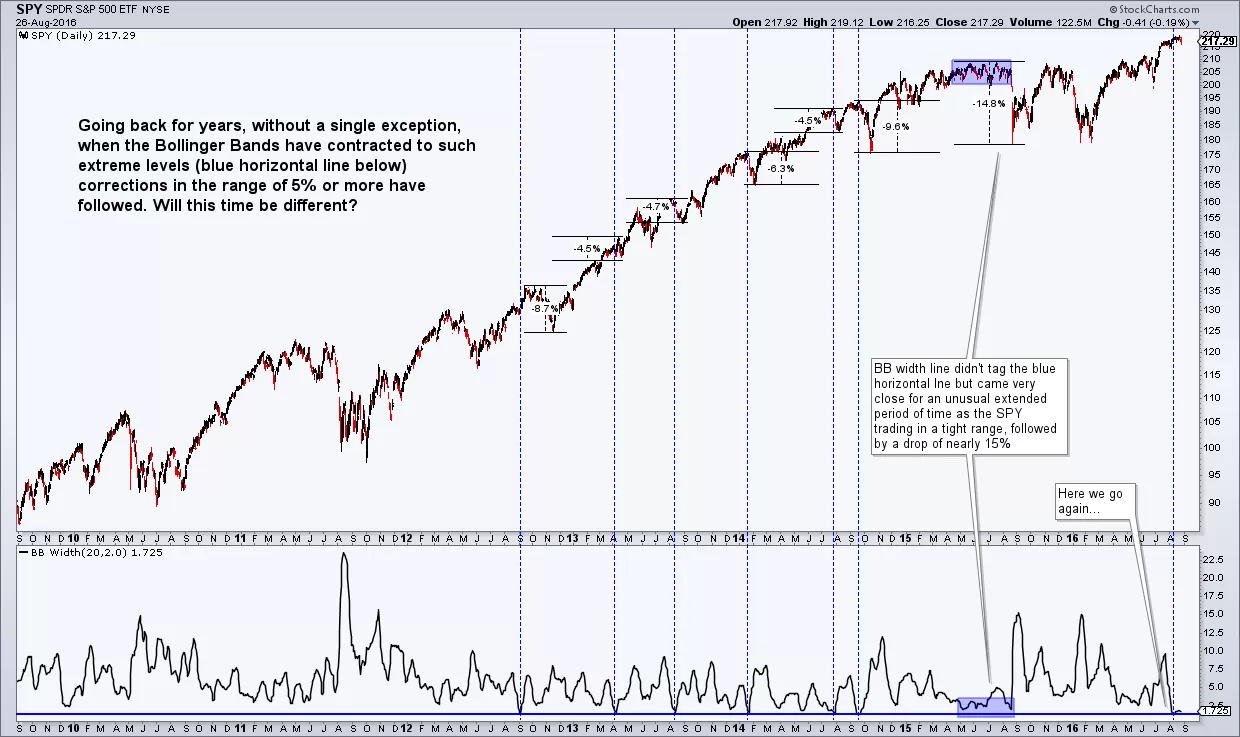
- SPY Bollinger Bands Width 8-28-16
I realize that I have been waving these warning flags for quite some time now & I’m even guilty of jumping the gun on a broad market short in anticipation of what still appears to me as an imminent correction in the broad market although doing so without confirmation of all of the sell signals on all of the major indices that I’ve been awaiting on the 60-minute charts proved to be premature and resulted in a minor (1%) loss on the IWM short trade earlier this month.
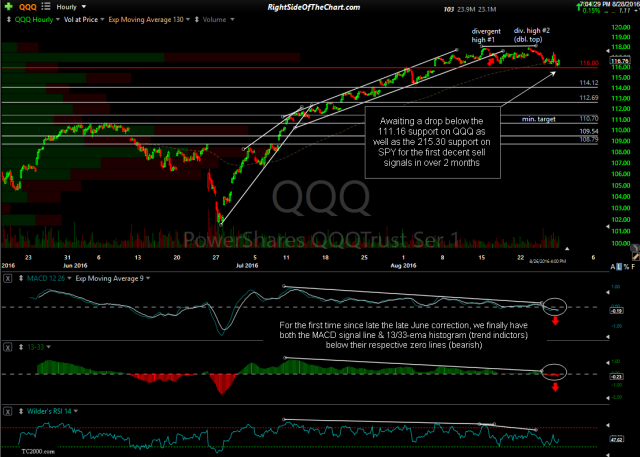
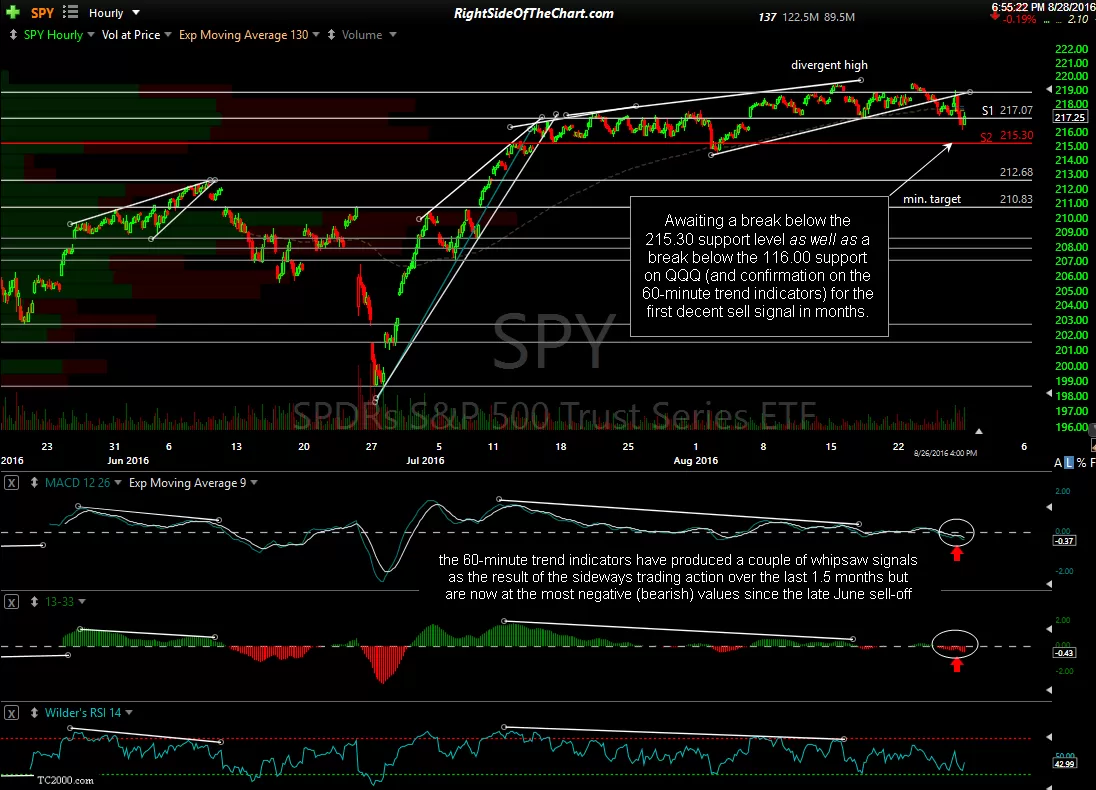
The fact that over the last month and a half, the markets have failed to move any higher than 1.4% or lower than 0.9% below that common value line in the SPY 60-minute chart above, has also resulted in an unusually low number of official trade ideas posted on RSOTC & a higher than usual failure rate on the trade ideas that were stopped out or are still active but have yet to hit their final price target yet. Again, the take away here is that periods of unusually low price compression & sideways trading ranges are often followed by unusually large, mostly unidirectional price moves in either direction as such trading ranges & periods of price compression often act a coiled springs, releasing that potential energy once the proper catalyst sparks an impulsive breakout from the trading range. That catalyst, although the media will almost certainly assign whatever the headline-de-jour is as the cause for the sudden increase in volume & large price moves in the market, is very likely to be a breakdown below the key support levels that I’m watching on the SPY (215.30) and QQQ (116.00).
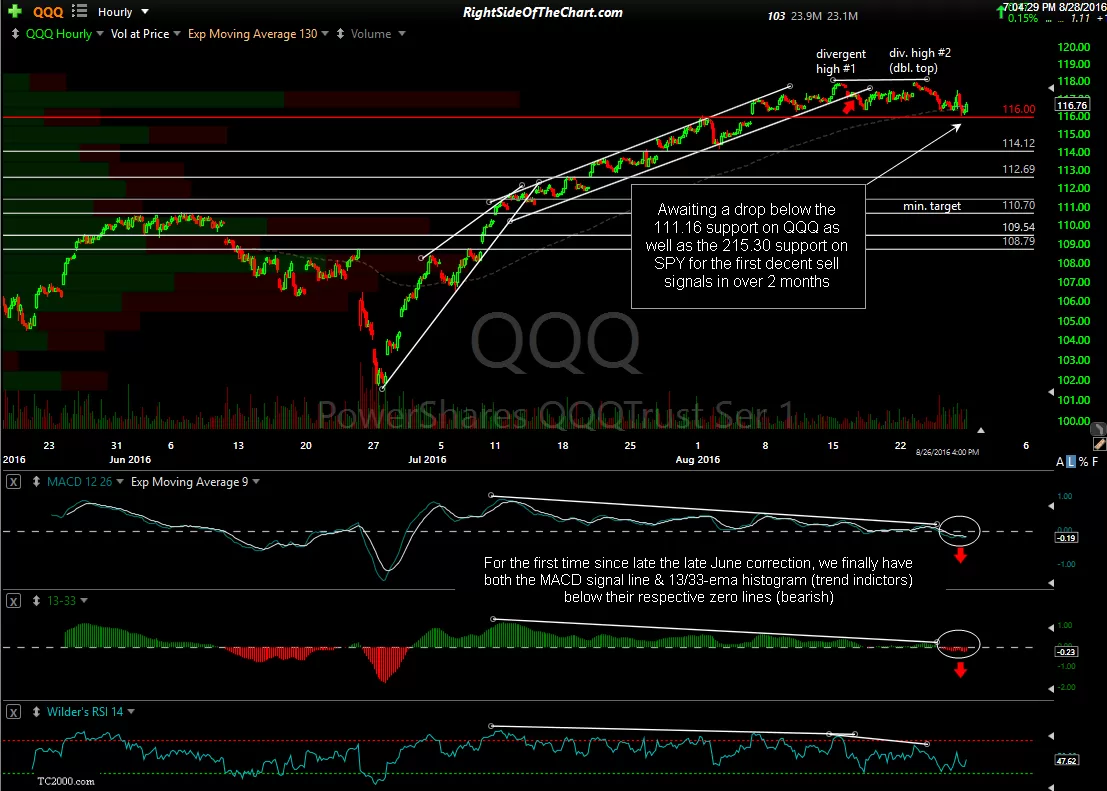
-
- QQQ 60-minute Aug 26th close
-
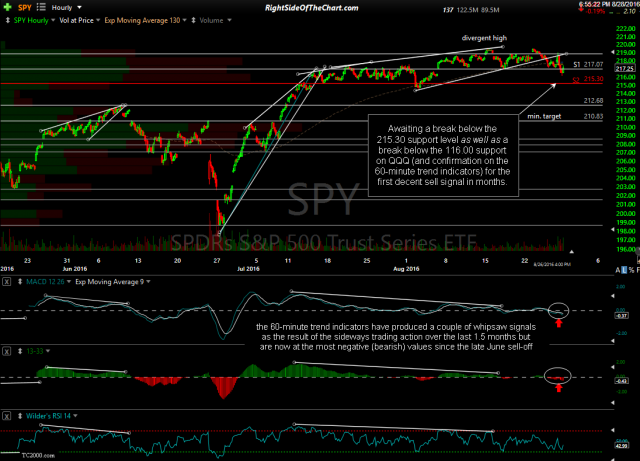
- SPY 60-minute Aug 26th close
Also worth noting is that that QQQ (Nasdaq 100), which I often refer to as the leading index, has certainly defended that title lately. Although, as with most other US stock indices, the Nasdaq 100 has flat-lined recently, the $NDX was the only major index that I’ve been tracking closely that never triggered a whipsaw sell signal on both of my 60-minute trend indicators. In fact, the last time both the MACD signal line & 13/33-ema histogram crossed below the zero line to move from bullish to bearish was back in June (early June with one very brief whipsaw buy signal that month which lasted for less than one full trading session). However, we now have both of the MACD 9-ema & the 13/33-ema histogram trading below their zero lines on both the SPY & QQQ. Now just waiting for those support levels to give way, ideally followed by impulsive selling.