
Much of the same in the U.S. equity markets: Awaiting a break below the 116.00 level in QQQ along with both the MACD 9-ema & the 13/33ema histogram crossing below their respective zero lines. Negative (bearish) divergences continue to build following the recent double-top high. 100.70 is my minimum downside swing target, about 5% below where QQQ closed yesterday. 60-minute chart:

QQQ 60-minute Aug 24th close
Unlike the QQQ, which has yet to trigger and false breakdowns or whipsaw signals on both trend indicators (MACD & 13/33-ema pair), the SPY has triggered a few brief whipsaw signals on the trend indicators & price support but still has powerful negative divergences in place that are very likely to play out for a meaningful correction any day now. First support to watch is 217.07 with a break of 215.30 likely to be the catalyst for a sharp & sustained sell-off. My minimum target for SPY is 210.83.
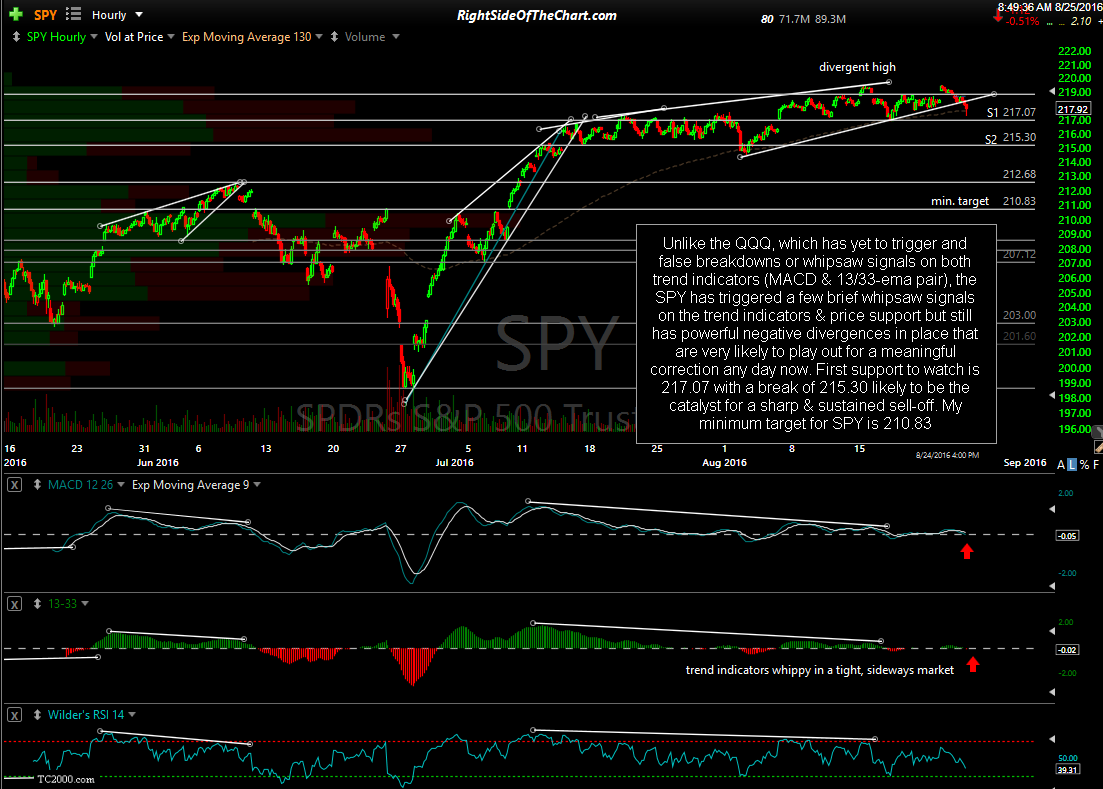
SPY 60-minute Aug 24th close
As with all diversified US indices, the negative divergences on IWM (Russell 2000 Small Cap Index ETF) continue to build & only indicate a more powerful correction once they begin to manifest in the form of a trend reversal. My minimum downside target is the 118.60-119ish support zone although the potential for a much deeper correction exists at this time.
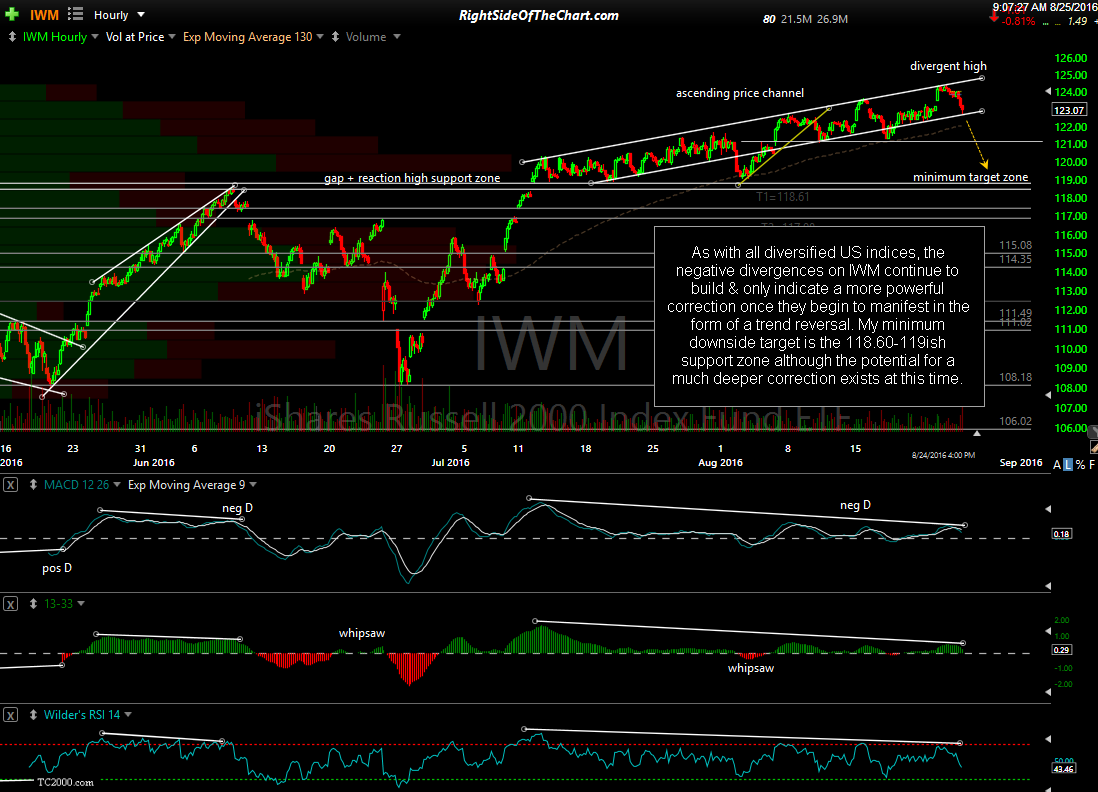
IWM 60-min Aug 24th close